Huong Giang Mai*![]() | Thi Quynh Trang Nguyen
| Thi Quynh Trang Nguyen![]() | Thuy Linh Nguyen
| Thuy Linh Nguyen![]() | Thi Nhat Linh Bui
| Thi Nhat Linh Bui![]() | Thi Khanh Linh Cao
| Thi Khanh Linh Cao![]()
© 2025 The authors. This article is published by IIETA and is licensed under the CC BY 4.0 license (http://creativecommons.org/licenses/by/4.0/).
OPEN ACCESS
This study examines the impact of climate change on national logistics performance using a panel dataset of 45 countries from 2009 to 2023. The Generalized Method of Moments (GMM) is applied to address endogeneity and ensure estimation robustness. Climate change is measured through a Climate Change Index (LnCLI), constructed from the frequency of climate-related keywords in global databases. To capture the complex dimensions of climate risks, the index is disaggregated into subcomponents representing temperature, precipitation, and wind speed changes. Empirical results reveal a significant and positive association between heightened climate awareness and improved logistics performance, particularly in developing economies where vulnerability to climate shocks is higher. Disaggregated analysis of the Logistics Performance Index (LPI) indicates that climate change discourse contributes most notably to improvements in logistics service quality (Compe) and tracking capabilities (Track), while its effects on infrastructure (Infras), customs efficiency (Custom), and shipment timeliness (Time) are comparatively limited. Robustness checks using physical climate indicators and alternative estimation methods support the consistency of findings. The study concludes that climate change, despite its disruptive nature, acts as a catalyst for adaptive investment in resilient and sustainable logistics infrastructure. These findings offer critical insights for policymakers seeking to strengthen logistics performance while advancing environmental sustainability in the face of escalating climate risks.
climate change, GMM model, logistics performance, panel data
Climate change has emerged as one of the most critical global challenges of the 21st century, threatening the stability and sustainability of economic systems worldwide. Increasingly frequent and severe weather events, including storms, floods, droughts, and sea-level rise, are disrupting both natural ecosystems and financial infrastructure. According to the Intergovernmental Panel on Climate Change [1], global average temperatures have increased by 1.1℃ since the pre-industrial era, contributing to the intensification of extreme climate events. While the consequences of climate change are widely recognized in agriculture and energy sectors, its implications for logistics, a vital enabler of global trade, are gaining urgent attention.
Logistics systems rely heavily on climate-sensitive infrastructure such as seaports, road networks, railways, and storage facilities. As extreme weather becomes more frequent, these systems face heightened risks of physical damage and operational delays. It is estimated that natural disasters affecting port infrastructure alone result in annual global trade losses of up to 81 billion US dollars and a reduction in global economic output of approximately 122 billion US dollars [2]. More than 60 per cent of global trade is handled through ports located in coastal zones that are at significant risk from sea-level rise and storms [3]. Disruptions in transportation routes, rising costs of freight, and diminished reliability in supply chains compromise not only logistics efficiency but also trade competitiveness, especially for developing countries with vulnerable infrastructure [4]. The need to explore the climate-logistics nexus is therefore essential, as logistics lies at the intersection of climate vulnerability and economic performance.
This study investigates the dynamic relationship between climate change and national logistics performance by employing a panel dataset of 45 countries over the period 2009-2023. In response to increasing environmental disruptions affecting supply chains, the study aims to provide timely insights into how climate factors influence logistics capacity and efficiency across countries. To address potential endogeneity in the model, the Generalised Method of Moments (GMM) is employed, ensuring robustness in causal estimation. A major innovation of this research is the construction of a novel Climate Change Index (LnCLI), derived from the frequency of climate-related keywords extracted from global media and institutional sources. This index is further decomposed into thematic subcomponents, including temperature, precipitation, and wind change and cross-validated with objective physical indicators to enhance measurement validity.
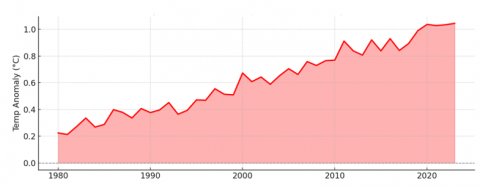
Figure 1. Global temperature anomaly (℃)
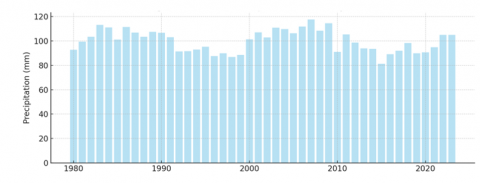
Figure 2. Global precipitation anomaly (mm)
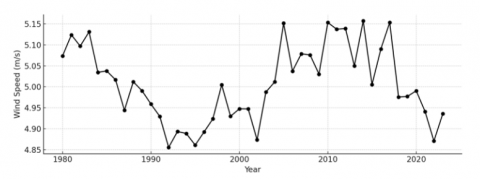
Figure 3. Global wind speed (m/s)
Figures 1-3 illustrate the long-term trends in key global climate indicators, namely temperature anomaly, precipitation deviation, and wind speed from 1980 to 2023. The data reveal a persistent rise in global surface temperature anomalies, reinforcing the scientific consensus on global warming [5]. Meanwhile, interannual fluctuations in precipitation and wind patterns highlight the increasing volatility of climate systems [5, 6]. These empirical trends provide the physical foundation for this study's analysis of the climate-logistics nexus.
By capturing both environmental reality and public awareness, this multidimensional approach offers a more comprehensive perspective on the evolving pressures of climate change. The findings provide strong empirical evidence that climate variability not only poses risks but also acts as a catalyst for upgrading logistics infrastructure and services. This research thus contributes to the growing body of literature on climate adaptation and offers actionable insights for policy frameworks that seek to build resilient, climate-responsive logistics systems in an era of increasing global volatility.
The intersection between climate change and economic performance has attracted increasing scholarly attention over the past two decades. Numerous studies have examined how rising temperatures, extreme weather events, and long-term environmental degradation affect sectors such as agriculture, public health, and energy [7, 8]. Climate risks, including sea-level rise, droughts, storms, and heatwaves, are increasingly recognized as threats to global value chains, productivity, and infrastructure stability [9]. However, research focusing specifically on the logistics sector, despite its foundational role in facilitating international trade and ensuring supply chain continuity, remains comparatively underdeveloped in both theoretical and empirical domains.
Logistics performance is widely recognized as a critical determinant of trade competitiveness, economic integration, and national development [10, 11]. The World Bank’s Logistics Performance Index (LPI) has emerged as a key global benchmark for evaluating logistics efficiency. The LPI covers six dimensions: customs performance, infrastructure quality, international shipments, logistics competence, tracking and tracing, and timeliness [12]. Multiple studies have examined the economic and institutional determinants of LPI scores, linking them to factors such as GDP per capita, governance quality, trade openness, and investment in transport infrastructure [13-15]. However, few studies have explicitly incorporated environmental or climate-related variables into the modeling of logistics performance, despite growing climate-induced disruptions to infrastructure and transport networks.
An emerging strand of literature emphasizes the increasing exposure of logistics systems to climate-related shocks. Becker et al. [16] and UNCTAD [3] highlight that seaports, airports, highways, and railways are highly vulnerable to sea-level rise, storm surges, and flooding, especially in low-lying and coastal areas. Disruptions to these assets can have cascading effects on national and regional logistics systems. The resilience of logistics operations to climate shocks is central to supply chain sustainability, especially as firms and governments respond to growing climate volatility. Verschuur et al. [2] provide compelling quantitative evidence of the economic costs of climate-induced disruptions in global logistics. Using automatic identification system (AIS) data for over 1,300 ports combined with weather data from ERA5, they estimate that port disruptions from natural disasters can result in average annual losses of \$81 billion in trade and \$122 billion in GDP. Similarly, Çevik [4] analysed the impact of 64 natural disaster events and found that floods and extreme storms can double transportation costs and extend delivery times by up to four days. These studies reinforce the urgent need to integrate climate risk into logistics and trade planning frameworks.
Despite such advancements, several research limitations remain. First, most existing studies focus on isolated case studies, such as Hurricane Katrina in the U.S. or the 2011 Thailand floods and lack cross-country comparability. While useful for highlighting localised vulnerabilities, they do not offer generalizable insights into the global climate-logistics nexus. Second, the treatment of climate variables in empirical models remains limited. Many studies rely on simple annual temperature or precipitation averages, which fail to capture the intensity, frequency, or diversity of climate-related disruptions [17]. Third, most models do not control for potential endogeneity, such as reverse causality between economic growth and climate exposure or omitted variables like emissions policies and infrastructure quality. A few studies have begun to explore more complex and integrated approaches. Liu et al. [18], using a GMM model for 42 Asian economies, found that logistics performance improvements were significantly associated with reductions in CO₂ emissions, suggesting a positive link between sustainability investments and logistics outcomes. Nicoletti and Appolloni [19] introduced the concept of Logistics 5.0, focusing on artificial intelligence, green mobility, and predictive analytics as tools for increasing energy efficiency and reducing logistics sector emissions by up to 20 percent. However, implementation remains uneven, and cost barriers limit adoption in many regions.
To address these gaps, this study develops and tests the following hypotheses:
This study aims to address the empirical and methodological gaps by conducting a comprehensive cross-country analysis of the relationship between climate change and logistics performance. This research contributes to the literature by integrating climate risk into the evaluation of logistics systems and offers a broader, policy-relevant understanding of how environmental pressures shape logistics performance across varying economic and institutional contexts. The findings aim to support the design of climate-adaptive strategies in logistics planning and provide a foundation for enhancing supply chain resilience amid accelerating climate threats.
The regression model employed in this study to evaluate the impact of renewable energy consumption on environmental pollution is expressed by the following equation:
$L P I_{i, t}=\beta_0+\beta_1 L n C L I_{i, t}+\beta_2 \operatorname{CONTROL} L_{i, t}+t+u_{i, t}$
where,
- $L P I_{i, t}$ is the Logistics Performance Index for country i at time t. The dependent variable LPIi,trepresents the overall logistics efficiency and is measured as the average score across six key dimensions provided by the World Bank: infrastructure quality (Infras), shipment capability (Ship), logistics service competence (Compe), tracking and tracing (Track), delivery timeliness (Time), and customs clearance efficiency (Custom).
- ${LnCLI}_{i, t}$ is the log-transformed Climate Change Index (CLI). The key independent variable, ${LnCLI}_{i, t}$ captures the intensity of climate-related discourse and concerns. It is derived from a frequency-based analysis of climate-related terms from global data repositories such as GDELT, LexisNexis, and policy-oriented sources including IMF, World Bank, and UN Reports. The selected keywords include: climate change, global warming, extreme weather, and rising sea levels. This approach draws from the literature on media-based economic indicators, which posits that collective discourse and information salience influence behavior, expectations, and policy responses [16]. In the context of climate change, keyword-based indices have been used to capture climate-related uncertainty, public concern, and risk perception. Such indices reflect not only the environmental phenomena themselves but also their visibility and perceived urgency across countries. This aligns with the notion that climate risk is multidimensional, encompassing both physical exposure and the degree to which it is recognized and acted upon by economic agents. To provide a more granular view of climate discourse, the study decomposes ${LnCLI}_{i, t}$ into three thematic sub-indices, each also based on keyword frequency: ${LnTem}_{i, t}$ captures discourse intensity related to temperature changes (e.g., heatwaves, temperature rise), $LnPre _{i, t}$ reflects references to precipitation and flooding (e.g., rainfall, floods, droughts), and $LnWind_{i, t}$ measures concern over wind-related events (e.g., hurricanes, storms, typhoons). To validate the robustness of this novel index, the study includes three additional objective physical climate indicators: average annual temperature (Temper), precipitation (Precipit), and wind speed (WindS) obtained from NASA [5]. The study deliberately includes both subjective (media-based) and objective (sensor-based) indicators of climate risk to capture its multidimensional nature. The media-based indices (LnCLI, LnTem, LnPre, LnWind) reflect public discourse and perceived salience of climate-related events, while the physical indicators (Temper, Precipit, WindS) represent actual environmental conditions.
- ${CONTROL}_{i, t}$ is a vector of control variables. The vector of control variables includes:
- t represents time fixed effects,
- ui,t is the error term.
Detailed definitions and sources for all variables are presented in Table 1.
Table 1. Variable descriptions
|
Variable |
Notation |
Variable Description |
Unit |
Resource |
|
Dependent variable |
LPI |
Logistics Performance Index |
Five-point scale (1-5) |
[26] |
|
Infras |
The assessment of transport infrastructure, including roads, seaports, and railways. |
Five-point scale (1-5) |
[26] |
|
|
Ship |
The ability to arrange international shipments at competitive prices. |
Five-point scale (1-5) |
[26] |
|
|
Compe |
The assessment of logistics service quality provided by suppliers. |
Five-point scale (1-5) |
[26] |
|
|
Track |
The ability to track and trace consignments in real time. |
Five-point scale (1-5) |
[26] |
|
|
Time |
The accuracy and punctuality of shipments in reaching their destination within the scheduled or expected delivery time. |
Five-point scale (1-5) |
[26] |
|
|
Custom |
The speed and transparency of customs clearance procedures. |
Five-point scale (1-5) |
[26] |
|
|
Independent Variables |
LnCLI |
The natural logarithm of the annual variation in temperature over time. |
Word frequency |
[27] |
|
LnTem |
The natural logarithm of the annual temperature variation over the years. |
Word frequency |
[27] |
|
|
Temper |
Average air temperature |
℃ |
[5] |
|
|
LnPre |
Natural logarithm of the degree of precipitation change |
Word frequency |
[27] |
|
|
Precipit |
Total annual precipitation or snowfall |
mm |
[5] |
|
|
LnWind |
Natural logarithm of the rate of change in wind speed |
Word frequency |
[27] |
|
|
WindS |
Average annual wind speed |
m/s |
[5] |
|
|
Independent variable |
LnGDP |
Natural logarithm of nominal Gross Domestic Product |
Current US$ |
[28] |
|
KOF |
PCA index of social, economic, and political globalization |
Percentage of the total |
[29] |
|
|
INF |
Inflation |
Consumer price index (annual percentage) |
[30] |
|
|
LnTRD |
Total international trade volume |
Percentage of GDP |
[31] |
|
|
LnMobile |
Mobile phone subscriptions per 100 people |
Average number of mobile subscribers (per 100 people) |
[32] |
|
|
LnPOP |
Natural logarithm of the population |
Total population |
[33] |
|
|
LnCO2 |
Natural logarithm of the per capita annual CO₂ emissions |
Tons of CO₂ per person |
[29] |
The analysis utilizes a balanced panel dataset covering 45 countries from 2009 to 2023, yielding 765 observations. The sample includes countries with diverse economic, environmental, and logistics profiles, allowing for a broad evaluation of how climate variability impacts logistics performance across different institutional contexts.
Table 2. Descriptive statistics
|
Variables |
Observation |
Mean |
Standard Deviation |
Min |
Max |
|
Dependent Variables |
|||||
|
LPI |
765 |
3.374 |
0.507 |
2.288 |
4.3 |
|
Custom |
765 |
3.148 |
0.586 |
1.959 |
4.3 |
|
Infras |
765 |
3.330 |
0.652 |
1.877 |
4.6 |
|
Shipment |
765 |
3.251 |
0.411 |
2.3 |
4.2 |
|
Compe |
765 |
3.376 |
0.558 |
2.090 |
4.4 |
|
Track |
765 |
3.453 |
0.544 |
2.23 |
4.4 |
|
Time |
765 |
3.711 |
0.456 |
2.6 |
4.52 |
|
Independent Variables |
|||||
|
CLI |
765 |
13.027 |
2.424 |
9.220 |
19.083 |
|
LnTem |
765 |
12.320 |
2.246 |
8.429 |
18.381 |
|
LnPre |
765 |
10.916 |
1.911779 |
7.065 |
17.916 |
|
LnWind |
762 |
12.008 |
2.193 |
5.481 |
17.936 |
|
Temper |
765 |
14.391 |
8.694 |
-10.32 |
29.64 |
|
Precipit |
764 |
2.758 |
2.498 |
0 |
15.47 |
|
WindS |
765 |
3.353 |
3.090 |
0.64 |
83 |
|
Control Variable |
|||||
|
LnGDP |
765 |
27.066 |
1.182 |
24.463 |
30.867 |
|
KOF |
765 |
73.996 |
11.200 |
47.06 |
90.93 |
|
INF |
765 |
4.532 |
6.485 |
-2.080 |
72.309 |
|
LnTRD |
765 |
4.215 |
0.550 |
2.653 |
5.938 |
|
Mobile |
765 |
4.752 |
0.398 |
0.693 |
11.894 |
|
LnPOP |
765 |
17.482 |
1.333 |
15.275 |
21.08 |
|
LnCO2 |
765 |
12.175 |
1.276 |
9.455 |
16.359 |
The data sources are obtained from reputable organizations such as the World Bank, the World Meteorological Organization (WMO), the Organisation for Economic Co-operation and Development (OECD), and other international statistical reports. Several data preprocessing steps were applied: log transformation of highly skewed variables, exclusion of observations with substantial missing data, and alignment of variables to a country-year panel structure. Descriptive statistics for all variables are presented in Table 2, confirming sufficient variation across countries and over time to support panel data estimation.
Table 3 presents the GMM estimation results examining the effect of climate-related discourse on logistics performance (LPI). The lagged dependent variable (L.LPI) is positive and highly significant across all models, with coefficients ranging from 0.565 to 0.599 (significant at the 1% level), confirming the strong persistence of logistics performance and the importance of path dependence in infrastructure development.
The main independent variable LnCLI, constructed through textual frequency analysis of climate-related terms across global datasets, has a positive and statistically significant effect on LPI (coefficient=0.00901, p<0.05). This suggests that increased climate awareness and discourse are associated with improvements in logistics performance, likely through policy shifts and green infrastructure investments.
Further analysis incorporates LnTem, LnPre, and LnWind, which are sub-components of the Climate Change Index (LnCLI). These variables represent the frequency of specific climate-related terms (temperature, precipitation, and wind-related risks) and capture public, media, and institutional concern around particular climate threats. All three components have positive effects on LPI and are marginally significant at the 10% level. This reinforces the interpretation that higher climate discourse intensity - particularly regarding weather extremes - correlates with greater logistics responsiveness and adaptation.
Table 3. GMM estimations of the impact of Climate Change and sub-components on LPI
|
|
LPI |
LPI |
LPI |
LPI |
|
|
(1) |
(2) |
(3) |
(4) |
|
L.LPI |
0.565*** (6.40) |
0.569*** (6.27) |
0.599*** (6.50) |
0.572*** (5.77) |
|
LnCLI |
0.00901** (1.98) |
|
|
|
|
LnTem |
|
0.00777* (1.52) |
|
|
|
LnPre |
|
|
0.0126* (1.77) |
|
|
LnWind |
|
|
|
0.00974* (1.73) |
|
LnGDP |
0.123*** (3.39) |
0.121*** (3.21) |
0.165*** (3.77) |
0.163*** (3.89) |
|
KOF |
0.005* (1.73) |
0.005* (1.69) |
0.003 (0.81) |
0.004 (1.06) |
|
INF |
-0.006*** (-4.85) |
-0.006*** (-4.79) |
-0.005** (-2.32) |
-0.005** (-2.33) |
|
LnTRD |
0.113*** (3.26) |
0.112*** (3.32) |
0.138*** (3.77) |
0.128*** (3.78) |
|
LnMobile |
-0.057*** (-10.48) |
-0.056*** (-10.24) |
-0.057*** (-12.81) |
-0.055*** (-11.22) |
|
LnPOP |
-0.054** (-2.11) |
-0.054** (-2.12) |
-0.026* (-0.71) |
-0.028* (-0.72) |
|
LnCO2 |
-0.019 (-0.66) |
-0.013 (-0.43) |
-0.085 (-1.40) |
-0.081 (-1.29) |
|
_cons |
-1.362** (-2.23) |
-1.350** (-2.33) |
-2.270*** (-3.13) |
-2.148*** (-3.01) |
|
N |
765 |
765 |
765 |
765 |
Note: The numbers in parentheses below indicate the standard errors for each variable. *** denotes significance at the 1% level, ** denotes significance at the 5% level, and * denotes significance at the 10% level.
In terms of control variables, LnGDP and LnTRD maintain positive and significant effects across all models, consistent with expectations that economic scale and trade openness drive logistics performance. The KOF globalization index has a positive but weakly significant effect. Inflation, mobile phone penetration, and population size show negative associations with LPI, reflecting cost pressures and infrastructure limitations. CO₂ emissions per capita (LnCO2) show a negative but statistically insignificant relationship.
In summary, these results demonstrate that not only overall climate discourse (LnCLI) but also specific thematic concerns (LnTem, LnPre, LnWind) influence logistics performance.
Table 4 presents the GMM estimation results analyzing how climate-related discourse (LnCLI) influences six key components of the Logistics Performance Index (LPI). Across all models, the lagged dependent variables are positive and highly significant, confirming the persistence and inertia in each logistics dimension. This underscores the long-term nature of logistics system development.
Regarding the main independent variable, LnCLI, the results indicate heterogeneous effects across LPI components. The influence of climate discourse is statistically significant and positive for two components: logistics competence (Compe) and tracking and tracing (Track), with coefficients of 0.00352 (p<0.1) and 0.00326 (p<0.05), respectively. This suggests that heightened attention to climate change is driving improvements in operational efficiency and supply chain visibility—likely through digital innovations, staff training, and climate adaptation efforts in monitoring systems.
In contrast, LnCLI has no statistically significant effect on four other subcomponents: infrastructure (Infras), customs (Custom), international shipment capability (Ship), and timeliness (Time). Among these, the lack of significance for infrastructure is particularly notable. One possible explanation lies in the structural rigidity and time-intensive nature of infrastructure development, which is typically driven by long-term investment cycles and constrained by fiscal and institutional factors.
Table 4. Estimation results of the impact of climate change on LPI components
|
|
Custom |
Infras |
Shipment |
Compe |
Track |
Time |
|
L.Custom |
0.483*** (4.32) |
|
|
|
|
|
|
L.Infras |
|
0.702*** (10.24) |
|
|
|
|
|
L.Shipment |
|
|
0.420*** (3.54) |
|
|
|
|
L.Compe |
|
|
|
0.485*** (6.12) |
|
|
|
L.Track |
|
|
|
|
0.566*** (7.54) |
|
|
L.Time |
|
|
|
|
|
0.496*** (6.18) |
|
LnCLI |
0.002 (1.06) |
0.001 (0.83) |
0.002 (1.16) |
0.004* (1.79) |
0.003** (2.04) |
-0.001 (-0.74) |
|
lnGDP |
0.059*** (3.42) |
0.042*** (4.16) |
0.021 (1.42) |
0.053*** (3.31) |
0.033*** (3.95) |
0.025*** (2.58) |
|
KOFGl |
0.002 (1.35) |
0.000 (0.40) |
0.003** (2.32) |
0.002 (1.62) |
0.002*** (2.64) |
0.002** (2.15) |
|
INF |
-0.003 (-4.62) |
-0.002*** (-3.56) |
-0.003*** (-4.14) |
-0.002*** (-2.81) |
-0.002*** (-3.86) |
-0.002** (-2.29) |
|
lnTRD |
0.029* (1.77) |
0.025** (2.08) |
0.045*** (3.42) |
0.033** (2.22) |
0.030*** (2.92) |
0.026** (2.54) |
|
lnMobile |
-0.005 (-0.97) |
-0.012*** (-4.62) |
0.002* (1.69) |
-0.008** (-2.19) |
-0.008*** (-4.19) |
-0.013*** (-4.32) |
|
lnPOP |
-0.035** (-2.49) |
-0.02** (-2.49) |
0.00 (0.71) |
-0.02** (-1.98) |
-0.013* (-1.83) |
-0.008 (-1.14) |
|
lnCO2 |
-0.008 (-0.55) |
-0.000 (-0.04) |
-0.006 (-0.42) |
-0.011 (-0.75) |
-0.004 (-0.44) |
-0.002 (-0.29) |
|
_cons |
-0.516* (-1.84) |
-0.401** (-2.07) |
-0.337* (-1.43) |
-0.581** (-2.14) |
-0.364** (-2.44) |
-0.049* (-0.33) |
|
N |
765 |
765 |
765 |
765 |
765 |
765 |
Note: The numbers in parentheses below indicate the standard errors for each variable. *** denotes significance at the 1% level, ** denotes significance at the 5% level, and * denotes significance at the 10% level.
As such, short-term fluctuations in climate-related discourse may not translate into immediate changes in physical infrastructure [16]. Similarly, customs procedures and international shipment capability may require regulatory or diplomatic coordination across multiple agencies and borders, which tends to evolve slowly. The slightly negative but insignificant effect on timeliness suggests that even as climate discourse rises, immediate performance on schedule adherence may remain vulnerable to extreme weather disruptions, especially in low-resilience settings [3].
Table 5 presents the regression results of models evaluating the impact of climate change on LPI for two groups of countries: developed and developing countries. In this table, columns (1), (2), (3), and (4) show the regression results for the developed country group, while the remaining columns display the corresponding regression results for the developing country group. The results show that the persistence of LPI (L.LPI) is much stronger in developing countries, highlighting their reliance on past performance improvements. Climate-related variables (LnCLI, LnTem, LnPre, LnWind) generally have positive and significant impacts in both groups, though effects are more robust in developing countries, suggesting greater climate vulnerability. Overall, climate change appears to have a stronger influence on logistics systems in countries with weaker infrastructure and lower adaptive capacity.
Table 5. Estimation results of the impact of climate change on LPI for developed and developing countries
|
|
Developed Countries |
Developing Countries |
||||||
|
|
(1) |
(2) |
(3) |
(4) |
(5) |
(6) |
(7) |
(8) |
|
LPI |
LPI |
LPI |
LPI |
LPI |
LPI |
LPI |
LPI |
|
|
L.LPI |
0.266** (2.32) |
0.263** (2.34) |
0.263* (1.85) |
0.322** (2.30) |
0.813*** (12.45) |
0.804*** (9.18) |
0.761*** (9.47) |
0.771*** (6.79) |
|
LnCLI |
0.007* (1.41) |
|
|
|
0.007** (1.45) |
|
|
|
|
LnTem |
|
0.009* (1.48) |
|
|
|
0.007*** (0.86) |
|
|
|
LnPre |
|
|
0.010* (1.01) |
|
|
|
0.009** (1.15) |
|
|
LnWind |
|
|
|
0.01* (1.54) |
|
|
|
0.0159* (1.64) |
|
lnGDP |
0.221*** (3.41) |
0.221*** (3.48) |
0.179*** (2.70) |
0.0941 (1.35) |
0.048 (1.56) |
0.041 (1.12) |
0.118** (2.10) |
0.165** (2.31) |
|
KOF |
0.007 (1.49) |
0.006 (1.17) |
0.008 (1.61) |
0.008 (1.16) |
0.000 (0.11) |
0.002 (0.53) |
0.002 (0.60) |
0.000 (0.03) |
|
INF |
-0.022*** (-3.37) |
-0.023*** (-3.58) |
-0.022*** (-3.56) |
-0.021*** (-3.15) |
-0.005*** (-4.43) |
-0.005*** (-4.23) |
-0.003* (-1.24) |
-0.000* (-0.20) |
|
lnTRD |
0.144** (2.31) |
0.156*** (2.59) |
0.138** (2.55) |
0.110* (1.56) |
0.102*** (3.32) |
0.095*** (2.58) |
0.135*** (3.08) |
0.166*** (3.17) |
|
lnMobile |
0.110 (0.85) |
0.069 (0.56) |
0.104 (1.25) |
0.153 (1.41) |
-0.081*** (-3.71) |
-0.081*** (-3.62) |
-0.075*** (-3.95) |
-0.073*** (-3.83) |
|
lnPOP |
-0.189*** (-3.70) |
-0.196*** (-4.09) |
-0.242** (-2.12) |
-0.289*** (-2.72) |
-0.022* (-1.67) |
-0.012** (-0.71) |
-0.019* (-1.03) |
-0.021* (-0.78) |
|
lnCO2 |
0.052 (1.33) |
0.061 (1.40) |
0.139 (1.07) |
0.251 (2.20) |
-0.014 (-0.60) |
-0.002 (-0.08) |
-0.089 (-1.31) |
-0.152 (-1.75) |
|
_cons |
-2.527*** (-3.08) |
-2.261** (-2.50) |
-1.541* (-1.08) |
-0.152* (-0.11) |
-0.265** (-0.44) |
-0.439*** (-0.62) |
-1.377* (-1.48) |
-1.999* (-1.78) |
|
N |
417 |
417 |
417 |
417 |
348 |
348 |
348 |
348 |
Note: The numbers in parentheses below indicate the standard errors for each variable. *** denotes significance at the 1% level, ** denotes significance at the 5% level, and * denotes significance at the 10% level.
Table 6. Estimation results of the impact of substitution measurement of climate change on LPI
|
|
(1) |
(2) |
(3) |
|
LPI |
LPI |
LPI |
|
|
L.LPI |
0.441*** (3.67) |
0.611*** (6.57) |
0.627*** (7.52) |
|
Temper |
0.014** (1.99) |
|
|
|
Precipit |
|
0.017* (1.05) |
|
|
WindS |
|
|
0.002* (0.38) |
|
LnGDP |
0.137*** (2.65) |
0.088** (2.18) |
0.090** (2.32) |
|
KOF |
0.014** (2.18) |
0.007* (1.74) |
0.006* (1.88) |
|
INF |
-0.006** (-2.30) |
-0.006*** (-5.11) |
-0.006*** (-4.70) |
|
lnTRD |
0.046* (0.63) |
0.065* (1.65) |
0.081** (2.17) |
|
lnMobile |
-0.055*** (-8.27) |
-0.055*** (-11.02) |
-0.055*** (-12.90) |
|
lnPOP |
-0.090* (-1.80) |
-0.051** (-2.09) |
-0.036* (-1.58) |
|
lnCO2 |
-0.002 (-0.04) |
0.007 (0.20) |
-0.008 (-0.32) |
|
_cons |
-1.337** (-1.46) |
-0.817** (-1.26) |
-0.958** (-1.55) |
|
N |
765 |
765 |
765 |
Note: The numbers in parentheses below indicate the standard errors for each variable. *** denotes significance at the 1% level, ** denotes significance at the 5% level, and * denotes significance at the 10% level. The S-test is the Sargan test using the J-statistic to test the null hypothesis H0. AR(1) and AR(2) check the correlation of the instrumental variables.
Table 6 presents robustness checks using objective physical climate indicators that are temperature (Temper), precipitation (Precipit), and wind speed (WindS) as substitutes for the text-based climate index. The results are broadly consistent with the main findings. All three indicators show positive coefficients, with temperature (0.014) and precipitation (0.017) being statistically significant at the 5% and 10% levels, respectively, confirming that climate variability influences logistics performance. Overall, the consistency across these models reinforces the reliability of the main results and validates the use of the Climate Language Index.
Table 7 provides robustness checks using OLS, FEM, and REM estimations to validate the core results of the GMM model. The estimated signs and statistical significance of key variables including LnCLI, its components (LnTem, LnPre, LnWind), and control variables are largely consistent across models. Climate-related variables remain positively associated with logistics performance, though with slightly varying magnitudes. These results confirm the stability and reliability of the main findings under alternative estimation techniques.
Table 7. Estimation results of the impact of the climate change and its components on LPI using the OLS, FEM, and REM models
|
|
OLS |
OLS |
OLS |
OLS |
FEM |
FEM |
FEM |
FEM |
REM |
REM |
REM |
REM |
|
|
(1) |
(2) |
(3) |
(4) |
(5) |
(6) |
(7) |
(8) |
(9) |
(10) |
(11) |
(12) |
|
LPI |
LPI |
LPI |
LPI |
LPI |
LPI |
LPI |
LPI |
LPI |
LPI |
LPI |
LPI |
|
|
LnCLI |
0.020*** (4.29) |
|
|
|
0.007* (1.35) |
|
|
|
0.005* (1.45) |
|
|
|
|
LnTem |
|
0.018*** (3.47) |
|
|
|
0.007* (1.25) |
|
|
|
0.005* (1.45) |
|
|
|
LnPre |
|
|
0.041*** (6.83) |
|
|
|
0.019*** (2.63) |
|
|
|
0.013** (2.53) |
|
|
LnWind |
|
|
|
0.021*** (3.90) |
|
|
|
0.014** (2.45) |
|
|
|
0.009** (2.32) |
|
LnGDP |
0.315*** (14.81) |
0.317*** (14.82) |
0.299*** (14.21) |
0.312*** (14.52) |
0.092** (2.26) |
0.093** (2.27) |
0.08** (1.98) |
0.09** (2.12) |
0.186*** (5.54) |
0.183*** (5.40) |
0.184*** (5.52) |
0.179*** (5.31) |
|
KOF |
0.011*** (6.32) |
0.011*** (6.28) |
0.012*** (6.70) |
0.012*** (6.54) |
0.010* (1.96) |
0.011** (2.11) |
0.008 (1.58) |
0.009* (1.70) |
0.019*** (5.79) |
0.019*** (5.80) |
0.018*** (5.64) |
0.018*** (5.48) |
|
INF |
-0.01*** (-4.58) |
-0.009*** (-4.38) |
-0.009*** (-4.31) |
-0.01*** (-4.45) |
-0.008*** (-4.53) |
-0.008*** (-4.52) |
-0.008*** (-4.52) |
-0.008*** (-4.44) |
-0.008*** (-4.51) |
-0.008*** (-4.51) |
-0.00*** (-4.52) |
-0.008*** (-4.48) |
|
LnTRD |
0.255*** (10.75) |
0.253*** (10.61) |
0.264*** (11.35) |
0.250*** (10.53) |
0.048 (0.74) |
0.043 (0.66) |
0.044 (0.69) |
0.038 (0.59) |
0.110** (2.35) |
0.105** (2.23) |
0.119*** (2.59) |
0.106** (2.24) |
|
LnMobile |
-0.078*** (-3.03) |
-0.075*** (-2.90) |
-0.088*** (-3.49) |
-0.080*** (-3.08) |
-0.044** (-2.32) |
-0.043** (-2.29) |
-0.046** (-2.46) |
-0.045** (-2.39) |
-0.052*** (-2.79) |
-0.051*** (-2.76) |
-0.057*** (-3.02) |
-0.054*** (-2.92) |
|
LnPOP |
-0.125*** (-7.69) |
-0.120*** (-7.41) |
-0.129*** (-8.14) |
-0.120*** (-7.42) |
0.145 (0.64) |
0.165 (0.74) |
-0.03 (-0.13) |
-0.006 (-0.03) |
-0.087* (-2.36) |
-0.086** (-2.31) |
-0.098*** (-2.75) |
-0.097** (-2.57) |
|
LnCO2 |
-0.067*** (-4.03) |
-0.066*** (-3.93) |
-0.059*** (-3.60) |
-0.069*** (-4.09) |
-0.043 (-0.69) |
-0.042 (-0.65) |
-0.020 (-0.33) |
-0.014 (-0.22) |
-0.015 (-0.42) |
-0.013 (-0.35) |
-0.007 (-0.21) |
-0.006 (-0.17) |
|
_cons |
-3.893*** (-9.88) |
-4.005*** (-10.18) |
-3.692*** (-9.54) |
-3.872*** (-9.74) |
-1.943* (-0.51) |
-2.339* (-0.62) |
1.225* (0.33) |
0.606* (0.16) |
-1.631** (-2.10) |
-1.587** (-2.02) |
-1.478** (-1.96) |
-1.334* (-1.70) |
|
N |
765 |
765 |
765 |
765 |
765 |
765 |
765 |
765 |
765 |
765 |
765 |
765 |
This study provides strong empirical evidence on the link between climate change and logistics performance by employing a dynamic panel analysis using the Generalized Method of Moments (GMM) with data from 45 countries spanning 2009-2023. A key innovation of the study is the introduction of a composite Climate Change Index (LnCLI), which measures the intensity of climate-related discourse from global media and policy institutions. This index is further disaggregated into three subcomponents - LnTem (temperature-related discourse), LnPre (precipitation-related discourse), and LnWind (wind-related discourse) - to better capture the thematic diversity of climate concerns.
The results confirm that climate change, when proxied by both the composite LnCLI and its subcomponents, positively affects national logistics performance. Specifically, LnCLI has a significant and positive impact on the overall Logistics Performance Index (LPI), suggesting that increased climate awareness drives investment in adaptive logistics infrastructure and systems. Similarly, the subcomponents LnTem, LnPre, and LnWind also demonstrate positive effects at the 10% significance level, indicating that countries are responding to environmental stress by upgrading specific aspects of their logistics networks. These findings are reinforced by alternative physical climate indicators, including temperature (Temper), precipitation (Precipit), and wind speed (WindS), demonstrating consistency across measurement methods.
A deeper examination into LPI subcomponents reveals that climate concerns have uneven effects across different logistics dimensions. Climate discourse appears to have a significant positive effect on logistics competence (Compe) and tracking ability (Track), which may be attributed to the adoption of organizational reforms, implementation of digital technologies, and increased investment in workforce training. In contrast, its influence on other key dimensions, namely infrastructure (Infras), customs efficiency (Custom), and delivery timeliness (Time), is statistically insignificant. This variation in impact suggests that certain aspects of logistics performance are less responsive to climate discourse in the short term. Specifically, improvements in physical infrastructure typically require substantial capital investment and are subject to public budgetary constraints and long-term planning processes. Similarly, enhancing customs efficiency often depends on complex regulatory reforms and international cooperation, which tend to evolve gradually over time.
When comparing across country groups, developing countries exhibit stronger sensitivity to climate variables, with larger coefficient sizes and higher significance levels. This suggests that while these countries are more vulnerable to climate shocks due to weaker infrastructure, they may also be more responsive in policy adaptation. Developed countries, in contrast, show more muted effects, possibly due to already established resilience mechanisms. This divergence underlines the importance of tailoring policy responses to local development contexts.
Beyond the climate-related variables, several control factors also shape logistics performance. Economic growth (LnGDP), trade openness (LnTRD), and globalization (KOF) positively contribute to LPI, consistent with theoretical expectations. Conversely, inflation (INF), population growth (LnPOP), and mobile penetration (LnMobile) tend to have negative effects, potentially due to rising costs, congestion, or inefficiencies in last-mile delivery.
Robustness checks using alternative econometric models (OLS, FEM, REM) confirm the stability of the main results, with consistent coefficient signs and similar levels of statistical significance. Additional validation using objective climate measures (Temper, Precipit, WindSpeed) further supports the reliability of LnCLI and its subcomponents as meaningful indicators of climate impact on logistics.
In sum, climate change functions as both a challenge and a catalyst for improving logistics performance. The growing prominence of climate discourse and its subcomponents reflects a shift in public and policy attention that is translating into real-world infrastructure responses. The empirical evidence points to a transition toward greener, more adaptive, and digitally enabled logistics systems, especially in countries more exposed to environmental risks.
From a policy perspective, the empirical evidence suggests that climate-related discourse can serve as a catalyst for strengthening logistics performance. To harness this potential, policymakers should translate climate awareness into targeted interventions within national logistics strategies. Priority should be given to investments in climate-resilient infrastructure, such as storm-proof roads, elevated distribution hubs, and modular storage facilities, alongside the deployment of real-time tracking systems and early warning mechanisms for climate disruptions. Furthermore, digital innovations, including AI-enabled route optimization and blockchain-based customs clearance, should be scaled up to enhance operational agility under environmental stress. Given the stronger responsiveness of developing countries to climate discourse, these economies should prioritize foundational investments and institutional reforms to build resilience against climate shocks. In contrast, developed countries may focus on refining existing systems through technological upgrades and decarbonization strategies. Cross-national cooperation and technical assistance programs can help bridge adaptation gaps and accelerate convergence in logistics resilience across country groups. In addition, the significance of control variables such as GDP, trade openness, and globalization highlights the importance of an enabling macroeconomic environment. Policymakers are encouraged to integrate logistics upgrading into broader economic development agendas, ensure stable inflationary conditions, and promote cross-border trade facilitation. Particular attention should be given to managing demographic pressure and digital congestion, especially in urban centers, where high mobile penetration may exacerbate last-mile inefficiencies. Supportive frameworks, including public-private partnerships and green finance schemes, will be essential to enable small and medium-sized logistics providers to access adaptive technologies and align with evolving climate priorities.
In conclusion, this study contributes to the emerging literature on climate-resilient logistics by introducing a multidimensional climate index and demonstrating its positive impact on logistics performance. It highlights that the interplay between physical climate threats and societal responses is shaping the future of global supply chains. As climate change intensifies, countries that proactively invest in adaptive logistics systems will be better positioned to ensure continuity, efficiency, and competitiveness in the global trade environment.
The authors gratefully acknowledge the financial support from the Banking Academy of Vietnam.
[1] IPCC. (2021). Climate change widespread, rapid, and intensifying. https://www.ipcc.ch/2021/08/09/ar6-wg1-20210809-pr/.
[2] Verschuur, J., Koks, E.E., Hall, J.W. (2023). Systemic risks from climate-related disruptions at ports. Nature Climate Change, 13(8): 804-806. https://doi.org/10.1038/s41558-023-01754-w
[3] UNCTAD. (2020). Trade and development board trade and development commission multi-year expert meeting on transport, trade logistics and trade facilitation climate change adaptation for seaports in support of the 2030 agenda for sustainable development note by the unctad secretariat summary. https://unctad.org/system/files/official-document/cimem7d23_en.pdf.
[4] Çevik, V.A. (2024). Impacts of climate change on logistics and supply chains. Afet ve Risk Dergisi, 7(2): 368-391. https://doi.org/10.35341/afet.1361151
[5] NASA. (2024). ArcGIS web application. Nasa.gov. https://power.larc.nasa.gov/data-access-viewer/.
[6] NOAA. (2024). Global precipitation climatology project (GPCP). https://psl.noaa.gov/data/gridded/data.gpcp.html.
[7] Hsiang, S., Kopp, R., Jina, A., Rising, J., Delgado, M., Mohan, S., Rasmussen, D.J., Muir-Wood, R., Wilson, P., Oppenheimer, M., Larsen, K., Houser, T. (2017). Estimating economic damage from climate change in the United States. Science, 356(6335): 1362-1369. https://doi.org/10.1126/science.aal4369
[8] Burke, M., Hsiang, S.M., Miguel, E. (2015). Global non-linear effect of temperature on economic production. Nature, 527(7577): 235-239. https://doi.org/10.1038/nature15725
[9] Mook, B., Stephane, H., Laura, B., Tamaro, K., Marianne, F., Ulf, N., David, T., Julie, R., Adrien, V.S. (2016). SHOCK WAVES climate change and development series managing the impacts of climate change on poverty. Climate Change and Development. https://doi.org/10.1596/978-1-4648-0673-5
[10] Hausman, W.H., Lee, H.L., Subramanian, U. (2013). The impact of logistics performance on trade. Production and Operations Management, 22(2): 236-252. https://doi.org/10.1111/j.1937-5956.2011.01312.x
[11] Rodrigue, J.P. (2020). The Geography of Transport Systems (5th ed.). Routledge. https://doi.org/10.4324/9780429346323
[12] World Bank. (2016). Connecting to compete 2016: Trade logistics in the global economy. https://www.worldbank.org/en/news/feature/2016/06/28/connecting-to-compete-2016-trade-logistics-in-the-global-economy.
[13] Wang, M.L., Choi, C.H. (2018). How logistics performance promote the international trade volume? A comparative analysis of developing and developed countries. International Journal of Logistics Economics and Globalisation, 7(1): 49-70. https://doi.org/10.1504/IJLEG.2018.090504
[14] Shikur, Z.H. (2022). The role of logistics performance in international trade: A developing country perspective. World Review of Intermodal Transportation Research, 11(1): 53-69. https://doi.org/10.1504/WRITR.2022.123100
[15] Rakauskienė, O.G., Petkevičiūtė-Stručko, M. (2022). Determinants of logistics’ performance: A new approach towards analysis of economic corridors and institutional quality impact. Insights into Regional Development, 4(3): 11-33. http://doi.org/10.9770/IRD.2022.4.3(1)
[16] Becker, A., Ng, A.K., McEvoy, D., Mullett, J. (2018). Implications of climate change for shipping: Ports and supply chains. Wiley Interdisciplinary Reviews: Climate Change, 9(2): e508. https://doi.org/10.1002/wcc.508
[17] Apte, A. (2010). Humanitarian logistics: A new field of research and action. Foundations and Trends® in Technology, Information and Operations Management, 3(1): 1-100. https://doi.org/10.1561/0200000014
[18] Liu, J., Yuan, C., Hafeez, M., Yuan, Q. (2018). The relationship between environment and logistics performance: Evidence from Asian countries. Journal of Cleaner Production, 204: 282-291. https://doi.org/10.1016/j.jclepro.2018.08.310
[19] Nicoletti, B., Appolloni, A. (2024). Green logistics 5.0: A review of sustainability-oriented innovation with foundation models in logistics. European Journal of Innovation Management, 27(9): 542-561. https://doi.org/10.1108/EJIM-07-2024-0787
[20] Bank, W. (2021). World Development Report 2021: Data for Better Lives. Washington, DC: World Bank.
[21] Gygli, S., Haelg, F., Potrafke, N., Sturm, J.E. (2019). The KOF globalisation index-revisited. The Review of International Organizations, 14(3): 543-574. https://doi.org/10.1007/s11558-019-09344-2
[22] Barro, R.J. (1995). Inflation and economic growth. Bank of England Quarterly Bulletin, 35(2): 166-176. https://doi.org/10.3386/w5326
[23] Dollar, D., Kraay, A. (2004). Trade, growth, and poverty. The Economic Journal, 114(493): F22-F49. https://doi.org/10.1111/j.0013-0133.2004.00186.x
[24] Lee, S.H., Levendis, J., Gutierrez, L. (2012). Telecommunications and economic growth: An empirical analysis of sub-Saharan Africa. Applied Economics, 44(4): 461-469. https://doi.org/10.1080/00036846.2010.508730
[25] OECD. (2020). CO₂ Emissions from Fuel Combustion Highlights. Paris: OECD Publishing.
[26] World Bank (2024). Logistics performance index: Connecting to compete. https://lpi.worldbank.org/.
[27] Google Trends. (2024). https://trends.google.com/, accessed on Aug. 1, 2025.
[28] World Bank. (2024). GDP (current US$). https://data.worldbank.org/indicator/NY.GDP.MKTP.CD.
[29] Swiss Economic Institute (2024). KOF globalisation index. https://kof.ethz.ch/en/forecasts-and-indicators/indicators/kof-globalisation-index.html.
[30] World Bank. (2024). Inflation, consumer prices (annual %). https://data.worldbank.org/indicator/FP.CPI.TOTL.ZG.
[31] World Bank. (2024). Trade (% of GDP). https://data.worldbank.org/indicator/NE.TRD.GNFS.ZS.
[32] World Bank. (2024). Mobile cellular subscriptions (per 100 people). https://data.worldbank.org/indicator/IT.CEL.SETS.P2.
[33] World Bank. (2024). World bank open data. https://data.worldbank.org/.