I. Ketut Suamba*![]() | Ni Nyoman Sulastri
| Ni Nyoman Sulastri![]() | Putu Perdana Kusuma Wiguna
| Putu Perdana Kusuma Wiguna![]() | Gede Mekse Korri Arisena
| Gede Mekse Korri Arisena![]() | Widhianthini
| Widhianthini![]() | Gusti Ayu Putu Kalyana Dewi
| Gusti Ayu Putu Kalyana Dewi
© 2025 The authors. This article is published by IIETA and is licensed under the CC BY 4.0 license (http://creativecommons.org/licenses/by/4.0/).
OPEN ACCESS
Water is an environmental resource needed by farmers to work on rice fields. Subak, as a traditional Balinese organization that regulates irrigation management, has set costs for irrigation water. However, it is often not in accordance with farmers' ability to pay irrigation water fees. The aim of this research is to analyze the contribution of irrigation water to farming income, analyze farmers' willingness to pay (WTP) for irrigation costs, and analyze the factors that influence farmers' WTP for improving irrigation services. The research was carried out on Subak ricefields, namely Subak Pulagan, Subak Kulub Atas, and Subak Kulub Bawah in Gianyar Regency, Bali, Indonesia. The research results show that the water value per hectare was IDR 8,484,849/year. Farmers' WTP irrigation cost is IDR 85,976/hectare to IDR 107,927/ hectare. The estimated WTP in one year is IDR 107,466/hectare/ year. The total WTP in one year is IDR 14,046,304. The variables that have a significant influence on WTP, namely, farmer's education, area of rice fields, productivity, and farmer income. Subak can use WTP approach in determining irrigation management costs. Further research can also add other factors that influence farmers' WTP irrigation costs.
Contingent Valuation Method (CVM), Subak, water value, willingness to pay (WTP)
The island of Bali, Indonesia, is renowned for its unique traditional values, vibrant culture, and natural beauty. This uniqueness makes Bali, a small island, globally recognized—highlighted by UNESCO’s 2012 designation of the Subak irrigation system as a World Cultural Heritage Site [1]. According to Bali Provincial Regulation No. 9 of 2012 concerning Subak, it is defined as a traditional organization in the field of water management at the farming level, particularly among Bali’s indigenous communities. Subak is a socio-agrarian, religious, and economic institution that has historically evolved and continues to develop [2, 3].
As an organization that manages rice field irrigation in Bali, Subak plays a vital role in ensuring the sustainability of food supply, particularly rice. Rice, as the staple food, holds significant importance and is consistently cultivated every year [4-6]. The Subak rice fields serve as planting media, with irrigation and water channels carefully maintained by Subak members. The vast expanse of these fields contributes oxygen to the environment and helps store water during the rainy season, reducing the risk of flooding. Conversely, during the dry season, the Subak system channels water to surrounding areas, contributing to local water availability.
Water, as an environmental resource, is one of the most essential inputs for rice farming. However, its use tends to be excessive due to the reliance on continuous flooding systems. Water is often perceived as a public good—freely accessible and costless—which results in a lack of awareness among farmers about its proper distribution and economic value. To promote efficiency, water use must be managed more judiciously. One way to encourage this is by assigning a value to irrigation water. Despite its importance, the concept of water pricing is rarely applied at the farmer level, leading to inefficient usage. Efficient irrigation significantly affects rice farming performance; well-managed irrigation enhances productivity and farmer income, while poor management can have the opposite effect.
The objective of this research is to analyze the contribution of irrigation water to farm income using a water valuation approach, assess farmers' willingness to pay (WTP) for irrigation services through an auction-based method (including average and total WTP), and identify the socio-economic factors that influence farmers’ WTP for improved irrigation services. The study focuses on Subak areas designated as World Cultural Heritage Sites: Subak Pulagan, Subak Kulub Atas, and Subak Kulub Bawah.
These Subak areas obtain their water from the Tirta Empul spring, located approximately 2.5 km upstream in Manukaya Village. The sites are situated in Tampaksiring Village, Tampaksiring District, Gianyar Regency—around 17 km north of Gianyar city and 1 km from the district office. The rice fields in these Subak areas are terraced, ranging from gently sloped to moderately steep.
According to data from the Agricultural Agency of Gianyar Regency, the cropping pattern at the study sites follows a paddy–paddy–secondary crop sequence. The first rice planting occurs in August, the second in January, followed by a third planting season for secondary crops in May. The timing aligns with Bali’s rainy and dry seasons. This research focuses on the first and second rice planting seasons, which rely on irrigation water. The third season, involving drought-tolerant secondary crops, is excluded from analysis. Studies examining farmers’ WTP for irrigation services remain limited in Bali.
Despite the Subak system’s ecological and cultural richness, few empirical studies have examined the economic aspects of irrigation within this traditional governance model. Existing research has explored Subak’s role in food security [5], ecosystem services from rice fields [7], land suitability and soil fertility [8, 9], farmer regeneration and labor needs [10], and post-harvest issues [11]. However, the economic valuation of water—especially its contribution to farm income and irrigation efficiency—remains underexplored [12, 13]. Although WTP approaches for improved irrigation services have been applied in other communal systems, they are rarely employed within Subak contexts [14]. Additionally, evidence integrating auction-based valuation methods or economic models such as game theory in Subak water governance is lacking [15, 16].
This study addresses these gaps by applying a valuation framework to estimate the economic contribution of irrigation water to rice farming income and by assessing farmers’ WTP using an auction-based method. Furthermore, the study evaluates socio-economic and farm-level factors influencing WTP, aiming to inform sustainable and community-accepted irrigation policies in Subak areas. This approach complements cultural and ecological management by integrating economic considerations into traditional water institutions, aligning with broader recommendations for water governance reform in communal farming systems [17].
Valuing water is essential for promoting sustainable irrigation practices. By assigning an economic value to irrigation water, both farmers and institutions can better recognize its scarcity and importance, leading to more efficient and equitable use. In traditional systems like Subak, where water is communally managed and often seen as freely available, the lack of valuation may lead to overuse or conflict. Integrating water valuation into Subak can foster sustainable water management by encouraging efficiency, promoting conservation behavior, and supporting cost-recovery mechanisms for irrigation services. Recent global assessments have highlighted the economic value of irrigation water in agriculture and its role in guiding policies and investments for long-term sustainability [18]. Empirical studies also demonstrate that farmers’ WTP for improved services offers practical insights for designing locally tailored, sustainable irrigation strategies. Such approaches are increasingly crucial as irrigation systems face mounting pressure from water scarcity and climate change [19].
This study is guided by three main hypotheses. First, irrigation water in Subak rice fields significantly contributes to farm income, reflecting its vital role in agricultural productivity. Second, it is hypothesized that Subak farmers exhibit a positive WTP for irrigation services, aligned with their recognition of water’s economic value. Third, socio-economic characteristics, such as education, landholding size, productivity, and income, are expected to significantly influence farmers' WTP. These hypotheses provide the foundation for the empirical analysis and offer insights into how traditional institutions like Subak can incorporate economic valuation to support sustainable water management.
2.1 Tri Hita Karana
Tri Hita Karana (THK), which translates to “Three Causes of Well-being,” is a core philosophical concept in Balinese culture that emphasizes harmony between humans and God (parhyangan), humans and other humans (pawongan), and humans and nature (palemahan). This principle deeply informs the social and environmental systems in Bali, particularly in the management of agriculture and water resources [20].
The Subak irrigation system is often cited as a practical embodiment of THK values. The organizational structure of Subak involves not only technical water distribution, but also communal religious rituals and social cooperation among farmers, reflecting the spiritual, social, and ecological balance promoted by THK [21]. Studies have shown that the integration of THK into local governance mechanisms fosters community resilience and environmental stewardship, especially in the face of modernization pressures and tourism development [22].
Recent research has attempted to operationalize THK into frameworks for sustainable development and ecosystem management. For instance, THK has been incorporated into assessments of land-use planning, sustainability indicators, and even the cultural ecosystem services approach [23]. However, most studies treat THK from a normative or philosophical angle, and fewer have quantitatively assessed its influence on behavioral aspects such as water use efficiency, conservation incentives, or WTP for environmental services [24]. This gap indicates a need for further empirical studies that connect traditional belief systems with measurable sustainability outcomes in agricultural settings.
2.2 Subak
Subak is a traditional agricultural organization that specifically manages irrigation systems for rice fields in Bali, Indonesia. Each Subak has a temple called Pura Uluncarik or Pura Bedugul, which is specifically built by landowners and farmers. This temple is dedicated to Dewi Sri, the goddess of prosperity and fertility in Balinese belief. The irrigation system is governed by a traditional leader (Pekaseh), who is also a farmer within the Subak rice fields [25].
The Subak system has become a hallmark of Balinese society. This irrigation system was developed under the strong influence of Hindu religious values and formed local wisdom, allowing farming communities in Bali to live harmoniously with nature in order to achieve optimal harvests.
Historical studies show that Subak has been known to the Balinese people since the 9th century AD. It is a self-help community system functioning to regulate the distribution of irrigation flows to each plot of rice field. This system is organized in groups and hierarchical levels, with clearly defined roles for each member [25].
The strength of Subak lies in its mutual dependence on irrigation water and its unifying spiritual element—the Subak temple. Subak is bonded by both physical needs and spiritual beliefs. Beyond its structural organization, Subak is also characterized by the religious ceremonies embedded in its practices. Within Subak, there are individual and collective rituals. These include various ceremonies conducted at the farmer level, within the Subak organization, and in other temples considered connected to the respective Subak’s water sources. These ritual activities are part of the implementation of Tri Hita Karana in Subak [26]. The THK concept is used by Subak as the foundation for activities that create harmony among humans and God, among people, and between humans and the natural environment [27].
Because of its embodiment of THK values, Subak was designated by the United Nations Educational, Scientific and Cultural Organization (UNESCO) as a World Cultural Heritage in 2012. This recognition brings with it a global responsibility to preserve the sustainability of Subak and its THK principles [1].
2.3 Economic valuation
Economic valuation represents the aggregation of individual preferences expressed through their WTP for the consumption of a healthy environment. Thus, economic valuation serves as a tool to measure public preferences for a good environment compared to a degraded one [28]. It plays a crucial role in quantifying the non-market benefits of environmental services, such as clean water, air quality, and biodiversity preservation, which are often overlooked in conventional market analysis. By assigning monetary value to these intangible benefits, economic valuation can help articulate the trade-offs involved in environmental policy and resource allocation decisions.
Fundamentally, economic valuation assists decision-makers in estimating the economic efficiency of various potential (and competing) uses, helping to understand the relationship between economic valuation and the sustainable management of natural resources and the environment [29]. This includes informing policies related to land use, water resource management, conservation planning, and environmental taxation, ensuring that the full social and ecological costs are accounted for in development strategies.
Economic assessments are based on individual choices (preferences). These choices are made by weighing the benefits and costs, comparing the expenses to be incurred with the expected outcomes. In this context, preferences reflect not only direct consumption but also ethical or existence values, such as the desire to preserve ecosystems for future generations or intrinsic appreciation of nature. Economic value reflects the amount consumers are willing to pay to obtain certain goods or services [30]. Consequently, the WTP becomes an indicator of perceived importance and utility, which can guide public investment priorities and environmental governance.
2.4 Willingness to pay (WTP)
The concept of WTP is rooted in the theory of utility, which reflects the satisfaction or benefit an individual derives from consuming a particular good or service at a given time. This satisfaction informs consumer demand and ultimately determines the quantity of goods and/or services consumed [31, 32]. In economic studies, various demographic and socioeconomic variables are often used to estimate WTP, including gender, age, occupation, education level, number of family members, and household income [33, 34].
WTP reflects the purchasing power or financial capability of individuals, households, or society to access certain goods and services. It serves as an indicator of how much value a buyer assigns to a product or service and represents the maximum amount that the buyer is willing to pay in exchange for it. Thus, WTP helps capture the perceived benefits or utility that consumers receive from their chosen goods. Understanding WTP is critical in policy design, especially in sectors such as water resource management, environmental services, and public goods provision, where market prices often do not exist or fail to reflect true social value [35].
2.5 Contingent Valuation Method (CVM)
The Contingent Valuation Method (CVM) is a survey-based technique used to estimate the value or price that individuals assign to non-market commodities, particularly environmental goods and services [36]. This method constructs hypothetical markets through carefully designed questionnaires, aiming to simulate actual market conditions as closely as possible [37]. To ensure validity, it is essential that respondents are familiar with the commodities or environmental goods being evaluated in the survey.
CVM adopts a direct elicitation approach by asking respondents how much they are willing to pay (WTP) for specific additional benefits or improvements in a given good or service. The method is widely used in environmental economics to capture the perceived economic value of public goods, such as clean water, improved irrigation systems, biodiversity, or ecosystem services, which are typically not traded in conventional markets. CVM allows policymakers and researchers to better understand public preferences and prioritize resource allocation for sustainability and environmental conservation initiatives [38, 39].
2.6 Critical analysis of previous studies
Recent scholarship has deepened our understanding of the Subak system, exploring both its ecological-socio-cultural roles and institutional dynamics under modern pressures. Subak acts as a guardian of natural and cultural resources, maintaining ecosystem balance even amid globalization and land conversion [40]. Similarly, Subak Babakan Bayu’s resilient governance, highlighting its ability to buffer against agrarian and tourism-related challenges through sustained social and environmental stewardship [41].
While several studies affirm Subak’s socio-environmental value, there remains a notable deficiency in examining its economic valuation of irrigation water. Several studies [42, 43] lack integration with broader approaches such as WTP or irrigation financing mechanisms, which suggest early attempts at water pricing in Subak systems.
Moreover, global research underscores the importance of integrating economic instruments in irrigation governance. Several studies indicate that quantifying the economic value of irrigation water enhances decision-making and promotes sustainable water management. This points to a critical gap: how to embed economic valuation within the traditional Subak institution to support efficiency, equity, and long-term financial resilience [44, 45].
This study addresses these gaps by applying a comprehensive economic valuation framework to Subak irrigation. It quantifies irrigation water’s contribution to rice farming income, estimates farmers’ WTP for improved irrigation services, and identifies socio-economic determinants of WTP. These findings aim to strengthen the institutional capacity of Subak in adapting to future water challenges.
3.1 Research area
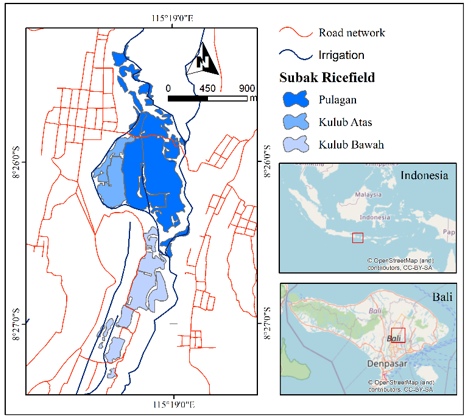
The research was conducted on Subak that designated as World Cultural Heritage, namely Subak Pulagan, Subak Kulub Atas, and Subak Kulub Bawah which are located in the upstream area of the Pakerisan Watershed in Tampaksiring District, Gianyar Regency, Bali, Indonesia. The three subaks are located between coordinates 115°18’0”E - 115°19’0”E and 8°25’0”S - 8°28’0”S. According to Agriculture Agency of Gianyar Regency, the total planting area in Subak rice fields at the research location is 200 ha. Figure 1 shows the research location.
Figure 1. The research location
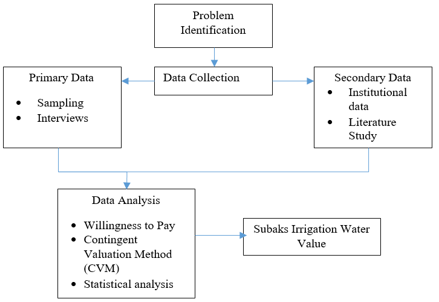
3.2 Data collection method
The data collected in this study consisted of both primary and secondary sources. Secondary data were obtained from various government institutions, including the Regional Development Planning Agency, the Public Works Agency, the Central Statistics Agency, the Regional Revenue Service, and the Agriculture Agency.
Primary data were collected directly from respondents in the three Subak locations. Considering the relative homogeneity of the population, which reflected in similar farming practices, comparable rice field areas, and uniform socio-economic conditions, respondents were selected using a random sampling method. This approach ensured that every member of the population had an equal chance of being chosen as a respondent in the study.
A total of 30 farmers were chosen. Although this is a relatively small sample, it is considered sufficient for parametric analysis due to the Central Limit Theorem (CLT), which states that the sampling distribution of the mean approaches a normal distribution as the sample size increases, typically becoming acceptable when the sample size reaches 30 or more [46]. Therefore, with a sample size of 30, the data can reasonably be treated as normally distributed, and the sample mean is expected to approximate the population mean.
Respondents were interviewed directly using a list of questions. The questions given to respondents were related to: (1) Total production output (kg), (2) Price of production output (IDR/kg), (3) Total production costs for all inputs used, except irrigation water (IDR), (4) area of cultivated land (hectares), (5) farmer income (Rupiah/planting period), (6) land productivity (tons/planting period), (7) farming experience (years), and (8) farmer's education level (years).
3.3 Data analysis
Data was analyzed quantitatively. Quantitative analysis is carried out to estimate the amount of farming income. Farming income can be seen by calculating the difference between total farming receipts and total farming expenses, which is the value of all inputs spent in the production process. Farming income analysis is useful for identifying factors that influence farmers' willingness and unwillingness to pay irrigation costs using regression analysis. Apart from that, quantitative analysis is also used in the economic assessment of irrigation services seen from the WTP value with the CVM. The CVM method calculates the value or approximate supply of a particular commodity. The commodity whose value is calculated is the value of irrigation water for ricefield needs. The WTP value was analyzed using linear regression, which was identified using factors that influence farmers' WTP for improving irrigation services and water value.
The approach used to engage farmers was the Participatory Rural Appraisal (PRA) technique, in which farmers were directly involved in understanding the CVM through a combination of economic value education of water, contingent scenario simulation, and participatory scoring techniques. The economic value education consisted of interactive discussions using pictures and storytelling to explain that natural resources such as water and land have economic value. Although water was previously considered free, there are actual costs associated with its maintenance and management. In the contingent scenario simulation, facilitators presented hypothetical scenarios based on CVM. Farmers were asked to make choices, followed by small group discussions to explain their reasoning, express their willingness and concerns regarding payment.
The participatory scoring technique involved the use of visual objects (such as corn kernels, pebbles, or stickers) to help farmers identify which factors most influenced their decisions, such as income, urgency of needs, and trust in water/ Subak management. After these three steps, a collective conclusion was drawn to determine an acceptable average value, as well as strategies to ensure broad participation without coercion. The output of this process included the estimation of WTP, along with the reasons and perceptions of farmers regarding the economic value of irrigation water. The follow-up plans included Subak deliberations for contribution collection and a social mapping of the factors influencing WTP.
Irrigation water value describes the economic value contribution of irrigation water from agricultural production. Water value is one of the values of natural resources which can indicate the level of farmers' ability to pay irrigation water costs. This assessment of irrigation water can be carried out using the Product Exhaustion Theorem approach, namely by assessing the contribution of irrigation water from the difference between the value of production output and the value of non-irrigation production input. This is stated in Eq. (1).
$P w \times Q w=Y \times P y-\sum_{f=1}^n P f \times Q f$ (1)
where,
Pw $\times$ Qw = Irrigation water contribution value
$Y=$ Total production output (kg)
$P y=$ Price of production output (IDR/kg)
$\sum_{f=1}^n P f \times Q f=$ Total production costs of all inputs used, except cost for irrigation water (IDR)
To get the WTP value, among other things, by building a hypothetical market (setting up the hypothetical market), determining the offers value of WTP (obtaining bids) based on product prices known to respondents. The price offered will continue to increases along with the maximum value that can be paid. Then followed by determining the estimated average WTP value (ΣWTP). The ΣWTP value is calculated based on the auction value which uses an auction game to obtain the auction value from farmers. The next stage is to calculate the average WTP. The estimated average WTP can be calculated using Eq. (2).
$\Sigma \mathrm{WTP}=\sum_{i=1}^n w i \times P f i$ (2)
where,
ΣWTP = Estimated WTP value
Wi = i-WTP value (Rp)
Pfi = Class Relative Frequency
n = Number of WTP respondent classes
i = ith respondent (i=1, 2, ..., n)
Factors influencing farmers' WTP for irrigation services were analyzed using Multiple Linear Regression. Regression is a variable where the dependent variable is influenced by one or more other variables, namely the independent variable, with the aim of estimating and/or predicting the average value of the dependent variable based on the known value of the independent variable. Multiple Linear Regression is a regression equation that involves two or more variables in the analysis. The aim is to calculate the estimated parameters to see whether the independent variable is able to explain the dependent variable, while the influencing variables are the independent variables. This model shows the relationship between the independent variable and the dependent variable. Multiple Linear Regression is used to look at the area of cultivated land, farmer income, land productivity, farming experience, level of education and irrigation services on the availability of irrigation services. To identify the dependent variable and independent variables, an inferential analysis model is used, namely Multiple Linear Regression analysis which is expressed in function form according to Eq. (3).
Y=b0+b1X1+b2X2+b3X3+b4X4+b5X5+e (3)
where,
Y = Farmers' willingness to pay for irrigation services
X1 = Area of cultivated land (hectares)
X2 = Farmer's income (Rupiah/planting period)
X3 = Land productivity (tons/ planting period)
X4 = Farming experience (years)
X5 = Farmer's education level (years)
b0 = Constant
b1, b2, …, b5 = Estimated parameters
t-Test (Partial Significance Test)
This test was conducted to determine the significance of each independent variable individually on the dependent variable. The hypotheses for the t-test are as follows:
$\mathrm{H}_0$: $\beta_{\mathrm{i}}=0$(the variable has no significant effect)
$\mathrm{H}_1$: $\beta_{\mathrm{i}} \neq 0$ (the variable has a significant effect)
Decision rule based on the probability (p-value):
If the probability value > 0.05, then H₀ is accepted (no significant effect).
If the probability value < 0.05, then H₀ is rejected (significant effect is present).
Statistical t-test was carried out to determine the significance of individual independent variables on the dependent variable. The hypothesis in the t test is as follows:
$\mathrm{H} 0: \beta 1=0$ (no influence) $\mathrm{H} 1: \beta 1 \neq 0$ (there is an influence).
Decision making based on probability is as follows: If Probability > 0.05, then H0 is accepted; If Probability <0.05, then H0 is rejected.
The total value of farmers' willingness to pay (TWTP) for each hectare of rice fields is calculated based on parameters, namely the number of respondents from water-using farmers and the total land area of the farmer population. The total land area of the farmer population is calculated using Eq. (4).
$\mathrm{At}=\left(\frac{\Sigma A i}{n}\right) \times N$ (4)
where,
At = Estimated total land area of the farmer population
$\Sigma A i$= Total land area of all respondents
n= Number of respondents
N= Total number of farmers in the population
Eq. (4) is to estimate the total land area of the farmer population by extrapolating the average land area per respondent to the total number of farmers in the population—not by multiplying the respondent's land area by the total population land area. This approach is based on standard sampling estimation procedures, where the average landholding from the sample is assumed to represent the population, provided that the sample is random and representative [47, 48]. Figure 2 shows the research diagram.
Figure 2. The research diagram
4.1 Contribution of irrigation water to farming income
Overall, the average amount of income from rice farming according to farmers' real land area is IDR 15,700,000/land area/year. However, this revenue is not evenly distributed, ranging from IDR 2,000,000 (125 USD) to IDR 30,000,000 (1,877 USD)/ land area/ year. The average income from farming at each level of cultivated land area is quite different. This is because the amount of production is different, while the average total revenue per hectare in the rice planting season reaches IDR 19,777,778 (1,237 USD).
Apart from revenue, farming costs will also affect the contribution of irrigation water to total farming income. As explained in the analysis of farming income, rice farming costs are expenses that must be paid to meet farming production needs. However, in the production costs in terms of water value, irrigation costs are not included.
Overall, the average production costs according to real land area incurred by each farmer is IDR 7,921,212 (495 USD)/ land area/year. These production costs are unevenly ranging between IDR 2,000,000 (125 USD) to IDR 12,000,000 (750 USD) while the average total cost per hectare reaches IDR 11,292,929 (706 USD). The average production costs for farming tend to be different at each level of cultivated land area. This condition occurs because different land areas at the farmer level provide different portions for the costs of production facilities, such as seeds, fertilizer and medicines, depending on the situation.
After obtaining the amount of income and production costs of farming according to real land area and per hectare, the water value of farming income according to real land and per hectare at each level of cultivated land area is obtained. It is shown above that the farmer's water value is IDR 7,778,788/land area/year, while the water value per hectare is IDR 8,484,849/year. This means that the average water value in rice farming will tend to increase as the average size of farmers' land increases. The amount of water value is objective if applied to determining irrigation costs because water value is positive and farmers are eligible to be charged irrigation costs during the rice planting season. The average costs and the water value are presented in Table 1.
Overall, the water value is not used entirely as irrigation costs that farmers should pay, this value also shows the contribution of irrigation water to agricultural production. Therefore, the average water value for each area of land will be compared with the WTP value of farmers for improving irrigation services, so that the determined costs do not burden farmers.
Table 1. Total water value
|
Category |
Land Area Class (Ha) |
Avg. Rice field Area (Ha) |
Average Revenue (IDR) |
Average Production Cost (IDR) |
Total Water Value (IDR) |
|
Real Land Area (IDR/ area/ yr) |
< 0.5 |
0.3 |
3,500,000 |
2,563,636 |
936,364 |
|
0.5-1 |
0.6 |
13,600,000 |
9.200,000 |
4,400,000 |
|
|
> 1 |
1.2 |
30,000,000 |
12,000,000 |
18,000,000 |
|
|
Avg. |
0.7 |
15,700,000 |
7,921,212 |
7,778,788 |
|
|
Land Area per Hectares (IDR/ ha/ yr) |
< 0.5 |
0.3 |
11,666,667 |
8,545,453 |
3,121,213 |
|
0.5-1 |
0.6 |
22,666,667 |
15,333,333 |
7,333,333 |
|
|
> 1 |
1.2 |
25,000,000 |
10,000,000 |
15,000,000 |
|
|
Avg. |
0.7 |
19,777,778 |
11,292,929 |
8,484,849 |
4.2 Farmers' willingness to pay irrigation costs
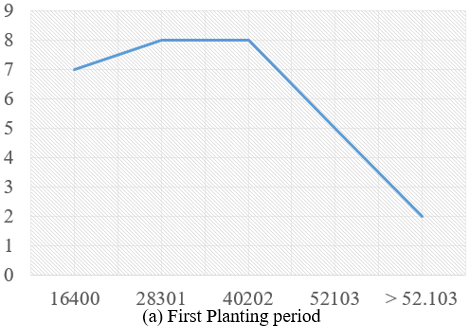
All respondents were willing to pay irrigation costs, even though the irrigation canals in Subak Kulub Atas and Subak Kulub Bawah were damaged and water was difficult to provide. Farmers in Subak Kulub Atas and Kulub Bawah object to irrigation costs which range from IDR 100,000 (6.26 USD) to IDR 135,000 (8.45 USD)/ planting period. In contrast to farmers in Subak Pulagan, the contribution paid is only IDR 22,000 (1.86 USD/ planting period. Figure 3 displays the distribution of estimated WTP (ΣWTP) towards irrigation costs.
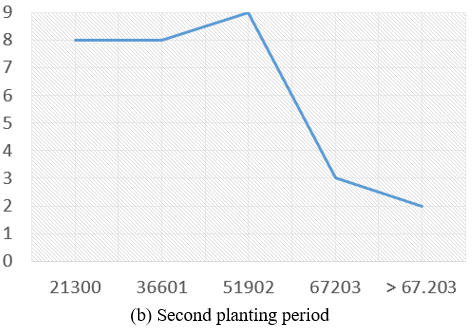
Respondents' choice of the amount of money farmers are willing to pay for irrigation costs is an average of IDR 35,250/ cultivated area or equivalent to IDR 85,976/ hectare for the first planting period and IDR 44,250/ cultivated area or equivalent to IDR 107,927/ hectare for the second planting period. This value explains that farmers are able to pay a maximum contribution of IDR 35,250/cultivated area or equivalent to IDR 85,976/hectare for the first planting period while for the second planting period it is IDR 44,250/cultivated area or equivalent to IDR 107,927/hectare, which is in the planting season. Farmers grow rice and need a lot of water. These values are above the current irrigation costs.
The WTP irrigation water value curve in the first planting period and the second planting period has a negative slope. This matter can be seen from the decreasing trend caused by the greater the bid value offered to respondents, the smaller the number of respondents who are willing to pay the bid value. However, there were 16 respondents (53.34%) in the first planting period and 9 respondents (30%) in the second planting period who were willing to pay more for irrigation costs. This is because respondents hope to get better irrigation water services so that they are able to get better harvest.
Figure 3. Willingness to pay graph for irrigation costs
Table 2. The total farmers' WTP irrigation cost
|
WTP Class (IDR/ planting area) |
Respondents (farmers) |
Sampel Land Area (ha)a |
Population Land Areab |
Totalc (IDR/ planting period) |
|
5,500-16,400 |
7 |
3.03 |
49.23 |
539,069 |
|
16,401-28,301 |
8 |
3.78 |
61.41 |
1,372,575 |
|
28,302-40,202 |
8 |
2.17 |
35.26 |
1,207,726 |
|
40,203-52,103 |
5 |
2.28 |
37.04 |
1,709,507 |
|
>52,103 |
2 |
1.05 |
8.53 |
499,449 |
|
Total |
30 |
12.31 |
191.47 |
5,328,326 |
|
6.000-21.300 |
8 |
3.03 |
49.23 |
671,990 |
|
21.301-36.601 |
8 |
1.87 |
30.38 |
879,531 |
|
36.602-51.902 |
9 |
2.61 |
42.4 |
1,876,285 |
|
51.903-67.203 |
3 |
2.2 |
35.74 |
2,128,424 |
|
> 67.203 |
2 |
2.6 |
42,.24 |
3,161,748 |
|
Total |
30 |
12.31 |
199,99 |
8,717,978 |
|
|
A Year Total |
14,046,304 |
||
Note: a: Number of respondents; b: Total land area of the WTP class
In the second planting season, the WTP values were higher, indicating that farmers recognized the critical importance of water for the success of their agricultural activities. The higher WTP reflects their WTP more for water, as it is perceived as a primary production factor. Any shortage of water during this period would have a direct impact on crop yields and subsequently on farmers’ income. Thus, the increased WTP can be interpreted as an economic expression of the high dependency of farming outcomes on water availability during the second planting season.
The result of total WTP (TWTP) were IDR 5,328,326 (333 USD) in the first planting season, and IDR 8,717,978 (545 USD) in the second planting season, while the total WTP in one year was IDR 14,046,304 (878 USD). Farmers' TWTP above the current irrigation costs is actually a financing potential that can still be explored to improve irrigation services. Table 2 shows total farmers' WTP irrigation costs.
4.3 Factors influencing farmers' willingness to pay for irrigation costs
Based on the Multiple Linear Regression analysis which is expressed in function form according to Eq. (3), the results of the analysis of the influence of the variables education, land area, land productivity, income and farming experience on the WTP for irrigation services in the three Subak are presented in Table 3.
Table 3. Results of analysis of the effect of variable X on farmers' willingness to pay for irrigation costs
|
|
Coefficient |
Sig t |
Sig F |
|||||
|
Constant |
3,562.04 |
0.187 |
0.00 |
|||||
|
Education (X1) |
8,057.69 |
3.29 |
0.00 |
|||||
|
Land area (X2) |
135,992.00 |
4.47 |
0.00 |
|||||
|
Land productivity (X3) |
3,415.70 |
4.60 |
0.00 |
|||||
|
Income (X4) |
0.019 |
1.86 |
0.00 |
|||||
|
Farming experience (X5) |
-972.77 |
-2.89 |
0.16 |
|||||
|
Model Summaryb |
||||||||
|
Model |
R |
R2 |
Adjusted R2 |
Std. Error of the Estimate |
Durbin- Watson |
|||
|
1 |
.965a |
.931 |
.880 |
.47 |
2.081 |
|||
a. Predictors: (Constant), education, land area, land productivity, farming income
b. Dependent Variable: y
Based on the analysis of the influence of the independent variables—education (X1), land area (X2), land productivity (X3), farming income (X4), and farming experience (X5)—the following regression equation was obtained:
Y = 3562.04 + 8057.69X1 + 135,992X2 + 3415.70X3 + 0.019X4 – 972.77X5
a. Constant (Intercept):
The constant value of 3,562.04 represents the baseline WTP when all independent variables are zero. Although its t-significance is 0.187 (not statistically significant at the 5% level), this is less critical than the coefficients of the explanatory variables.
b. Education (X1):
The coefficient of 8,057.69 with a significant t-value (3.29) and Sig F of 0.00 indicates that education has a positive and significant effect on WTP. This suggests that farmers with higher educational attainment tend to be more aware of the importance of irrigation and are more willing to pay for it.
c. Land Area (X2):
With the highest coefficient of 135,992.00 and a strong Sig t-value (4.47), land area is highly significant (Sig F = 0.00). This means that farmers who cultivate larger areas are more willing to invest in irrigation, likely because they rely more heavily on consistent water access to secure their larger-scale production.
d. Land Productivity (X3):
A positive coefficient of 3,415.70 and a Sig t-value of 4.60 also indicate a significant positive relationship. Higher productivity may lead farmers to place greater value on water for maintaining or enhancing yields.
e. Income (X4):
Income has a positive coefficient (0.019) and is statistically significant (Sig t = 1.86, Sig F = 0.00). Although the coefficient is relatively small, it suggests that higher income levels slightly increase the farmers’ WTP, possibly due to better financial capacity to contribute to irrigation costs.
f. Farming Experience (X5):
Interestingly, farming experience has a negative coefficient (-972.77) and is not statistically significant at the 5% level (Sig F = 0.16). This might imply that more experienced farmers are either more conservative in spending or have traditional views on irrigation provision, expecting it to be publicly provided or subsidized.
g. Overall Significance (Sig F = 0.00):
The F-significance value of 0.00 indicates that the model as a whole is statistically significant, meaning that the combination of independent variables significantly explains variations in the WTP of farmers.
4.3.1 Effect of education (X1) on farmers' WTP for irrigation costs
The regression coefficient value for the education variable (X1) is 8,057.69. This shows that there is a positive influence between education and farmers' WTP. This shows that for every 1 level increase in education, farmers' WTP irrigation costs increase by IDR 8,057.69/year (0.50 USD).
The calculated t value of the education variable is 3.29 and the t table value is 1.67022, so t calculated > t table. The significance level is F (0.000 < 0.05), so it can be concluded that Ho is rejected. This means that partially and overall the education variable has a significant effect on farmers' WTP irrigation services.
4.3.2 Effect of land area (X2) on farmers' WTP for irrigation costs
The regression coefficient value for the land area variable (X2) is 135,992. This shows that there is a positive influence between land area and farmers' WTP. This shows that for every 1 ha of land area increased, the value of farmers' WTP irrigation costs increases by IDR 135,992/year (8.43 USD).
The calculated t value of the income variable is 4.47 and the t table value is 1.67022, so t calculated > t table. The significance level F (0.000) <0.005, so it can be concluded that Ho is rejected and H1 is accepted. This means that partially and overall the land area variable has a significant effect on farmers' WTP irrigation costs.
4.3.3 Effect of land productivity (X3) on farmers' WTP for irrigation costs
The regression coefficient value for the land productivity variable (X3) is 3,415.70. This shows that there is a positive influence between land productivity and farmers' WTP. This shows that for every 1 ton/ha increase in land productivity; the value of farmers' WTP irrigation fees increases by IDR 3,415.70/year (0.21 USD).
The calculated t value of the land productivity variable is 4.60 and the t table value is 1.67022, so t calculated > t table. The significance level F (0.000) < 0.005, so it can be concluded that Ho is rejected and H1 is accepted. This means that partially and overall the land productivity variable has a significant effect on farmers' WTP irrigation costs.
4.3.4 Effect of farming income (X4) on WTP irrigation costs
The regression coefficient value for the experience variable (X4) is 0.019. This shows that there is a positive influence between farming income and farmers' WTP. This shows that for every increase in farming income of IDR 10,000 (0.62 USD), the value of farmers' WTP irrigation fees increases by IDR 190,-/year (0.012 USD).
The calculated t value of the farming income variable is 1.86 and the t table value is 1.67022, so t calculated > t table. The significance level F (0.000) < 0.005, so it can be concluded that Ho is rejected and H1 is accepted. This means that the farming income variable has a significant effect on farmers' WTP irrigation fees.
4.3.5 Effect of farming experience (X5) on WTP irrigation costs
The regression coefficient value for the farming experience variable (X5) is - 972.77. This shows that there is a negative influence between farming experience and farmers' WTP for irrigation costs. This shows that for every 1-year increase in farming experience, the farmer's WTP irrigation fees decrease by IDR 972.99/year (0.06 USD).
The calculated t value of the farming income variable is -2.89 and the t table value is 1.67022, so t calculated < t table. The significance level is F (0.16) > 0.005, so it can be concluded that Ho is accepted. This means that the farming experience variable has no real effect on farmers' WTP irrigation costs.
4.3.6 Coefficient of determination (R2)
Table 3 displays the Coefficient of Determination (R2) value to see the extent of the model's ability to explain the dependent variables. The coefficient of determination (R2) is 0.931. The regression model has a high explanatory power, with R² = 0.931 indicating that the model is robust in explaining the variation in WTP for irrigation services. The results validate the importance of education, land size, productivity, and income as key determinants. The adjusted R² and diagnostic statistics (standard error and Durbin-Watson) further support the reliability and validity of the model.
This shows that 93.1% of farmers' WTP irrigation fees can be explained by education, land area, land productivity and farming income, while the remaining 6.9% is influenced by other factors outside the model.
The coefficient of determination (R²) is 0.931, indicating that the regression model has a very high explanatory power. This means that 93.1% of the variation in farmers’ WTP for irrigation services can be explained by the four main independent variables: education, land area, land productivity, and farming income. The remaining 6.9% is attributed to other factors not included in the model, such as cultural values, institutional trust, or local environmental conditions.
The adjusted R² value of 0.880 further confirms the model’s reliability, showing that even after accounting for the number of predictors, the model remains statistically strong without being overfitted. In addition, the relatively low standard error of the estimate (0.47) indicates that the predicted values are closely aligned with the actual observations, suggesting a high level of predictive accuracy.
Furthermore, the Durbin-Watson statistic of 2.081 suggests that there is no significant autocorrelation among the residuals, meaning the model does not suffer from serial correlation and the residuals are independently distributed.
Overall, these findings demonstrate that the multiple linear regression model used in this study is robust and effective in explaining the key determinants of farmers’ WTP for irrigation services in the Subak areas analyzed.
The findings of this study indicate that education level, land area, land productivity, and farming income significantly influence farmers’ WTP for irrigation services. These results are consistent with previous studies [49, 50] which showed that farmers with higher education and greater productive capacity tend to be more economically aware of the importance of reliable irrigation services. While farmers with higher incomes are more capable and willing to invest in irrigation systems that ensure sustained agricultural output.
Practically, these findings have important implications for community-based irrigation management, particularly within the traditional Subak institution in Bali. The high WTP values, especially during the second planting season, reflect the strong recognition among farmers of water as a key production input. Farmers are willing to contribute financially, provided that the irrigation system ensures a reliable water supply. This presents an opportunity to introduce a fair and sustainable irrigation fee scheme, adjusted according to farmers' economic capacity and landholding size.
Within the Subak governance framework, the implementation of a WTP-based contribution system could be integrated through Subak deliberative meetings (paruman), which are long-established platforms for collective decision-making. Through these forums, farmers can agree on the contribution rates, payment mechanisms, and allocation of collected funds. A tiered fee structure based on land area or cropping intensity could be applied and managed transparently by the pekaseh (Subak leader). This approach aligns with Subak’s core values of social equity, transparency, and communal consensus, recognizing that Subak functions not only as an economic unit but also as a social and spiritual institution.
In this way, the discussion extends beyond the statistical significance of individual variables and offers an implementable framework for policymakers and local irrigation managers to design a participatory and sustainable irrigation financing system embedded within the cultural and institutional context of Subak.
The average water value in rice farming will tend to increase with the increase in the average size of farmers' land. The amount of water value is objective if applied to determining irrigation service fees because water value is positive and farmers deserve to be charged irrigation fees during the rice planting season. The large willingness of farmers in the three Subaks to pay irrigation costs is above the current fees, this is a financing potential that can still be explored to improve irrigation services. Factors that significantly influence farmers' WTP irrigation fees are level of education, area of rice fields, land productivity, and income from farming.
Furthermore, Subak farmers can use the WTP approach in determining irrigation costs so that the fees given do not burden farmers in paying to meet operational needs. Farmers should increase knowledge and awareness about the importance of irrigation costs so that farmers' irrigation water needs can be met during the planting season. Future research can add other factors that influence farmers' willingness or unwillingness to pay irrigation fees.
Thank you to Udayana University through the DIPA PNBP grant funding of Udayana University for Fiscal Year 2022 in accordance with the Research Implementation Assignment Agreement Letter Number: B/78.1006/UN14.4.A/PT.01.03/2022 dated April 20 2022.
[1] Yamashita, S. (2013). The balinese subak as world cultural heritage: In the context of tourism. Jurnal Kajian Bali, 3(2): 39-68.
[2] Norken, I.N. (2019). Efforts to preserve the sustainability of Subak irrigation system in Denpasar City, Bali Province, Indonesia. MATEC Web of Conferences, 276: 1-13. https://www.matec-conferences.org/articles/matecconf/pdf/2019/25/matecconf_icancee2019_04002.pdf.
[3] Sarna, K. (2021). The existence of subak in the legal politics of development program in Bali. Kertha Patrika, 43(3): 241. https://doi.org/10.24843/KP.2021.v43.i03.p02
[4] Candiasa, I.M., Santiyadnya, N., Sukajaya, N., Sunu, G.K.A. (2019). Contextualization of learning models in subak system for vocational education. Journal of Physics: Conference Series, 1165: 012023. https://doi.org/10.1088/1742-6596/1165/1/012023
[5] Sedana, G., Yastini, N.N., Maulina, N.M.I. (2021). Roles of local farmers' organization in supporting food security: Case of subak in Bali, Indonesia. IOP Conference Series: Earth and Environmental Science, 911(1): 012083. https://doi.org/10.1088/1755-1315/911/1/012083
[6] Darmawan, D.P., Arisena, G.M.K., Djelantik, A.A.A.W.S., Krisnandika, A.A.K., Utari, N.K.S., Korri, N.T.L. (2023). Farmers' independence level in the urban area of subak Sembung Denpasar City, Bali Province, Indonesia. Journal of Agricultural Sciences - Sri Lanka, 18(1): 40-54. https://doi.org/10.4038/jas.v18i1.10097
[7] Suamba, I.K., Tika, I.W., Sumiyati, Sulastri, N.N., Arisena, G.M.K., Wiguna, P.P.K., Widhianthini. (2024). Evaluation of erosion rates as indicators of ecosystem services in Bali's subak rice fields: Insights from Tabanan Regency, Indonesia. International Journal of Design and Nature and Ecodynamics, 19(3): 831-839. https://doi.org/10.18280/ijdne.190313
[8] Trigunasih, N.M., Wiguna, P.P.K. (2020). Land suitability for rice field and conservation planning in Ho watershed, Tabanan Regency, Bali Province, Indonesia. Geographia Technica, 15(1): 124-131. https://doi.org/10.21163/gt_2020.151.11
[9] Trigunasih, N.M., Wiguna, P.P.K. (2022). Identification of soil fertility status of subak rice fields based on soil chemical properties in Denpasar city, Bali, Indonesia. African Journal of Food, Agriculture, Nutrition and Development, 22(115): 21807-21824. http://doi.org/10.18697/ajfand.115.20880
[10] Darmawan, D.P., Arisena, G.M.K., Sukendar, N.M.C., Dewi, N.L.M.I.M., Krisnandika, A.A.K., Wiguna, P.P.K., Dunensa, D.L., Dewi, A.A.I.A.P., Cahyani, D.D.A. (2024). Farmer regeneration and labor requirements in rice farming: A case study of West Denpasar District, Denpasar City, Bali, Indonesia. Organic Farming, 10(3): 185-201. https://doi.org/10.56578/of100303
[11] Arisena, G.M.K., Darmawan, D.P., Sukendar, N.M.C., Dewi, N.L.M.I.M., Krisnandika, A.A.K., Dunensa, D.L. (2024). Practical marketing system as a solution to limited labor and post-harvest processing areas for rice. Theoretical and Practical Research in Economic Fields, 15(1): 35. https://doi.org/10.14505/tpref.v15.1(29).04
[12] Mahadikara, K.Y., Sudarma, I.M., Djelantik, A.A.A.W.S. (2019). Analysis of the determination of water prices in Subak Dangin yeh Giri Emas village, Sawan District, Buleleng regency. Journal of Agribusiness and Agritourism, 8(2): 125. https://doi.org/10.24843/jaa.2019.v08.i02.p01
[13] Paramarta, P.M.A.A., Widhianthini, Djelantik, A.A.A.W.S. (2020). Analysis of water prices in surface water for paddy farming in Subak Bengkel, Kediri district, Tabanan regency. Journal of Agribusiness Management, 8(1): 53. https://doi.org/10.24843/JMA.2020.v08.i01.p05
[14] Tirtalistyani, R., Murtiningrum, M., Kanwar, R.S. (2022). Indonesia rice irrigation system: Time for innovation. Sustainability, 14(19): 12477. https://doi.org/10.3390/su141912477
[15] Sukadana, I.W., Bendesa, I.K.G., Setyari, N.P.W., Yasa, I.G.W.M. (2024). Water resources conservation in Bali: A non-cooperative game theory approach. Jurnal Ekonomi Pembangunan, 21(2): 125-134. https://doi.org/10.29259/jep.v21i2.20849
[16] Young, R.A., Loomis, J.B. (2014). Determining the Economic Value of Water: Concepts and Methods (2nd ed.). Routledge. https://doi.org/10.4324/9780203784112
[17] Norken, I.W., Suputra, I.K., Arsana, I.G.N.K. (2016). Challenges to the conservation of subak system as world cultural heritage in Bali. In 2nd World Irrigation Forum (WIF2), Chiang Mai, Thailand. https://www.icid.org/wif2_full_papers/wif2_w.1.3.08.pdf.
[18] Yamamoto, E.M.S., Sayama, T., Takara, K. (2021). Impact of rapid tourism growth on water scarcity in Bali, Indonesia. Indonesian Journal of Limnology, 2(1): 1-16. https://doi.org/10.51264/inajl.v2i1.14
[19] Darma, R., O'Connor, P., Akzar, R., Tenriawaru, A.N., Amandaria, R. (2025). Enhancing sustainability in rice farming: Institutional responses to floods and droughts in pump-based irrigation systems in Wajo District, Indonesia. Sustainability, 17(8): 3501. https://doi.org/10.3390/su17083501
[20] Sitohang, L., Purnomo, N.H. (2023). Local wisdom in the context of sustainable tourism: Two‑sided phenomena of Tri Hita Karana in daily tourism activities in Bali. Jurnal Geografi Geografi dan Pengajarannya, 21(1): 1-18. https://doi.org/10.26740/jggp.v21n1.p1-18
[21] Brooks, J., Reyes-García, V., Burnside, W. (2017). Re-examining balinese subaks through the lens of cultural multilevel selection. Sustainability Science, 13(1): 35-47. https://doi.org/10.1007/s11625-017-0453-1
[22] Mudana, I.G., Suamba, I.B.P., Putra, I.M.A., Ardini, N.W. (2018). Practices of Bali tourism development, threefolding, and tri hita karana local knowledge in New Order Indonesia. Journal of Physics: Conference Series, 953: 012108. https://doi.org/10.1088/1742-6596/953/1/012108
[23] Anggana, I.P.S., Mudana, I.G., Triyuni, N.N., Sukmawati, N.M.R. (2022). Tri hita karana as a form of pro-environmental behavior in Bindu Traditional Village. International Journal of Green Tourism Research and Applications, 4(1): 30-37. https://doi.org/10.31940/ijogtra.v4i1.30-37
[24] Suasih, N.N.R., Saskara, I.A.N., Yasa, I.N.M., Budhi, M.K.S. (2017). Which one is stronger to affect innovation adoption by Balinese farmers: Government role or local wisdom? Journal of Sustainable Development, 10(3): 93. https://doi.org/10.5539/jsd.v10n3p93
[25] Wahyuni, M., Santosa, I., Irfansyah, Julianto, I.N.L. (2023). The concept of water exaltation in the subak. Journal of Law and Sustainable Development, 11(2): e345. https://doi.org/10.55908/sdgs.v11i2.345
[26] Roth, D. (2011). The subak in diaspora: Balinese farmers and the subak in South Sulawesi. Human Ecology, 39(1): 55-68. https://doi.org/10.1007/s10745-010-9374-7
[27] Roth, D., Sedana, G. (2015). Reframing tri hita karana: From 'Balinese culture' to politics. The Asia Pacific Journal of Anthropology, 16(2): 157-175. https://doi.org/10.1080/14442213.2014.994674
[28] Wulandari, W. (2019). Chalking up the benefits' project: The economic valuation of ecosystem service in Lewes, East Sussex, England. Jurnal Ekonomi dan Studi Pembangunan, 20(1). https://doi.org/10.18196/jesp.20.1.5012
[29] Su, Q., Jiang, X. (2021). Evaluate the economic and environmental efficiency of land use from the perspective of decision-makers' subjective preferences. Ecological Indicators, 129: 107984. https://doi.org/10.1016/j.ecolind.2021.107984
[30] Allenby, G.M., Brazell, J.D., Howell, J.R., Rossi, P.E. (2014). Economic valuation of product features. Quantitative Marketing and Economics, 12(4): 421-456. https://doi.org/10.1007/s11129-014-9150-x
[31] Hensher, D., Shore, N., Train, K. (2005). Households' willingness to pay for water service attributes. Environmental and Resource Economics, 32(4): 509-531. https://doi.org/10.1007/s10640-005-7686-7
[32] Joewono, T. (2009). Exploring the willingness and ability to pay for paratransit in Bandung, Indonesia. Journal of Public Transportation, 12(2): 85-103. https://doi.org/10.5038/2375-0901.12.2.5
[33] Haryanti, R.S., Murti, B., Poncorini, E. (2016) Effect of family income, education, occupation, and birth weight on child growth at Aisyiyah III kindergarten, in Kadipiro, Indonesia, Journal of Maternal and Child Health, 1(1): 1-6. https://doi.org/10.26911/thejmch.2016.01.01.01
[34] Huruta, A.D., Sasongko, G., Sari, P.I.A. (2019). The determinant of female worker’s income in Central Java. Jurnal Ilmu Ekonomi dan Pembangunan, 19(1): 25-36. https://doi.org/10.20961/jiep.v19i1.25548
[35] Burchardi, K.B., de Quidt, J., Gulesci, S., Lerva, B., Tripodi, S. (2021). Testing willingness to pay elicitation mechanisms in the field: Evidence from Uganda. Journal of Development Economics, 152: 102701. https://doi.org/10.1016/j.jdeveco.2021.102701
[36] Baymuminova, N., Shermukhammedova, G., Choi, J.G. (2023). Estimating the economic value of Ichan Kala using the contingent valuation method (CVM). Sustainability, 15(3): 2631. https://doi.org/10.3390/su15032631
[37] Onwujekwe, O., Hanson, K., Fox-Rushby, J. (2005). Do divergences between stated and actual willingness to pay signify the existence of bias in contingent valuation surveys? Social Science and Medicine, 60(3): 525-536. https://doi.org/10.1016/j.socscimed.2004.05.023
[38] Djayasinga, M. (2019). Willingness to pay (WTP) by contingent valuation method (case study: Waste management services). International Journal of GEOMATE, 17(62). https://doi.org/10.21660/2019.62
[39] Zegeye, G., Erifo, S., Addis, G., Gebre, G.G. (2023). Economic valuation of urban forest using contingent valuation method: The case of Hawassa city, Ethiopia. Trees, Forests and People, 12: 100398. https://doi.org/10.1016/j.tfp.2023.100398
[40] Ardana, P.D.H., Suparwata, D.O., Sudrajat, A., Chatun, S., Harsono, I. (2024). The role of Bali's traditional subak farming system in the preservation of natural and cultural resources. West Science Nature and Technology, 2(1): 31-38. https://doi.org/10.58812/wsnt.v2i04.754
[41] Putri, D.A.S., Susilo, R.K.D., Hayat, M., Purwasih, J.H.G. (2020). Institutional system of Subak Babakan Bayu as sustainable water resource management. EnviroScienteae, 16(2): 225. https://doi.org/10.20527/es.v16i2.9654
[42] Budiasa, I.W. (2009). Water pricing to achieve sustainable value in the use of water for irrigation in North Coastal Plain, Bali. Bumi Lestari, 9(1): 30-36. https://ojs.unud.ac.id/index.php/blje/article/view/614.
[43] Tang, H., Yang, Z., Guo, Z., Yang, C., Huang, F., Ran, R. (2022). The willingness to pay for agricultural irrigation water and the influencing factors in the Dujiangyan irrigation area: An empirical double-hurdle model analysis. Frontiers in Environmental Science, 10: 906400. https://doi.org/10.3389/fenvs.2022.906400
[44] Aman, M., Shumeta, Z., Kebede, T. (2020). Economic valuation of improved irrigation water use: The case of Meskan District, Southern Ethiopia. Cogent Environmental Science, 6(1). https://doi.org/10.1080/23311843.2020.1843311
[45] D'Odorico, P., Chiarelli, D.D., Rosa, L., Bini, A., Zilberman, D., Rulli, M.C. (2020). The global value of water in agriculture. Proceedings of the National Academy of Sciences, 117(36): 21985-21993. https://doi.org/10.1073/pnas.2005835117
[46] Islam, M.R. (2018). Sample size and its role in Central Limit Theorem (CLT). International Journal of Physics and Mathematics, 1(1). https://doi.org/10.31295/ijpm.v1n1.42
[47] Althubaiti, A. (2022). Sample size determination: A practical guide for health researchers. Journal of General and Family Medicine, 24(2): 72-78. https://doi.org/10.1002/jgf2.600
[48] Adwok, J. (2015). Probability sampling – A guideline for quantitative health care research. The Annals of African Surgery, 12(2): 95-99.
[49] Birol, E., Karousakis, K., Koundouri, P. (2008). Using economic valuation techniques to inform water resources management: A survey and critical appraisal of available techniques and an application. Science of the Total Environment, 365(1-3): 105-122. https://doi.org/10.1016/j.scitotenv.2006.02.032
[50] Puspitasari, C., Sutrisno, J., Antriyandarti, E. (2024). Analysis of willingness to pay of farmers on irrigation networks maintenance fees in the Gonggang reservoir, Magetan. Journal of Water and Land Development, 91-99. https://doi.org/10.24425/jwld.2024.149111