Dyah Maya Nihayah*![]() | Amin Pujiati
| Amin Pujiati![]() | Karsinah
| Karsinah![]() | Kusumantoro
| Kusumantoro![]() | Agus Sulistiyani | Reikha Habibah Yusfi
| Agus Sulistiyani | Reikha Habibah Yusfi![]() | Putri Patria Kusuma
| Putri Patria Kusuma![]() | Muhammad Andi Auliya Hakim
| Muhammad Andi Auliya Hakim![]()
© 2025 The authors. This article is published by IIETA and is licensed under the CC BY 4.0 license (http://creativecommons.org/licenses/by/4.0/).
OPEN ACCESS
This study aims to quantify the composite index derived from residents' subjective perceptions of satisfaction and to identify the most influential indicators shaping the quality of life and livability in Salatiga City. Employing multivariate analysis, specifically, factor analysis, the research constructs the composite index and determines key contributing factors across four dimensions: physical well-being, mental well-being, economic well-being, and social well-being. These dimensions collectively inform the overall Quality of Life Index in Salatiga. The findings reveal that the Economic Well-being dimension is the most significant contributor to urban livability, explaining 55.64% of the variance, while the Mental Well-being dimension contributes the least, at 46.37%. Overall, the perceived quality of life related to livability is classified as moderate, with a community satisfaction index of 50.82%. These results highlight the urgent need for a more responsive and integrative strategy to strengthen mental well-being, thereby fostering a more balanced and holistic enhancement of overall quality of life.
composite index, subjective, quality of life, livability urban, Salatiga
A livable city is one where residents have equitable access to urban facilities, influenced by factors such as quality, capacity, safety, comfort, and attractiveness [1]. A survey conducted by the Indonesian City Planning Expert Association (IAP) revealed that among the cities in the Kedungsepur metropolitan area, only Semarang City was recognized as a Livable City. According to the Ministry of Public Works and Housing of the Republic of Indonesia, the Kedungsepur area has been designated as a priority metropolitan region for national development. However, Salatiga City has yet to be included in the top 10 rankings of the Most Livable City Index (MLCI). The concept of a singularity city serves as a planning and design framework that enables the identification of a city’s unique form and characteristics in comparison to others. This concept assists in understanding the similarities among cities, particularly those categorized as smart cities, branded cities, or organic cities [2]. Salatiga City stands out by offering distinct qualities that are not commonly found in other cities. Known as the City of Tolerance, Salatiga has earned national recognition for its social harmony. Research by the SETARA Institute in 2020 named Salatiga the most tolerant city in Indonesia, with a score of 6.717. In 2021, the city ranked third, scoring 6.367—still reflecting a high level of tolerance [3].
Several cities in Central Java are recognized for their residents’ high levels of happiness. Based on the 2021 Indonesian Happiness Survey, the happiness of the population is measured through three dimensions: life satisfaction, emotional experience (affect), and sense of meaning or purpose in life (eudaimonia). Happiness plays a vital role in shaping individuals' daily experiences and life perceptions [4]. It is a significant factor in the success of development initiatives and societal well-being. Moreover, happiness is closely related to other socio-economic aspects, such as quality of life and job satisfaction, since both are influenced by one’s occupation and work environment [5]. Therefore, it is essential to consider urban characteristics, as cities are hubs of economic activity and consumption. A high quality of life in urban areas can attract talented human resources and stimulate economic growth and overall well-being [6].
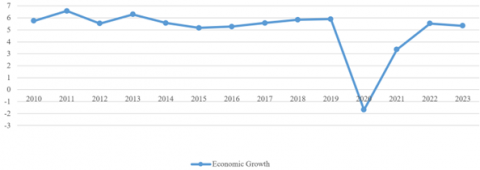
Salatiga City has experienced an upward trend in economic growth since 2020. This positive development is illustrated in Figure 1, which presents Salatiga’s economic growth from 2010 to 2022.
Based on Figure 1, the economic growth of Salatiga City has shown an upward trend since 2020. In early 2020, the pandemic began to affect Salatiga, resulting in significant economic disruptions and prompting the government to impose social restrictions. That year, the city experienced an economic contraction of -1.68%. However, the economy began to recover, recording a growth of 3.35% in 2021. By 2022, with COVID-19 cases nearly disappearing, Salatiga's economy was able to return to more stable conditions, reaching a growth rate of 5.53%. This rate even surpassed the 2016 figure, which was 5.27%.
According to the Central Statistics Agency, the Human Development Index (HDI) reflects achievements in human development based on various dimensions of human life quality. A higher HDI score signifies a city's improved well-being and health. The HDI evaluates three primary components: access to knowledge, longevity, and health, and a decent standard of living. The ranking of city happiness in Central Java is presented in Table 1.
Figure 1. Salatiga City economic growth 2010-2022
Table 1. Rankings happiness index in 4 cities in Central Java, Indonesia
|
No. |
City |
Happiness Index |
|
1 |
Salatiga |
84.35 |
|
2 |
Semarang |
84.08 |
|
3 |
Surakarta |
83.08 |
|
4 |
Magelang |
80.39 |
Source: BPS Central Java, 2022
Based on data reported by JemberNetwork.com and sourced from the Statistic Bureau Agency, Salatiga City ranked first in Central Java Province in terms of the Happiness Index, supported by an HDI score of 84.35 (Table 1). Despite these notable achievements, Salatiga has yet to be included among the top 10 most livable cities in Indonesia. Therefore, strategic innovations are required to enhance livability by improving the overall quality of life. Perceived quality of life is a key element that shapes people’s satisfaction with their environment. Assessing livability requires not only objective indicators but also subjective perceptions, feelings, and personal values [7].
This study aims to assess the level of quality of life by identifying the most influential subjective indicators and evaluating the relative contribution of each dimension to the composite index based on the perceptions of Salatiga's residents. Sirgy and Cornwell [8] tested three models to explain how satisfaction with environmental attributes affects individuals' perceived quality of life. Their findings support the hypothesis that perceptions of quality of life are influenced by people’s level of satisfaction across various dimensions—physical, social, economic, and environmental. The public’s perception of a livable city can be constructed in the form of a composite index by compiling and integrating various indicators that shape urban livability, grounded in the community's subjective evaluation. This perspective aligns with the notion that every community has the right to pursue development in its own living environment in a way that supports long-term well-being and sustainability.
A livable city and a high quality of life (QoL) are intrinsically linked. A livable city is an urban area that integrates multiple dimensions to provide a favorable, comfortable, and sustainable environment for its residents. A city considered comfortable to live in refers to a place where the built environment positively influences the well-being and quality of life of its inhabitants. The urban environment should be designed to enhance quality of life by meeting the basic needs of residents [9, 10] through the provision of accessible facilities for all groups—regardless of age, socioeconomic status, physical ability, or gender identity [11]. At its core, the principle is that urban planning, economic value, and social sustainability are inherently interconnected. Cities should promote a landscape that encourages healthy and sustainable living [12-14], while also considering ease of access, connectivity to central areas, the availability of open green spaces, economic vibrancy, and the general standard of living [15]. In this context, the increasing movement of people within urban areas necessitates a spatially interconnected urban configuration, both internally within cities as they grow, and externally between cities [16]. This is part of a continuous process aimed at fulfilling the living needs of urban populations, ultimately seeking to achieve the highest attainable quality of life. Wey [17] explained that quality of life is reflected in levels of happiness, life satisfaction, and fulfillment of personal aspirations. This includes both material well-being and the extent to which individuals derive benefit and enjoyment from their lives. A person's quality of life can be considered favorable when their state of well-being is adequately fulfilled. However, individual-level quality of life is closely linked to material-based economic development and macro-level growth, often measured through monetary indicators. It is important to note that high economic growth alone does not automatically translate to a favorable quality of life. Studies in developed countries initially revealed that conventional development strategies did not always achieve their intended outcomes. This led to the emergence of more targeted and innovative approaches centered around three key growth models: smart growth, sustainable growth, and inclusive growth. These strategies advocate for redefining urban development with a greater emphasis on the concept of growth—one that also integrates sustainability principles [14, 17] and also considers sustainability aspects [18]. In this regard, the sustainability component of a “sustainable city” framework emphasizes prioritizing the natural environment in urban policies, aligning this focus with the economic advantages of urban agglomeration [19]. The triad of economic, social, and environmental indicators is further emphasized by Junior et al. [20] who argue that a sustainable city is one where economic and social elements provide measurable socio-economic benefits for residents, while environmental thresholds are respected to ensure ecological well-being for all. Through such sustainability-driven cities, the quality of life of their inhabitants is expected to be progressively enhanced.
The formulation of indicators plays a central role in the planning and development of livable cities—spanning dimensions such as public safety, healthcare, transportation and public infrastructure, the natural environment, and arts and culture. These indicators serve as clear and measurable benchmarks to guide urban development, especially given the complex interplay between sustainability and quality of life improvements [21]. In another study, Benita et al. [22] identified eight key dimensions that define urban livability: public transportation, infrastructure, community amenities, open and public spaces, healthcare services, environmental and cultural features, education, and employment. Almatar [23] emphasizes that infrastructure development, such as road systems, must be designed to be inclusive and accessible to all, including persons with disabilities, children, and the elderly.
Livable city assessments also consider a variety of indicators, such as economic vitality, environmental integrity, political stability, healthcare, education, infrastructure, safety, social cohesion, and cultural vibrancy. The United Nations Human Settlements Programme (UN-Habitat), through its City Prosperity Index, evaluates urban well-being using six dimensions: economic productivity, quality of life, social equity, environmental sustainability, urban governance, and connectivity. More recently, UN-Habitat has introduced analytical tools utilizing spatial indicators. These include road connectivity, public space availability, and economic agglomeration—each offering clearer spatial mappings that enhance value assessments and better inform decision-making. A comprehensive assessment of urban livability and quality of life must combine both objective and subjective measurements [24]. Objective indicators alone are often considered insufficient to capture the complexities of livability [25]. Satisfaction—an essential component of livability—reflects the perceived gap between individual aspirations and the actual conditions experienced. On the other hand, subjective measures, while vital, may not fully reflect the physical environment in which people live. Livability and quality of life are influenced by perceptions, emotions, and personal values [7, 26]. This perspective is supported by findings from Okulicz-Kozaryn [12] and Lee and Sener [27] who argue that subjective indicators are indispensable for capturing the lived experiences of urban residents—rather than solely relying on expert-derived indices. Thus, public perspectives play a critical role in identifying key barriers and opportunities for enhancing livability within cities [10].
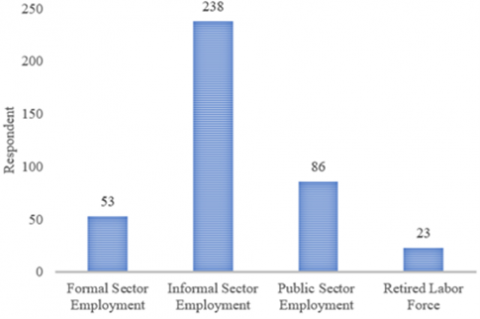
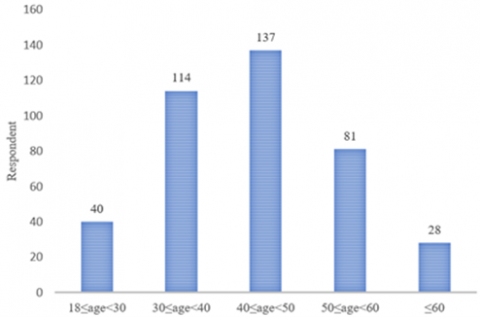
This research adopts a quantitative approach by statistically measuring residents' satisfaction with various aspects of quality-of-life indicators in Salatiga City. The data used in this study are primary in nature, collected through the distribution of questionnaires to the residents of Salatiga. The sample was selected using purposive sampling, with a total of 400 respondents from Salatiga. Purposive sampling was employed based on the specific objectives of this study and the nature of the variables measured, particularly the subjective indicators of urban livability. This sampling technique was used to deliberately select informants who met predefined criteria. Diverse representation across age groups and socioeconomic strata, as reflected in their occupations, was considered essential for obtaining meaningful insights (Figure 2).
(a) Type of employment
(b) Age
Figure 2. Respondent characteristic
A total of 59.5% of respondents were employed in the informal sector, followed by 13.25% in the formal sector, 21.5% unemployed, and 5.75% retired (Figure 2a). These figures indicate that the local economy remains heavily dependent on informal economic activities. This condition is crucial for understanding the economic dynamics of Salatiga City. Since livable city research requires respondents aged over 16 years, the study focuses on individuals within the productive age group—those who are economically and socially active, and thus regularly interact with urban infrastructure, public services, transportation, and digital technology. In terms of age distribution, the largest proportion of respondents belonged to the 40–49 age group (34.25%), followed by those aged 30–39 (28.5%) and 50–59 (20.25%). The remaining respondents comprised individuals aged 16–29 (10%) and elderly individuals aged 60 and above (7%) (Figure 2b). This distribution suggests that perceptions of urban livability are primarily shaped by economically active populations, whose preferences, needs, and daily challenges form a critical basis for the development of well-being and sustainability-oriented urban policies. To minimize bias, mitigation was undertaken by distributing the questionnaires proportionally based on the population distribution across the four subdistricts of Salatiga City (Table 2).
Table 2. Respondent distribution by subdistrict in Salatiga City
|
Subdistrict |
Population |
Respondents |
|
Argomulyo |
52045 |
103 |
|
Tingkir |
48106 |
96 |
|
Sidomukti |
46125 |
92 |
|
Sidorejo |
55093 |
109 |
Table 2 shows that all four sub-districts are proportionally represented based on population size. Therefore, the results of the analysis fairly and representatively reflect the community’s perceptions.
This study comprises four dimensions of livability: physical well-being, mental well-being, economic well-being, and social well-being, encompassing a total of 50 subjective indicators. These indicators are obtained from the conceptual framework. The distribution of indicators within each dimension is presented in Table 3.
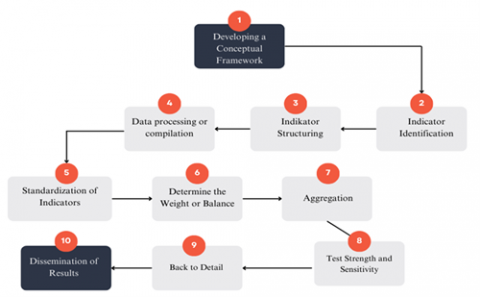
Table 3 presents the measurement of the Livability Index in Salatiga City, which is structured into four primary dimensions: physical well-being, mental well-being, economic well-being, and social well-being. Each dimension comprises a set of indicators that reflect the public's perceptions regarding the livability of the city. The analysis utilizes a composite index approach to evaluate community satisfaction with the quality of life among Salatiga residents. The steps involved in constructing the Livability Index are illustrated in Figure 3.
Table 3. Dimensions and indicators measurement
|
Dimensions |
Indicator |
|
A. Physical Well-being |
P1. Transportation options available for accessing children’s education |
|
P2. Frequency of public transportation use for commuting to work or school |
|
|
P3. Frequency of public transportation use for shopping purposes |
|
|
P4. Frequency of public transportation use for leisure activities |
|
|
P5. Quality of public transportation services |
|
|
P6. Availability of public facilities, including parks and open spaces |
|
|
P7. Distance from home to workplace or school |
|
|
P8. Prevalence of health complaints |
|
|
P9. Quality of pedestrian and cyclist road infrastructure |
|
|
P10. Distance from home to healthcare facilities |
|
|
P11. Coverage of health insurance |
|
|
P12. Quality of public sanitation |
|
|
P13. Availability of public facilities such as places of worship, shopping centers, and entertainment venues |
|
|
P14. Ease of access to the internet and information technology |
|
|
P15. Availability of public internet access points |
|
|
P16. Availability and reliability of energy and electricity supply |
|
|
P17. Overall satisfaction with infrastructure. |
|
|
B. Mental Well-being |
M1. Ability to maintain good physical and mental health |
|
M2. Distance from home to the nearest sports or fitness facility |
|
|
M3. Participation in leisure and recreational activities |
|
|
M4. Proximity to the nearest tourist or recreational destination |
|
|
M5. Coping response when a family member experiences a personal crisis |
|
|
M6. Availability of social support from the community and/or family |
|
|
M7. Perception of excessive workload or economic pressure in the past month |
|
|
M8. Accessibility of mental health services |
|
|
M9. Level of satisfaction with one’s overall mental well-being |
|
|
C. Economic Well-being |
E1. Employment Type |
|
E2. Average Monthly Income (total income per household head) |
|
|
E3. Household Expenditure for the Previous Month on Food and Beverages (including prepared meals) |
|
|
E4. Household Expenditure for the Previous Month on Non-Food and Non-Beverage Items |
|
|
E5. Purchasing Power |
|
|
E6. Distance from Residence to Workplace |
|
|
E7. Access to Business Infrastructure (markets, shops, financial institutions, ATMs) |
|
|
E8. Business and Investment Opportunities |
|
|
E9. Economic Conditions Since Relocation |
|
|
E10. Access to Financial Institutions, Banks, and Cooperatives |
|
|
E11. Level of Satisfaction with Economic Well-being |
|
|
D. Social Well-being |
S1. Length of stay |
|
S2. Water condition |
|
|
S3. Air quality |
|
|
S4. The frequency of natural disasters |
|
|
S5. Never been a victim of crime in the last 1 year |
|
|
S6. Crime rates in villages/subdistricts over the past year |
|
|
S7. The rate of mass fights in the neighborhood over the past year |
|
|
S8. Participation in social community activities |
|
|
S9. Comfort when performing religious duties in the neighborhood |
|
|
S10. Comfort when neighbors of different faiths carry out their religious activities |
|
|
S11. Participation in joint activities for the public interest |
|
|
S12. Participation in community activities to help residents who are experiencing hardship |
|
|
S13. Level of satisfaction with social welfare |
Figure 3. Flowchart for constructing a composite index
The procedure for constructing a composite livability index follows the calculation method proposed by the OECD [28], which has also been adopted in prior research [29]. As shown in Figure 3, once the indicators are selected, the next step involves structuring the indicators to determine the number of factors, naming each factor, and assigning weights to them. The determination of factors in this study adheres to the Kaiser-Meyer-Olkin (KMO) criterion. According to this rule, factors with eigenvalues greater than one are included as dominant factors [30]. Weighted aggregation is conducted when more than one dominant factor is identified. Within each factor, the dominant indicator is determined by the highest loading factor. If an indicator exhibits relatively similar loading values across factors, factor rotation is applied. This step precedes the final selection of dominant indicators. The rotation method employed is the Varimax technique.
Factor weights are derived by comparing the proportion of variance explained by each factor to the total variance explained by all dominant factors [29] (Eq. (1)).
$W_i=\frac{E V}{T E V}$ (1)
where, $E V$ represents the percentage of variance explained by a factor, and $T E V$ is the total explained variance such that $\sum W_i=1$.
The formula used to calculate the index for the quality-of-life dimension—representing the perceived livability of the city, was adapted from a previous publication di Kota Depok, as follows [31]:
Physical Well-being Index $=I_P=\frac{\sum w_1 x_1}{\sum w_1}$ (2)
Mental Well-being Index $=I_M=\frac{\sum \mathrm{w}_2 \mathrm{x}_2}{\sum \mathrm{w}_2}$ (3)
Economic Well-being Index $=\mathrm{I}_{\mathrm{E}}=\frac{\sum \mathrm{w}_3 \mathrm{x}_3}{\sum \mathrm{w}_3}$ (4)
Social Well-being Index $=I_S=\frac{\sum w_4 x_4}{\sum w_4}$ (5)
Then,
$\text { Livability City Index }=I_{L C}=\frac{w_1 I_P+w_2 I_M+w_3 I_E+w_4 I_S}{w_1+w_2+w_3+w_4}$ (6)
Remark: $x_n$ is the score of the $i^{\text {th }}$ indicator, while $w_n$ is the weighted/weight of the ith indicator. Determining the amount of weighing $(w)$ is based on the results data distribution.
The construction of the composite index follows the stages illustrated in Figure 3. After identifying the indicators (Table 2), the subsequent steps include structuring the indicators, standardization, weighting, and aggregation. The structuring of indicators is carried out using two statistical approaches: the KMO Measure of Sampling Adequacy and Bartlett’s Test of Sphericity. The determination of the total number of factors was carried out using the eigenvalue approach, with the criterion that only eigenvalues greater than 1 were considered valid for factor extraction. If the eigenvalue is less than 1, it does not meet the threshold and therefore is excluded from the factor count. The number of extracted factors reflects the proportion of variance explained by the set of indicators within each dimension. Prior to performing factor analysis, the Kaiser–Meyer–Olkin (KMO) Measure of Sampling Adequacy and Bartlett’s Test of Sphericity were conducted to assess the appropriateness of the subjective indicators for each dimension (Table 4).
Table 4. KMO and Bartlett’s test of sphericity
|
Dimensions |
Kaiser-Meyer-Olkin Measure of Sampling Adequacy |
Bartlett's Test of Sphericity |
||
|
Chi-Square |
Df |
Sig. |
||
|
Physical Well-being |
0.784 |
1.351.724 |
105 |
0.000 |
|
Mental Well-being |
0.647 |
237.489 |
28 |
0.000 |
|
Economic Well-being |
0.742 |
722.692 |
55 |
0.000 |
|
Social Well-being |
0.765 |
876.680 |
78 |
0.000 |
Table 4 demonstrates that the sample adequacy for factor analysis is satisfactory. This is evident from the KMO values for the dimensions of Physical Well-being, Economic Well-being, and Social Well-being, which are 0.784, 0.742, and 0.765, respectively, indicating that all three dimensions have very good sampling adequacy. Although the KMO value for the Mental Well-being dimension is the lowest at 0.647, it still falls within the acceptable range as it exceeds the minimum threshold of 0.50. Meanwhile, the results of Bartlett’s Test of Sphericity for all four dimensions show high Chi-Square values that are statistically significant (p < 0.001). These findings confirm the presence of sufficient correlations among items within each construct of urban livability being tested and indicate that the correlation matrices are not identity matrices. Therefore, all four well-being dimensions are statistically valid and appropriate for further analysis.
The result shows that five latent factors were extracted from the Physical Well-being dimension, reducing the original 15 indicators into five core components based on significant variance. The first factor accounts for 22.891%, the second for 15.724%, the third for 8.139%, the fourth for 7.160%, and the fifth for 6.730%, cumulatively explaining 60.644% of the total variance. This indicates that the five extracted factors are able to explain 60.644% of the variability within the 15 indicators measuring physical well-being. From the Mental Well-being dimension, eight original indicators were reduced into three principal factors. The first factor contributes 25.249% to the total variance, the second 14.864%, and the third 12.738%, resulting in a cumulative explanatory power of 52.851%. These three factors, therefore, account for 52.851% of the variability within the eight indicators related to mental well-being. Within the Economic Well-being dimension, 11 indicators were distilled into three main factors. The first factor explains 25.459% of the variance, the second 16.269%, and the third 10.342%, with a combined explanatory value of 52.069%. This shows that the three factors together explain 52.069% of the total variance of the economic well-being indicators. As for the Social Well-being dimension, 13 original indicators were reduced into four primary factors. According to the Total Variance Explained table, the first factor accounts for 24.197%, the second for 13.325%, the third for 9.398%, and the fourth for 7.831%, culminating in a total variance explanation of 54.751%. These four factors thus capture 54.751% of the variability within the 13 indicators reflecting social prosperity.
4.1 Aggregation and weighting
A greater weighting factor is derived by comparing the proportion of variance explained by a particular factor with the total variance explained by the dominant factors. Each indicator within a factor does not contribute equally; instead, every indicator plays a distinct role in forming the composite index. Therefore, an unequal weighting scheme is applied, reflecting how each factor influences the index [32].
The magnitude of each factor within a given dimension is expressed in terms of the percentage of explained variance, with proportional weighting. A normalized score (N-score) is then calculated for each factor. These factor scores are combined to generate a standardized z-score, which is subsequently rescaled to a score ranging from a minimum of 0 to a maximum of 100 using min–max normalization multiplied by 100. The resulting variance percentages and respective weights are presented in Table 5.
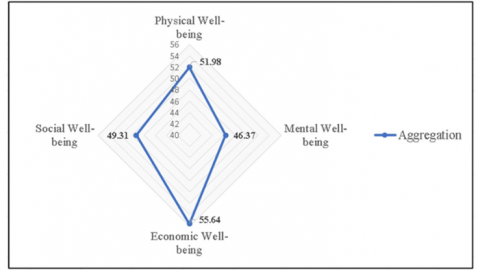
Table 5 shows that the Economic Well-being dimension contributes the most to the Livable City Index, with the highest aggregation score of 55.64. This score is derived from indicators such as average income and expenditure, satisfaction with household economic conditions, and access to economic facilities. It is followed by Physical Well-being (51.98) and Social Well-being (49.31). Despite including the strongest factor component related to satisfaction with mental health, Mental Well-being records the lowest score (46.37). This suggests that although mental well-being is important, it has not yet emerged as a primary consideration in residents’ perceptions of Salatiga’s livability. Overall, the Livable City Index score for Salatiga is 50.82. Referring to the classification proposed by Azwar [33], this places Salatiga’s livability level in the moderate category.
The radar chart visualization (Figure 4) reveals that the primary strengths of Salatiga City lie in the dimensions of Economic Well-being and Physical Well-being. In contrast, the dimensions of Social Well-being and Mental Well-being remain below the ideal threshold, indicating weak social cohesion and heightened psychological stress within the community. This disparity suggests that, despite being economically and physically well-off, the balance and sustainability of a livable city require further improvement, particularly through strengthening mental and social well-being networks. The challenge of improving the environmental and social aspects of urban livability is also faced by the city of Faisalabad, located in Punjab Province, Pakistan. This city shares several characteristics with Salatiga, including the nature of its community, dependence on the local economy, and the state of its infrastructure development. Although Faisalabad scores higher on the livability index than Salatiga, it still faces the pressing need to enhance mental and social well-being, despite having a relatively stable economy [34].
Table 5. Weight dimensional factor weighing
|
Dimensions |
Factor |
Eigenvalues |
Percentage Variance Explained |
Weighted |
Aggregation |
Liveability City Index $\left(\mathbf{I}_{\mathbf{L C}}\right)$ |
|
Physical Well-being |
Mode of transportation choice |
3,434 |
15,890 |
0.262 |
51.98 |
50.82 |
|
Availability of public infrastructure |
2,359 |
14,818 |
0.244 |
|||
|
Availability of other basic infrastructure |
1,221 |
14,222 |
0.234 |
|||
|
Access to educational and healthcare facilities |
1,074 |
8,583 |
0.142 |
|||
|
Public health condition |
1,010 |
7,132 |
0.118 |
|||
|
Mental Well-being |
Satisfaction with mental health |
2,020 |
21,350 |
0.404 |
46.37 |
|
|
Accessibility to sports and recreational facilities |
1,189 |
16,979 |
0.321 |
|||
|
Awareness of personal health and availability of social support |
1,019 |
14,522 |
0.275 |
|||
|
Economic Well-being |
Average household income and expenditure |
2,800 |
20,331 |
0.390 |
55.64 |
|
|
Satisfaction with the family's economic condition |
1,790 |
19,972 |
0.384 |
|||
|
Accessibility to economic facilities |
1,138 |
11,766 |
0.226 |
|||
|
Social Well-being |
Participation in public activities |
3,146 |
17,044 |
0.311 |
49.31 |
|
|
Urban security level |
1,732 |
13,951 |
0.255 |
|||
|
Religious tolerance |
1,222 |
13,601 |
0.248 |
|||
|
Length of residence |
1,018 |
10,155 |
0.185 |
The spatial planning and development of Salatiga City are integrated with national and provincial development agendas. Strategically located between major cities such as Jakarta, Semarang, and Surabaya to the north, and Magelang, Yogyakarta, and Surakarta to the south, Salatiga is often referred to as a 'Transit City'. This geographical advantage is expected to generate positive spillover effects across various dimensions of well-being, ultimately influencing the urban's overall livability.
Figure 4. Spider chart showing the performance of livability urban index
4.2 Dimension 1. Physical well-being
According to the indicators established by the Indonesian Association of Planners (IAP), the dimension of physical well-being in a livable city can be assessed through basic facilities (electricity, sanitation, and clean water), education and healthcare services, public transportation systems, and public infrastructure. In general, residents of Salatiga perceive the availability of electricity, sanitation, and clean water to be satisfactory, as these facilities are fairly evenly distributed throughout the city. Similar levels of satisfaction are observed with regard to access to healthcare and education services. More than 90% of respondents reported having active health insurance coverage (such as BPJS, private insurance, or company-provided plans), which enables them to easily access healthcare services. Public infrastructure, such as recreational open spaces and areas with ecological functions, is available and accessible from residential neighborhoods. Likewise, places of worship and shopping centers are widely distributed and easily reachable. Positive assessments of Salatiga’s physical indicators are also reflected in access to and the quality of energy infrastructure, information technology, and internet connectivity, which have shown notable development in urban areas. However, another finding reveals that public satisfaction with transportation remains limited, as many residents prefer using private vehicles or motorcycles over public transit. The underutilization of public transportation is primarily attributed to issues of inefficiency and lack of comfort. The misalignment between spatial planning and transportation systems, combined with the rise of online ride-hailing services, has further contributed to the declining use of conventional public transport in Salatiga. These conditions are consistent with the findings of Ashari and Budiono [35].
4.3 Dimensions 2. Mental well-being
The mental well-being dimension recorded the lowest contribution to the Livability Index of Salatiga City, at 46.37%. This finding is supported by data from the Salatiga City Health Office since 2022, indicating a rise in mental health issues, with 410 reported cases of mental disorders, including schizophrenia and psychotic conditions. The study reveals that the primary contributing factor is economic stress, particularly financial pressure, following the post-COVID-19 pandemic period in 2022. Survey results also show that the situation is exacerbated by the limited average leisure time among residents, which ranges from only 2 to 5 hours per week, thereby reducing opportunities for relaxation and mental recovery.
According to Jayawardana et al. [36], it was found that poverty (low income) contributes to an increased risk of mental health. A relatively low perception of mental well-being has contributed to the decline in the livability score of Salatiga City. Therefore, enhancing access to mental health services and providing adequate public space facilities are crucial steps to improve mental well-being and, consequently, raise the city's livability index.
4.4 Dimensions 3. Economy well-being
The most significant and dominant factor in determining the livability of Salatiga City is the dimension of economic well-being, accounting for 55.64%. Employment, income, expenditure, purchasing power, and access to financial institutions are key indicators within this dimension. Most respondent, particularly those employed in the private sector, reported moderate to high levels of economic satisfaction, especially with economic indicators that significantly influence their perceived quality of life. These assessments reflect the critical role of economic capacity in meeting basic needs [37]. This finding suggests that stable income, prudent consumption behavior, and sufficient savings positively contribute to life satisfaction and individuals’ subjective well-being [38, 39]. Furthermore, awareness of economic independence, often influenced by educational attainment—also plays a role in enhancing personal happiness [40]. Another notable finding reveals that although a small segment of the population continues to face challenges and limited access, the majority experience ease in accessing financial facilities (such as banks and cooperatives) in Salatiga. This accessibility is facilitated by the widespread availability of financial services, including banks, ATMs, and cooperatives throughout the city. As a result, residents generally possess adequate economic capacity to meet their daily needs, which in turn enhances their sense of security, satisfaction, and financial stability—factors that significantly influence subsequent economic decision-making. These findings are consistent with Social Comparison Theory, which posits that relatively high asset ownership fosters psychological satisfaction [38]. The relatively stable economic conditions thus have a positive impact on residents’ happiness. Therefore, the economic dimension plays a pivotal role in shaping urban livability in Salatiga, indicating that the city provides a conducive environment for a comfortable and economically prosperous life.
4.5 Dimensions 4. Social well-being
Salatiga is a multicultural city predominantly inhabited by Javanese and Chinese ethnic groups. Despite being minorities, Batak, Minangkabau, Dayak, Ambonese, Buginese, and Papuan communities coexist peacefully. Various religious groups—such as Muslims, Christians, Catholics, Hindus, Buddhists, and followers of indigenous beliefs—demonstrate mutual tolerance in daily life, fostering a safe and harmonious atmosphere. The findings indicate that, on average, respondents have lived in Salatiga for more than 15 years. This suggests that beyond economic considerations, cultural values, psychological comfort, and social networks play significant roles in residential decision-making [41]. Another finding from the social well-being indicators reveals that most residents perceive Salatiga as a city with low levels of crime and social conflict. However, certain suburban areas exhibit slightly different perceptions due to sporadic incidents of theft. Additionally, the indicator related to environmental quality shows a decline in both air and water quality. This is supported byPanjaitan et al. [42] that monitored air conditions in industrial zones and found several parameters exceeding the permissible thresholds. Reports released by the Environmental Agency since 2021 also indicate that industrial activities along the Banyuputih and Jetis rivers are the main contributors to water pollution in Salatiga. Air quality monitoring in these industrial areas similarly reveals that several indicators surpass the recommended limits. In a livable city, air quality issues should not be overlooked or treated merely as a local concern. It is essential to understand the spatial interaction framework between regions, as these dynamics directly influence overall environmental quality [43, 44]. Hence, such issues must be addressed collaboratively with neighboring areas. The development of Salatiga should not only prioritize economic growth and the enhancement of local living standards but also consider potential externalities—particularly those related to air and water quality—arising from various activities. This approach ensures that residents can experience genuine social welfare while living in Salatiga.
Based on the results and discussion, it can be concluded that the Livability Index of Salatiga City, as perceived by its residents, stands at 50.82 percent. This score indicates a moderate level of satisfaction, suggesting that the city offers a fair degree of comfort and livability. Among the dimensions assessed, Economic Well-being emerged as the most substantial contributor, while Mental Well-being was the least. These findings point to several strategic recommendations for local government intervention. First, expanding economic opportunities should be prioritized, as Economic Well-being plays a pivotal role in shaping overall urban livability. This may involve attracting investments, empowering local enterprises, and fostering job creation to improve income levels and enhance residents' financial resilience. Second, greater attention must be directed toward Mental Well-being, given its relatively low contribution. This includes improving access to mental health services, raising awareness of mental health issues, and supporting initiatives that promote emotional and psychological wellness within the community. Third, strengthening social development programs remains essential, as Social Well-being constitutes a vital component of livability. Efforts to enhance community engagement, reduce social disparities, and improve public safety and social services can foster a more inclusive and supportive urban environment.
Additionally, upgrading physical infrastructure, such as roads, public transportation, and affordable housing, is critical to ensuring that the city's physical environment supports a higher quality of life. An integrated, multidimensional urban planning approach, one that simultaneously addresses the economic, social, physical, and mental dimensions of livability, is necessary to facilitate balanced progress toward sustainable urban development. Importantly, engaging the public in identifying priority areas for improvement can help ensure that government policies are responsive to the expectations and lived experiences of the community. Despite these insights, the study has limitations. Future research is encouraged to adopt a mixed-methods approach by integrating subjective assessments with objective indicators. Incorporating spatial econometric techniques and longitudinal analyses would further enable the identification of potential spillover effects across adjacent areas and offer insights into the long-term effectiveness of specific policy interventions on each dimension of urban well-being.
The authors would like to express our sincere gratitude to the Directorate General of Higher Education, Research, and Technology (Ditjen Diktiristek) through the Directorate of Research, Technology, and Community Service (DRTPM) for the research grant provided.
[1] Sheikh, W.T., van Ameijde, J. (2022). Promoting livability through urban planning: A comprehensive framework based on the “theory of human needs.” Cities, 131: 103972. https://doi.org/10.1016/j.cities.2022.103972
[2] Abusaada, H., Elshater, A. (2021). Competitiveness, distinctiveness and singularity in urban design: A systematic review and framework for smart cities. Sustainable Cities and Society, 68: 102782. https://doi.org/10.1016/j.scs.2021.102782
[3] Haga, C.S.L., Prianto, Y., Putra, M.R.A. (2022). Tolerance in community life in Salatiga City, Central Java. Binamulia Law, 11(2): 139-149. https://doi.org/10.37893/jbh.v11i2.701
[4] Singh, S., Aggarwal, Y. (2018). Happiness at work scale: Construction and psychometric validation of a measure using mixed method approach. Journal of Happiness Studies, 19(5): 1439-1463. https://doi.org/10.1007/s10902-017-9882-x
[5] Jonas, D.E., Cusack, K., Forneris, C.A., Wilkins, T.M., Sonis, J., Middleton, J.C., Feltner, C., Meredith, D., Cavanaugh, J., Brownley, K.A., Olmsted, K.R., Greenblatt, A., Weil, A., Gaynes, B.N. (2013). Psychological and pharmacological treatments for adults with posttraumatic stress disorder (PTSD) (Comparative Effectiveness Review No. 92; AHRQ Publication No. 13-EHC011-EF). Agency for Healthcare Research and Quality. https://effectivehealthcare.ahrq.gov/products/ptsd-adult-treatment-update/research-protocol.
[6] Goerlich, F.J., Reig, E. (2021). Quality of life ranking of Spanish cities: A non-compensatory approach. Cities, 109: 102979. https://doi.org/10.1016/j.cities.2020.102979
[7] Almashhour, R., Samara, F. (2022). Evaluating livability perceptions: Indicators to evaluate livability of a university campus. Sustainability, 14(19): 11872. https://doi.org/10.3390/su141911872
[8] Sirgy, M.J., Cornwell, T. (2002). How neighborhood features affect quality of life. Social Indicators Research, 59(1): 79-114. https://doi.org/10.1023/A:1016021108513
[9] Alamoush, S.J., Kertész, A. (2022). Accessibility as a factor for a livable cities: The case of Salt City in Jordan. Pollack Periodica, 17(3): 147-151. https://doi.org/10.1556/606.2022.00601
[10] Sultana, R., Asad, A. (2020). Evaluation of urbanites’ perception about livable city using analytic hierarchy process (Ahp): A case study of Dhaka City. In AUC 2019: Proceedings of the 15th International Asian Urbanization Conference, Ho Chi Minh City, Vietnam, pp. 367-381. https://doi.org/10.1007/978-981-15-5608-1_29
[11] Hidayati, I., Yamu, C., Tan, W. (2021). Realised pedestrian accessibility of an informal settlement in Jakarta, Indonesia. Journal of Urbanism: International Research on Placemaking and Urban Sustainability, 14(4): 434-456. https://doi.org/10.1080/17549175.2020.1814391
[12] Okulicz-Kozaryn, A. (2013). City life: Rankings (livability) versus perceptions (satisfaction). Social Indicators Research, 110(2): 433-451. https://doi.org/10.1007/s11205-011-9939-x
[13] Khorrami, Z., Ye, T., Sadatmoosavi, A., Mirzaee, M., et al. (2021). The indicators and methods used for measuring urban liveability: A scoping review. Reviews on Environmental Health, 36(3): 397-441. https://doi.org/10.1515/reveh-2020-0097
[14] Wey, W.M., Huang, J.Y. (2018). Urban sustainable transportation planning strategies for livable City's quality of life. Habitat International, 82: 9-27. https://doi.org/10.1016/j.habitatint.2018.10.002
[15] Sanchez, T.W., Ye, X. (2023). The implications of human mobility and accessibility for transportation and livable cities. Urban Science, 7(4): 107. https://doi.org/10.3390/urbansci7040107
[16] Mardiansjah, F.H., Handayani, W., Setyono, J.S. (2018). Urban population growth and development of distribution patterns in the Surakarta metropolitan area. Jurnal Wilayah Dan Lingkungan, 6(3): 215. https://doi.org/10.14710/jwl.6.3.215-233
[17] Wey, W.M. (2019). Constructing urban dynamic transportation planning strategies for improving quality of life and urban sustainability under emerging growth management principles. Sustainable Cities and Society, 44: 275-290. https://doi.org/10.1016/j.scs.2018.10.015
[18] Gonzalez-Garcia, S., Manteiga, R., Moreira, M.T., Feijoo, G. (2018). Assessing the sustainability of Spanish cities considering environmental and socio-economic indicators. Journal of Cleaner Production, 178: 599-610. https://doi.org/10.1016/j.jclepro.2018.01.056
[19] Camagni, R., Capello, R., Nijkamp, P. (1998). Towards sustainable city policy: An economy-environment technology nexus. Ecological Economics, 24(1): 103-118. https://doi.org/10.1016/S0921-8009(97)00032-3
[20] Junior, C.M., Ribeiro, D.M.N.M., da Silva Pereira, R., Bazanini, R. (2018). Do Brazilian cities want to become smart or sustainable? Journal of Cleaner Production, 199: 214-221. https://doi.org/10.1016/j.jclepro.2018.07.072
[21] Zhan, D., Kwan, M.P., Zhang, W., Fan, J., Yu, J., Dang, Y. (2018). Assessment and determinants of satisfaction with urban livability in China. Cities, 79: 92-101. https://doi.org/10.1016/j.cities.2018.02.025
[22] Benita, F., Kalashnikov, V., Tunçer, B. (2021). A spatial livability index for dense urban centers. Environment and Planning B: Urban Analytics and City Science, 48(7): 2006-2022. https://doi.org/10.1177/2399808320960151
[23] Almatar, K.M. (2024). Rehumanize the streets and make them more smart and livable in Arab cities: Case study: Tahlia Street; Riyadh City, Saudi Arabia. Sustainability, 16(8): 3376. https://doi.org/10.3390/su16083376
[24] Kose, E., Vural, D., Canbulut, G. (2020). The most livable city selection in Turkey with the grey relational analysis. Grey Systems: Theory and Application, 10(4): 529-544. https://doi.org/10.1108/GS-04-2020-0042
[25] Saitluanga, B.L. (2014). Spatial pattern of urban livability in Himalayan Region: A case of Aizawl City, India. Social Indicators Research, 117(2): 541-559. https://doi.org/10.1007/s11205-013-0362-3
[26] Senlier, N., Yildiz, R., Aktaş, E.D. (2009). A perception survey for the evaluation of urban quality of life in Kocaeli and a comparison of the life satisfaction with the European cities. Social Indicators Research, 94(2): 213-226. https://doi.org/10.1007/s11205-008-9361-1
[27] Lee, R.J., Sener, I.N. (2016). Transportation planning and quality of life: Where do they intersect? Transport Policy, 48: 146-155. https://doi.org/10.1016/j.tranpol.2016.03.004
[28] Saisana, M., Saltelli, A., Tarantola, S., Hoffman, A., Giovannini, E. (2005). Handbook on constructing composite indicators: Methodology and user guide. OECD Statistics Working Papers. https://doi.org/10.1787/53341181501
[29] Santoso, K.N., Usman, H. (2020). Indeks Komposit Pekerjaan Tidak Layak (IPTL) di Indonesia. Jurnal Kependudukan Indonesia, 15(1): 19-32. http://doi.org/10.14203/jki.v15i1.493
[30] Nardo, M., Saisana, M., Saltelli, A., Tarantola, S., Hoffmann, A., Giovannini, E. (2008). Handbook on Constructing Composite Indicators: Methodology and User Guide. http://doi.org/10.1787/533411815016
[31] Dinas Komunikasi dan Informatika Kota Depok, D. (2021). Indeks Kebahagiaan Masyarakat Kota Depok 2021.
[32] Cutter, S.L., Boruff, B.J., Shirley, W.L. (2012). Social vulnerability to environmental hazards. Hazards Vulnerability and Environmental Justice, pp. 115-132. https://doi.org/10.1111/1540-6237.8402002
[33] Azwar, S. (2013). Penyusunan Skala Psikologi (2nd ed.). Pustaka Pelajar.
[34] Saeed, U., Ahmad, S.R., Mohey-ud-din, G., Butt, H.J., Ashraf, U. (2022). An integrated approach for developing an urban livability composite index—A cities’ ranking road map to achieve urban sustainability. Sustainability, 14(14): 8755. https://doi.org/10.3390/su14148755
[35] Ashari, M.I., Budiono, A. (2023). Legal review of parking levy at Pasar Raya Salatiga City. International Conference Restructuring and Transforming Law, 2(1): 369-375. https://proceedings.ums.ac.id/index.php/icrtlaw/article/view/3598.
[36] Jayawardana, D., Baryshnikova, N.V., Cheng, T.C. (2023). The long shadow of child labour on adolescent mental health: A quantile approach. Empirical Economics, 64(1): 77-97. https://doi.org/10.1007/s00181-022-02241-5
[37] Pramono, R., Nurfajrina, I.A., Nariswari, N. (2019). Place’s quality determinant for people happiness based on capability survey. TATATLOKA, 21(1): 153-169. https://doi.org/10.14710/tataloka.21.1.153-169
[38] Adiati, R.P. (2021). Life satisfaction: A review of the financial conditions and money spending style. Jurnal Ilmu Keluarga Dan Konsumen, 14(1): 40-51. https://doi.org/10.24156/jikk.2021.14.1.40
[39] Wu, F. (2020). An examination of the effects of consumption expenditures on life satisfaction in Australia. Journal of Happiness Studies, 21(8): 2735-2771. https://doi.org/10.1007/s10902-019-00161-3
[40] Stryzhak, O.O. (2020). The relationship between education, income, economic freedom and happiness. SHS Web of Conferences, 75: 03004. https://doi.org/10.1051/shsconf/20207503004
[41] Satrio, M.I., Sukmawati, A.M.A. (2021). Life satisfaction: A review of financial conditions and money usage styles. Desa-Kota: Jurnal Perencanaan Wilayah, Kota, dan Permukiman, 3(1): 36-48. https://doi.org/10.20961/desa-kota.v3i1.43694.36-48
[42] Panjaitan, M.Y., Purwanto, P., Warsito, B. (2023). Obedience level management and monitoring environment in industry manufacturing in Salatiga City. Jurnal Ilmu Lingkungan, 21(2): 329-340. https://ejournal.undip.ac.id/index.php/ilmulingkungan/article/view/49243.
[43] Nihayah, D.M., Sundoro, F.M., Masluhah, L. (2025). Spatial effects on air quality due to the capital city relocation. IOP Conference Series: Earth and Environmental Science, 1438(1): 012052. https://doi.org/10.1088/1755-1315/1438/1/012052
[44] Pujiati, A., Nihayah, D.M., Handayani, B.D., Rosalia, A.C.T., Herlitah, H. (2025). Economic globalization and environmental quality: A spatial analysis of spillover effects in Indonesia. Anuario Do Instituto de Geociencias, 48: 1-17. https://doi.org/10.11137/1982-3908_2025_48_65574