Masykur Alawi![]() | Akhmad Fauzi*
| Akhmad Fauzi*![]() | Ernan Rustiadi
| Ernan Rustiadi![]() | Hania Rahma
| Hania Rahma![]()
© 2025 The authors. This article is published by IIETA and is licensed under the CC BY 4.0 license (http://creativecommons.org/licenses/by/4.0/).
OPEN ACCESS
Indonesia's low Human Development Index (HDI) has been highlighted as a need to improve health outcomes, particularly at the regional level. This study evaluates public health in Sukabumi Regency, Indonesia through sub-district level analysis to address the shortcomings of the current national index by developing a new composite index. The research method used was a composite index with the following stages: filling in questionnaires by 6 experts, weighting each dimension and variable used, normalisation, and aggregation. The results showed that the composite index measurement for each dimension was classified into five categories: very high (2.13%), high (29.79%), medium (40.43%), low (19.15%), and very low (8.51%). The INMO and INMB Cartesian diagrams show that the southern sub-district achieved the largest value of 21.28%, which is in quadrant 1 (both variables are good). The INMO and NSI Cartesian diagrams show that the sub-districts in the southern region have the largest value (21.28%) in quadrant 4 (both variables are not good). The INMB and NSI Cartesian diagrams show that the southern sub-districts have the largest value (19.15%) in quadrant 3 (INMB is not good and NSI is good) and 19.15% in quadrant 4 (INMB and NSI are not good). This study shows the disparity of the public health degree index in the southern region of the cities to have higher scores than the northern ones.
composite index, human development index, public health, regional disparities
Health and regional development are fundamentally interconnected and vital to societal advancement. Health plays a pivotal role in enhancing human capital, which subsequently drives economic growth [1-4]. The notion of health extends beyond merely the absence of illness to include comprehensive physical, mental, and social wellness within a community. Collectively, these elements boost societal productivity, lower health expenditures, and improve economic stability [5, 6]. Health is also closely connected to the achievement of sustainable development, making it essential to maintain the health of society as a prerequisite for sustainable development [7, 8]. As an indicator of well-being, factors like life expectancy and quality of life reflect health as a component of holistic sustainable regional development [9]. Within the framework of the Sustainable Development Goals (SDGs), health and well-being are crucial for achieving these goals, including reducing mortality from various diseases [10]. However, assessing both health performance and sustainable development achievement remains challenging, particularly in developing countries. The COVID-19 pandemic, which spanned from 2020 to the end of 2022, negatively impacted global health, resulting in current trends falling short of the 2030 targets [11].
High mortality and morbidity rates among pregnant women (maternal health), newborns, infants, and toddlers are closely linked to nutritional issues. These problems can manifest as both malnutrition and overnutrition. Malnutrition encompasses conditions such as underweight, wasting, stunting, and micronutrient deficiencies, with Indonesia ranking 115th out of 151 countries in terms of stunting. Overnutrition issues include overweight, obesity, and excessive micronutrient intake [12-16].
In West Java Province, Sukabumi Regency is one of the regions with low health outcomes. The life expectancy rate of 87.64 years significantly contributes to Sukabumi's low HDI, ranking it 23rd out of 27 regencies and cities in 2022. This situation is further highlighted by the 2018 Community Health Development Index (CHDI), which placed Sukabumi Regency 24th among the same 27 regencies and cities [17-19]. The Infant Mortality Rate (IMR) is a crucial indicator for calculating life expectancy. Approximately 85% of infant deaths occur within the first 7 days of life, primarily due to health issues, poor nutrition during pregnancy, improper delivery methods, and inadequate newborn care. In Sukabumi Regency, the average infant mortality rate exceeds 6 deaths per thousand live births annually, with rates consistent across the northern, central, and southern regions [20]. The stunting rate in Sukabumi Regency reached 27.5% in 2022, making it the second highest in the region after Sumedang Regency [15]. The aim of this study was to analyse regional disparities in public health, particularly a sub-district level analysis to health planning development of Sukabumi Regency, Indonesia, so that it can be one of the basic references for implementing activity programs in the health sector.
There are disparities in the utilization of health services between regions in rural Indonesia. Regions in Western Indonesia tend to have better utilization of health services in rural areas [21]. Health status in urban areas is better than in rural areas. Areas close to city centers have better access to health services and better health standards [22]. Regional disparities can be an inseparable part of the community health status, especially differences in region and community income [23]. Health status plays a crucial role in characterizing the health profile of a community. Understanding the community's health status provides insight into the overall health conditions within the area. Various analytical methods, including multi-criteria analysis with relevant indicators, can be employed to assess community health status in different regions.
Key aspects for determining public health levels include mortality rates, morbidity rates, and nutritional status. Identified several indicators for measuring public health, such as declines in maternal, child, and infant mortality rates, increases in life expectancy, reductions in disability and morbidity rates, and improvements in the community's nutritional status [24].
The evaluation of public health can be based on three components: mortality rate, morbidity rate, and community nutritional status [25]. Mortality rates can be assessed using indicators such as the Infant Mortality Rate (IMR) and Maternal Mortality Rate (MMR) [26].
Morbidity levels can be measured through various indicators. For instance, hypertension and diabetes mellitus significantly increase the risk of cardiovascular diseases and are major contributors to global morbidity and mortality [27]. Both conditions also impose considerable financial burdens on the healthcare system and the global economy [5]. Tuberculosis remains a critical public health issue worldwide.
Chronic malnutrition incidence is another important measure of public health. Research by Harismayanti and Syukur [28] indicated that pregnant women experiencing chronic energy deficiency face heightened risks of maternal mortality during the perinatal period and the likelihood of delivering low birth weight (LBW) babies. The WHO has reported that 40% of maternal deaths in developing countries are linked to chronic energy deficiency.
A study on Chronic Energy Deficiency found that pregnant women with this condition are 3.95 times more likely to give birth to LBW infants. This highlights the relationship between Chronic Energy Deficiency in pregnant women and the occurrence of LBW. Pregnant women with a history of Chronic Energy Deficiency are at greater risk for LBW compared to those without such a history [29]. The importance of health education in reducing Chronic Energy Deficiency among pregnant women, as those with poor nutritional status are more likely to have LBW infants and face heightened mortality risks [30]. The impacts of nutritional assistance on improving nutritional behaviors among pregnant women with Chronic Energy Deficiency, demonstrating that such assistance effectively increases knowledge and practices regarding nutrition, ultimately helping to prevent stunting in newborns [31].
3.1 Study description
The composite index was applied to answer the objectives of this study, i.e., to determine the degree of public health in 47 sub-districts in Sukabumi Regency, West Java Province in Indonesia.
3.2 Composite indicators
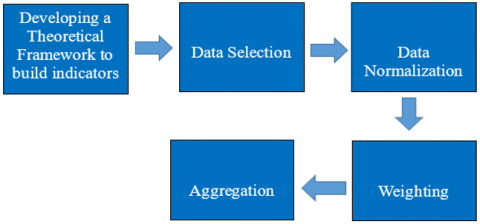
The composite index method was used to obtain the public health index. The stages carried out to build this composite index are explained in Figure 1 as follows.
Figure 1. Stages of index development [32]
Composite indicators are considered much easier to interpret than using many indicators separately [32, 33]. Composite indexes have proven useful in measuring regional performance, comparing and viewing changes that are intertemporal between regions, can describe complex problems in a simpler way, and are useful in decision making or determining policy priorities.
Several composite indexes to measure development performance have been conducted by various studies. The Regional Sustainable Development Index was created [34-37] and also used a composite index to measure socio-economic welfare and ecological damage index at the provincial level in Indonesia in the context of Doughnut Economy [34]. The composite index was also used to measure Regional Vulnerability on Food Insecurity in Indonesia and to develop the Regional Development Priority Index in West Java Province [37]. Meanwhile, mapped areas experiencing inequality into a composite index using factor analysis [36].
3.2.1 Composite index calculation
The first step taken in building a community health index was to determine the dimensions and indicators. In addition to being based on existing references, the determination of indicators in each dimension is also strengthened by the opinions of experts through Focus Group Discussions (FGD). The results of the FGD agreed on three dimensions to be used and each dimension consists of a number of indicators, i.e., the Mortality (MO) dimension with 3 indicators, the Morbidity (MB) dimension with 7 indicators, and the Nutritional Status & Chronic Energy Deficiency (SG) dimension with 5 indicators. The names and operational definitions of the indicators in each dimension are shown in Table 1.
Table 1. Dimensions and indicators forming the public health index
|
Dimension |
Indicator |
Operational Definition |
|
Mortality (MO) |
Maternal Mortality (MO1) |
Number of maternal deaths during pregnancy and childbirth per 1000 number of pregnant and childbirth mothers. |
|
Infant Mortality (MO2) |
The number of deaths of infants aged < 12 months per 1000 infants of the same age. |
|
|
Infant Mortality (MO3) |
The number of deaths of children aged < 5 years per 1000 children of the same age. |
|
|
Morbidity (MB) |
Hypertension (MB1) |
The number of people aged 15 years and over diagnosed with hypertension by medical personnel per 1000 people of the same age. |
|
Diabetes Mellitus (MB2) |
Number of people aged 15 years and over per 1000 people diagnosed with diabetes by a doctor in 2023. |
|
|
People with Mental Disorders (MB3) |
Number of people diagnosed with Mental Disorders by doctors in 2023. |
|
|
Pneumonia (MB4) |
The number of people diagnosed with pneumonia by doctors per 100 people in 2023. |
|
|
Diarrhea (MB5) |
Number of children under 5 years diagnosed with pneumonia by doctors per 1000 population in 2023. |
|
|
TB (MB6) |
Number of people diagnosed with (tuberculosis) TB per 1000 population in 2023. |
|
|
HIV (MB7) |
Number of people diagnosed with HIV per 1000 population in 2023. |
|
|
Nutritional Status and Chronic Energy Deficiency (SG) |
Malnutrition (SG1) |
Number of children under 5 years diagnosed with malnutrition (<-3 SD) by health workers (doctors, midwives and other health workers) per 100 population in 2023. |
|
Malnutrition (SG2) |
Number of children under 5 years diagnosed with malnutrition (<-2SD) by health workers (doctors, midwives and other health workers) per 100 population in 2023. |
|
|
Stunting (SG3) |
Number of children under 5 years diagnosed with stunting by health workers (doctors, midwives and other health workers) per 100 population in 2023. |
|
|
Overnutrition (SG4) |
Number of children under 5 years diagnosed with overnutrition by health workers (doctors, midwives and other health workers) per 100 population in 2023. |
|
|
Chronic Energy Deficiency (SG5) |
Number of pregnant women who have been diagnosed with chronic energy deficiency by health workers (doctors, midwives and other health workers) per 100 population in 2023. |
The index calculation was carried out at the sub-district level so that this index evaluated 47 sub-districts in Sukabumi Regency. The data used was secondary data collected from each sub-district health center. The data collected was the condition in 2023.
Normalization was applied to equalize the units of all indicators. The normalization method used was the maximum-minimum method. Since all indicators exhibit negative polarization, the following equation was employed:
$X_{i j}=( Ximax - Xij ) /( Ximax - Ximin ) \times 100$ (1)
where, Xi is the i-th indicator for the j-th sub-district, Ximax is the maximum value of the i-th indicator, and Ximin is the minimum value of the i-th indicator. The minimum and maximum values were determined from the distribution of the existing data.
Weighting for each indicator and dimension was conducted using the direct ranking method. This method involved several experts to rank each dimension and indicator based on their level of importance. A total of six experts were asked to provide their assessments, consisting of one academic in the field of public health and five health practitioners from the Sukabumi Regency Health Centers, Health Office, and Regional Hospitals.
Experts were selected according to their expertise and knowledge of the Health Status in the Sukabumi Regency area, including the Head of the Sukabumi Regency Health Office, Director of Sagaranten Regional Hospital, Academics of the Muhammadiyah University of Sukabumi, Head of the Health Efforts and Financing Division, Head of the Maternal and Child Health Team of the Sukabumi Regency Health Office, and Head of the Disease Prevention and Control Team.
The weight calculation was determined using the Rank Order Centroid (ROC) technique. The calculation formula was as follows:
$\mathrm{Wi}=\frac{1}{k} \sum_{i=j}^K\left(\frac{1}{i}\right)$ (2)
where, the Wi value is the weight value of the i-th dimension or indicator, K is the number of dimensions or indicators, and i is the order of the level of importance of the dimension or indicator. The following are the weighting results of each dimension and indicator (Table 2).
Table 2. Dimension and indicator weight values
|
Dimension |
Weight Name |
Weight |
Indicator |
Weight Name |
Weight |
|
Mortality |
W MO |
0.44 |
maternal mortality |
W MO1 |
0.50 |
|
infant mortality |
W MO2 |
0.39 |
|||
|
infant mortality |
W MO3 |
0.11 |
|||
|
Morbidity |
W MB |
0.31 |
hypertension (HT) |
W MB1 |
0.29 |
|
diabetes (DM) |
W MB2 |
0.22 |
|||
|
people with mental disorders |
W MB3 |
0.04 |
|||
|
pneumonia |
W MB4 |
0.09 |
|||
|
HIV |
W MB5 |
0.11 |
|||
|
diarrhea |
W MB6 |
0.10 |
|||
|
TB |
W MB7 |
0.16 |
|||
|
Nutritional status |
W SG |
0.25 |
malnutrition |
W SG1 |
0.17 |
|
malnutrition |
W SG2 |
0.32 |
|||
|
stunting |
W SG3 |
0.25 |
|||
|
overnutrition |
W SG4 |
0.05 |
|||
|
chronic energy deficiency |
W SG5 |
0.21 |
Aggregation was carried out in stages to produce a composite index value. The first was to aggregate all indicators in each dimension by multiplying the normalized indicator value by its weight (Wi) and adding the results. From this stage, three dimensional indices were obtained, i.e., the Non-Mortality Index (INMO), the Non-Morbidity Index (INMB), and the Nutritional Status Index (NSI). The aggregation formula for each dimension was as follows:
$I N M O=\left(\mathrm{MO}_1 \times W_{M O_1}\right)+\left(\mathrm{MO}_2 \times W_{M O_2}\right)+\left(\mathrm{MO}_3 \times W_{M O_3}\right)$ (3)
$I N M B=\left(M B_1 \times W_{M B 1}\right)+\left(M B_2 \times W_{M B 2}\right)+\cdots+\left(M B_7 \times W_{M B 7}\right)$ (4)
$N S I=\left(S_{G_1} \times W_{S G_1}\right)+\left(S G_2 \times W_{S G 2}\right)+\cdots+\left(S G_5 \times W_{S G 5}\right)$ (5)
The second stage was to carry out aggregation to obtain the Public Health Degree Index (PHDI) by multiplying each dimension index by its weight and adding up the results, with the following formula:
$\operatorname{PHDI}=\left(I N M O \times W_{M O}\right)+\left(I M B \times W_{M B}\right)+\left(N S I \times W_{S G}\right)$ (6)
The PHDI values obtained were then classified into five categories: very high ($\mathrm{X} \geq \bar{x}+1.5$ std), high ($\bar{x}+0.5$ std $\leq \mathrm{X} \leq \bar{x}+1.5$ std), moderate ($\bar{x}-0.5$ std $\leq \mathrm{X} \leq \bar{x}+0.5$ std), low ($\bar{x}-1.5$ std $\leq \mathrm{X} \leq \bar{x}-0.5$ std), and very low ($\mathrm{X} \leq \bar{x}-1.5$ std).
Evaluation of the public health level in 47 sub-districts in Sukabumi Regency in 2023 using a composite index produced a classification of the Public Health Degree Index (PHDI) which was built by three other index dimensions, i.e., the Non-Mortality Index (INMO), Non-Morbidity Index (INMB) and Nutritional Status Index (NSI). The index values were classified into five categories and visualized on the map, i.e., very high, high, medium, low and very low, and visualized with color gradations ranging from the oldest to the youngest. The Public Health Degree Index (PHDI) was visualized in green, the Non-Mortality Index (INMO) in red, the Non-Morbidity Index (INMB) in yellow, and the Nutritional Status Index (NSI) in blue. The distribution of values for each index and sub-index for 47 sub-districts in Sukabumi Regency is presented in Table 3.
Table 3. Distribution public health degree index, non-mortality sub-index, non-morbidity sub-index, and nutritional status sub-index in Sukabumi Regency in 2023
|
No. |
Sub-District |
PHDI |
INMO |
INMB |
NSI |
|
1 |
Curugkembar |
85.29 |
96.03 |
81.82 |
70.45 |
|
2 |
Ciemas |
83.40 |
92.82 |
85.24 |
64.40 |
|
3 |
Cisolok |
83.12 |
95.84 |
71.58 |
74.61 |
|
4 |
Cidadap |
82.87 |
100.00 |
72.10 |
65.60 |
|
5 |
Kalapanunggal |
82.20 |
91.52 |
77.39 |
71.49 |
|
6 |
Kalibunder |
81.08 |
96.53 |
64.59 |
73.74 |
|
7 |
Cicantayan |
80.47 |
88.59 |
79.92 |
66.70 |
|
8 |
Cimanggu |
80.40 |
91.24 |
75.98 |
66.51 |
|
9 |
Nagrak |
79.60 |
85.78 |
78.13 |
70.39 |
|
10 |
Jampangtengah |
79.15 |
92.79 |
84.71 |
48.10 |
|
11 |
Ciracap |
79.09 |
83.37 |
81.27 |
68.81 |
|
12 |
Sagaranten |
78.49 |
82.56 |
65.81 |
86.77 |
|
13 |
Pabuaran |
78.08 |
88.42 |
77.11 |
60.90 |
|
14 |
Kabandungan |
77.78 |
96.14 |
68.11 |
56.96 |
|
15 |
Cikakak |
77.15 |
93.41 |
57.40 |
72.38 |
|
16 |
Cikembar |
76.59 |
69.04 |
81.23 |
84.33 |
|
17 |
Kebonpedes |
76.54 |
71.26 |
76.13 |
86.42 |
|
18 |
Parungkuda |
76.25 |
78.02 |
74.30 |
75.49 |
|
19 |
Gunungguruh |
76.21 |
77.18 |
75.47 |
75.38 |
|
20 |
Surade |
75.62 |
81.34 |
77.33 |
63.35 |
|
21 |
Simpenan |
75.41 |
72.78 |
78.15 |
76.74 |
|
22 |
Bantargadung |
74.72 |
81.96 |
72.76 |
64.23 |
|
23 |
Cikidang |
74.72 |
87.84 |
42.77 |
90.42 |
|
24 |
Cireunghas |
74.07 |
77.78 |
70.49 |
71.85 |
|
25 |
Ciambar |
74.05 |
77.23 |
76.47 |
65.45 |
|
26 |
Cicurug |
73.09 |
73.46 |
67.34 |
79.45 |
|
27 |
Nyalindung |
72.78 |
78.37 |
76.12 |
58.76 |
|
28 |
Palabuhanratu |
72.74 |
90.85 |
51.67 |
66.29 |
|
29 |
Purabaya |
72.58 |
75.23 |
70.44 |
70.48 |
|
30 |
Sukabumi |
71.86 |
68.13 |
75.86 |
73.60 |
|
31 |
Bojonggenteng |
71.85 |
72.42 |
69.85 |
73.28 |
|
32 |
Warungkiara |
71.77 |
90.82 |
64.87 |
46.33 |
|
33 |
Parakansalak |
70.27 |
64.08 |
88.30 |
59.24 |
|
34 |
Cibadak |
69.98 |
74.31 |
69.66 |
62.67 |
|
35 |
Sukaraja |
69.10 |
72.06 |
60.68 |
74.10 |
|
36 |
Cisaat |
67.23 |
68.89 |
67.72 |
63.67 |
|
37 |
Cibitung |
67.18 |
51.68 |
84.93 |
73.02 |
|
38 |
Waluran |
67.06 |
65.09 |
76.52 |
58.99 |
|
39 |
Kadudampit |
65.62 |
66.20 |
74.65 |
53.57 |
|
40 |
Cidahu |
65.31 |
68.49 |
64.82 |
60.27 |
|
41 |
Sukalarang |
65.30 |
67.45 |
66.44 |
60.07 |
|
42 |
Caringin |
64.59 |
62.89 |
74.74 |
55.20 |
|
43 |
Jampangkulon |
64.44 |
72.58 |
59.90 |
55.54 |
|
44 |
Lengkong |
61.20 |
56.55 |
67.46 |
61.80 |
|
45 |
Gegerbitung |
58.84 |
39.51 |
75.71 |
72.58 |
|
46 |
Cidolog |
53.51 |
19.97 |
76.32 |
85.24 |
|
47 |
Tegalbuleud |
52.57 |
46.76 |
52.64 |
62.80 |
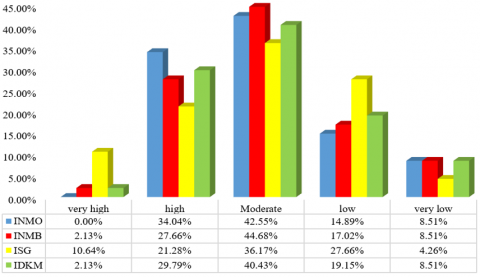
Figure 2. Percentage of Subdistricts by distribution c index, non-morbidity index, nutritional status index, and public health degree index of Sukabumi Regency in 2023
Figure 2 shows the distribution of PHDI, INMO, INMB, and NSI value categories. In general, the largest percentage of sub-districts is in the 'medium' value category, which ranges from 36.2% - 44.7% of the total 47 sub-districts. The second largest percentage for INMO, INMB, and PHDI is the 'high' category, which ranges from 21.3% - 34.0% of the total number of sub-districts, while the second largest percentage for NSI is the 'low' category with a total of 27.7% of sub-districts. However, none of the sub-districts are in the 'very high' category for the INMO sub-index value.
The sub-district with the highest PHDI value of 85.29 is Curugkembar which excels in INMO and INMB values. Curugkembar is the only sub-district that falls into the 'very high' PHDI category. Conversely, the lowest PHDI of 52.57 is in Tegalbuleud Sub-district. Together with three other sub-districts, i.e., Cidolog, Gegerbitung and Lengkong, Tegalbuleud Sub-district is in the 'very low' PHDI category.
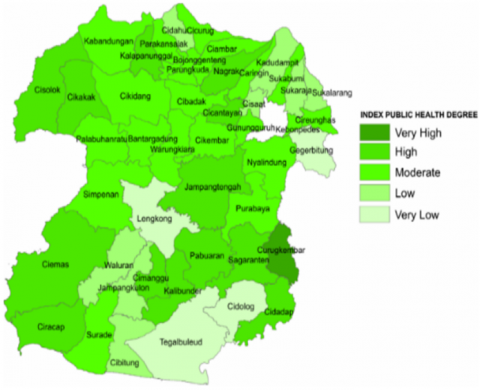
Figure 3(a) shows the distribution of sub-districts based on PHDI categories in 47 sub-districts in Sukabumi Regency, Indonesia. In the northern part of Sukabumi, 0.00% of sub-districts have very high PHDI values, 8.51% high, 21.28% moderate, 12.77% low, and 2.13% very low PHDI. Meanwhile, in the southern part of Sukabumi, there is one (2.13%) sub-district with very high PHDI, 21.28% high, 19.15% moderate, 6.38% low, and 6.38% very low PHDI. In general, PHDI in the southern sub-district is higher (42.55%) than in the northern sub-district (29.79%), including the very high and moderate categories. The importance of health, nutrition, and socioeconomic factors in increasing antenatal care coverage can impact public health, including indicators of morbidity, mortality, and nutritional status, as analysed in research conducted in 34 provinces in Indonesia [38].
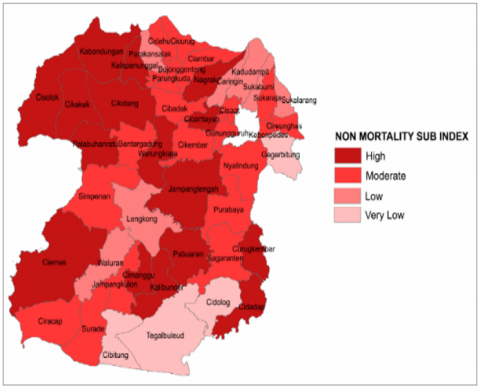
Almost similar to PHDI, the distribution of sub-districts based on the category of non-mortality index (INMO) values in Figure 3(b) shows that sub-districts with a 'very high' non-mortality category are absent in either the southern or northern regions. The INMO category in the northern region is high (8.51%), moderate (25.53%), low (8.52%), and very low (2.13%). The INMO category in the southern sub-districts is high (25.53%), moderate (17.02%), low (6.38%), and very low (6.38%). The non-mortality index of the southern sub-districts is higher (42.55%) compared to the northern region (34.04%) from the high and moderate INMO categories. The high mortality rate in Ghana is due to regional disparities and the low health services including the justice system of health access [39]. Therefore, the gap in health facilities between urban and rural areas significantly hampers health services in rural communities [3].
(a)
(b)
(c)
(d)
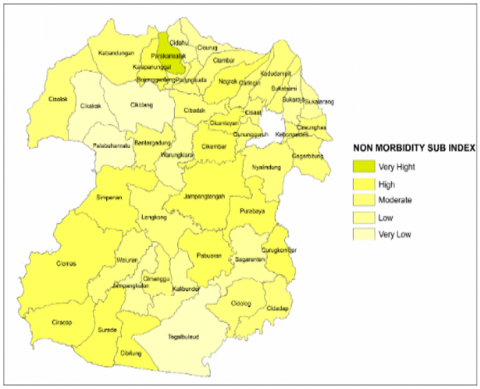
Figure 3. Public health degree index (a), non-mortality index (INMO) (b), non-morbidity index (c), and nutritional status index (NSI) (d) in Sukabumi Regency in 2023
The distribution pattern of non-morbidity levels (INMB) in 47 sub-districts in the northern part of Sukabumi Regency (Figure 3(c)) has no very high category (0.00%), high (8.51%), moderate (23.40%), low (10.64%), and very low (2.13%). While the INMB category in the southern sub-districts are very high (2.13%), high (19.15%), moderate (21.28%), low (6.38%), and very low (6.38%). The non-morbidity index of the southern sub-district is higher (40.43%) than the northern part (31.91%) from the very high, high, and moderate INMB categories. Illness can be caused by changes in lifestyle and environment [40]. Furthermore, genetic factors are associated with disease. One of the global health challenges is the persistently high mortality rate, which is influenced by geographic and systemic contexts [41]. The regional context in Sukabumi Regency is interconnected due to the diverse geographic regions of each sub-district.
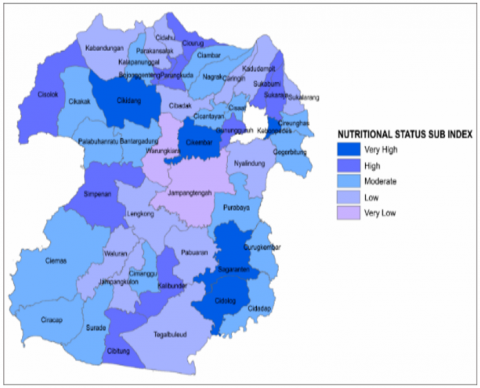
Distribution of Nutritional Status levels in 47 sub-districts in Sukabumi Regency is shown in Figure 3(d). Based on the category of nutritional status index (NSI) values, the northern sub-districts are very high (2.13%), high (6.38%), moderate (17.02%), low (19.15%), and very low (0.00%). While the southern sub-districts are in the NSI category of very high (8.51%), high (14.89%), moderate (19.15%), low (8.51%), and very low (4.26%). The nutritional status index in the southern sub-districts is higher (42.55%) compared to the northern sub-districts (25.53%) from the very high, high and moderate categories. Nutrition plays a crucial role in the human life cycle from conception to old age [42]. In Indonesia, nutritional status is related to breastfeeding. Improving nutritional quality can also be achieved by consuming rice [43]. Some areas still have limited access to food diversity for health. Regional and socioeconomic diversity present unique challenges in Sukabumi Regency in accessing healthcare.
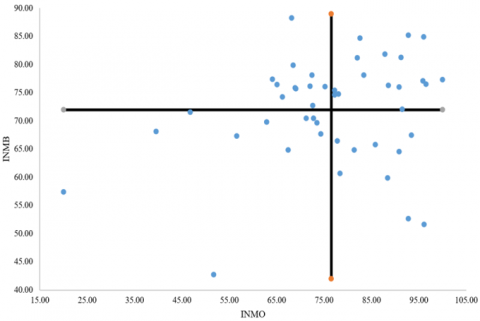
In general, the distribution of non-mortality index (INMO), non-morbidity (INMB), nutritional status (NSI), and Public Health Degree Index (PHDI) is higher in the southern sub-districts compared to the northern sub-districts. In addition to categorizing sub-districts for each sub-index individually, sub-district classification was also carried out based on the relationship between two sub-indices or dimensions using quadrant analysis. Figures 4(a) to 4(c) show successively the relationship between the non-mortality dimension (INMO) and the non-morbidity dimension (INMB); between the non-mortality dimension (INMO) and the nutritional status dimension (NSI); and between the nutritional status dimension (NSI) and the morbidity dimension (INMB).
The quadrant analysis between INMO and INMB in Figure 4(a) groups 47 sub-districts in Sukabumi into four sub-district classifications. From the quadrant diagram, four sub-district classifications are identified. Quadrant 1 is a sub-district with high INMO and high INMB values; Quadrant 2 is a sub-district with low INMO and high INMB values; Quadrant 3 is a sub-district with low INMO and INMB; and Quadrant 4 is a sub-district with high INMO and low INMB. The boundary between high and low values uses the average value of Sukabumi Regency.
As seen in Figure 4(a), there are 16 or 34.04% of sub-districts in Quadrant 1 with high INMO and INMB values. In the opposite quadrant, quadrant 3, there are 11 or 23.4% of sub-districts with low INMO and INMB values. The rest are in quadrants 2 and 4 with only one dimension having a high value. The sub-districts in each quadrant are: Quadrant 1 is 12.77% of the sub-districts in the northern region (Cikidang, Cicantayan, Kalapanunggal, Gunungguruh, Ciambar, and Parungkuda) and 21.28% of the sub-districts in the southern region (Ciemas, Cimanggu, Kalibunder, Cidadap, Curugkembar, Palabuhanratu, Cisolok, Sagaranten, Ciracap, Bantargadung). Quadrant 2 is 17.02% of the sub-districts in the northern region (Cireunghas, Sukaraja, Cisaat, Sukabumi, Cidahu, Bojonggenteng, Kadudampit and Parakansalak) and 8.51% of the southern region (Jampangkulon, Purabaya, Cikembar and Waluran). Quadrant 3 is 4.26% of the sub-districts in the northern region (Pabuaran and Nagrak) and 12.77% of the southern region (Warungkiara, Jampangtengah, Cikakak, Kabandungan, Surade, Nyalindung). Quadrant 4 is 12.77% of the northern sub-districts (Kebonpedes, Cibadak, Cicurug, Gegerbitung, Caringin, Sukalarang) and 10.64% of the southern districts (Lengkong, Cibitung, Tegalbuleud, Cidolog and Simpenan). The health status of mortality and morbidity in Indonesia, for example, is presented in a study that cultural knowledge and sensitivity play a significant role in the provision and acceptance of health services by local families in Papua, Indonesia [44]. Health conditions in Indonesian provinces from 1990-2019 have improved, as evidenced by increasing life expectancy. Furthermore, mortality rates also vary widely across provinces [45].
(a)
(b)
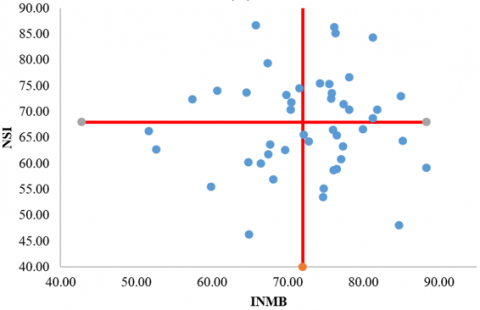
(c)
Figure 4. Classification of Sub-districts based on value INMO and INMB (a), on value INMO and NSI (b), INM B and NSI (c)
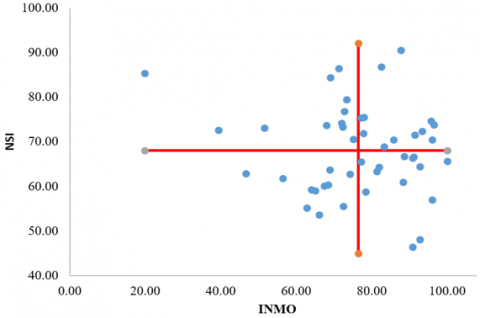
Figure 4(b) classifies sub-districts based on two dimensions of INMO and NSI. There are 11 or 23.4% of sub-districts in Quadrant 1 with high INMO and NSI values. In the opposite quadrant (quadrant 3), there are 13 or 27.7% of sub-districts with low INMO and NSI values. The rest are in quadrants 2 and 4 with only one dimension having a high value. The names of the sub-districts in each quadrant are as follows: Quadrant 1 is 12.77% of the northern sub-district area (Cireunghas, Gunungguruh, Nagrak, Parungkuda, Cikidang, and Curugkembar) and 10.64% of the southern sub-district area (Ciracap, Kalibunder, Sagaranten, Cisolok, and Cikakak). Quadrant 2 is 10.64% of the northern sub-district area (Gegerbitung, Sukaraja, Kebonpedes, Sukabumi, Cicurug, Bojonggenteng, and Kalapa Nunggal) and 14.89% of the southern sub-district area (Cibitung, Cidolog, Simpenan, Purabaya, and Cikembar). Quadrant 3 is 14.89% of the northern sub-district area (Sukalarang, Kadudampit, Cisaat, Cibadak, Caringin, Cidahu, and Parakansalak) and 8.51% of the southern sub-district area (Waluran, Jampangkulon, Tegalbuleud, and Lengkong). Quadrant 4 is 6.38% of the northern sub-district area (Cicantayan, Ciambar, and Kabandungan) and 21.28% of the southern sub-district area (Ciemas, Surade, Cimanggu, Cidadap, Pabuaran, Palabuhanratu, Warungkiara, Bantargadung, Jampang Tengah, and Nyalindung). Mardani et al. [46] stated that Indonesia has begun to develop programs to address morbidity and nutritional status issues by providing nutritious food to children. In addition, mothers in the intervention group experienced an increase in understanding of malnutrition, self-efficacy, and complementary feeding practices compared to the non-control group.
There are 13 or 27.7% of sub-districts in Quadrant 1 with high INMB and NSI values. In the opposite quadrant (quadrant 3), there are 10 or 21.2% of sub-districts with low INMB and NSI values (Figure 4(c)). The rest are in quadrants 2 and 4 with only one dimension having a high value. The names of the sub-districts in each quadrant are as follows: Quadrant 1 is 19.15% of the northern sub-district area (Sukaraja, Cicantayan, Kadudampit, Cisaat Parakansalak, Cikidang, Bojonggenteng, Curugkembar, Parakansalak, and Ciambar) and 8.51% is in the southern sub-district area (Bantargadung, Ciracap, Cikembar, and Cimanggu). Quadrant 2 is 6.38% of the northern sub-district area (Nagrak, Kebonpedes, and Caringin) and 14.89% is in the southern sub-district area (Simpenan, Warung Kiara, Nyalindung, Lengkong, Cibitung, Tegal Buleud and Cidolog). Quadrant 3 is 10.64% of the northern sub-district area (Cireunghas, Cibadak, Kabandungan, Cicurug, Sukalarang, and Gegerbitung) and 19.15% of the southern sub-district area (Pabuaran, Jampangtengah, Cikakak, and Surade). Quadrant 4 is 10.64%, located in the northern sub-districts (Gunungguruh, Cidahu, Kalapanunggal, Parungkuda, and Sukabumi) and 19.15% is in the southern sub-districts (Ciemas, Kalibunder, Cidadap, Palabuhanratu, Cisolok, Jampangkulon, Sagaranten, Purabaya, and Waluran). Quality of life is influenced by nutritional status and disease conditions [8]. The highest prevalence of hypertension was found in the overweight/obese category [7]. Research by Most hypertension patients in primary health care in Cirebon Regency have uncontrolled blood pressure. Apart from lifestyle regarding their nutritional choices, there is also an increase due to anxiety [47].
The public health degree index (PHDI) is determined by three variables: non-mortality index (maternal mortality, infant mortality, and infant mortality), non-morbidity index (hypertension, diabetes, people with mental disorders, pneumonia, HIV, diarrhea, and TB) and nutritional status index (malnutrition < -2 SD and < -3 SD, stunting, over-nutrition, and underweight). The sub-district with the highest PHDI value is Curug Kembar sub-district with 85.29 and the lowest is Tegalbuleud sub-district with 52.57. The highest value is due to the large area, causing each region to focus on different innovations related to reducing mortality and morbidity and improving nutritional status. The results [3] provide the same reason as what happened in Sukabumi Regency, where the imbalance of health facilities between urban and rural areas significantly hampers health services in rural communities.
The public health degree index, non-mortality index, non-morbidity index, and nutritional status index are categorized into 5 categories: very high, high, medium, low and very low. The largest INMO percentage is classified as medium (42.55%), the largest INMB percentage is classified as medium (44.68%), the largest NSI percentage is classified as medium (17%), the largest PHDI percentage is classified as medium (40.43%). The occurrence of health disparities is analysed and caused by the population, the surrounding environment, and policies on the availability of screening and treatment facilities. Ultimately, public health policies and resources dedicated to service delivery should be the focus of efforts to eliminate disparities. In addition, the results [48] explained that health services highlight continuing health care disparities in the United States, especially in the areas of access to health care and quality of care. Although attention to healthcare disparities has increased, sizable knowledge gaps still exist. A better understanding of how cultural, behavioural, and health system factors converge and contribute to unequal access and disparate care is needed.
After categorization, a comparison between variables was then determined to see which sub-districts are in the good and less good categories using a Cartesian diagram where the results of the comparison are classified into 4 quadrants, namely: 1. Both variables are good, 2. Variable 1 is good and variable 2 is less good, 3. Variable 1 is less good and variable 2 is good, 4. Neither variable is good. From the INMO and INMB cartesian diagrams, the southern sub-districts (Ciemas, Cimanggu, Kalibunder, Cidap, Curugkembar, Pelabuhanratu, Cisolok, Sagaranten, Ciracap, and Bantargadung) have the largest value of 21.28% in quadrant 1 (both variables are good). The conclusion is that in most of the southern regions between mortality and morbidity are both low. This means that in the southern regions the number of maternal infant and toddler deaths is less, and the morbidity rate is also less. Therefore, KLO morbidity incidence is low and the community is healthy. In addition, the assumption can be interpreted as the pollution level of the southern region is lower so that the incidence of morbidity is low. Results related to the existence of health disparities also occur in the categories of good, bad, high and moderate, where Alegría et al. [49] provided an explanation that the scientific and public health communities have succeeded in gaining an understanding of why and how certain health disparities exist, but some conditions and populations are still underrepresented. Many interventions continue to be developed and implemented. However, one of the biggest barriers to achieving health equity is that previous efforts have focused on individuals rather than on systems (e.g., health care, social welfare, criminal justice, education, community) that intersect with racial minorities, gender minorities, and rural communities, so there is a need to emphasize systems change.
The INMO and NSI Cartesian diagrams show that sub-districts in the southern region (ciemas, surade, cimanggu, cidadap, pabuaran, palabuhanratu, warungkiara, bantargadung, jampang Tengah, and nyalindung) have the largest value of 21.28% in quadrant 4 (both variables are poor). The poor status is caused by a low level of nutritional status and is seen from the data of high malnutrition, high stunting and high maternal mortality. These poor conditions are certainly influenced by health services and areas that are far from the city center. In addition, regional conditions or a large area with many rural areas, where there are 181 villages and 5 sub-districts from 47 sub-districts in Sukabumi Regency, causing uneven health levels. Findings from Dong et al. [50] reinforce that regional disparities between urban and rural areas and inequalities between institutions and workforces, especially for doctors, still exist and are the cause of different levels of health. Furthermore, several targeted measures including but not limited to increasing income, facilitating transportation conditions, investing more fiscal funds, improving the provision of health care services for rural residents should be fully considered to narrow the resource distribution gap between urban and rural districts and reduce the inequality of health care resource allocation.
The Cartesian diagram of INMB and NSI shows that the southern sub-districts (Pabuaran, Jampang Tengah, Cikakak, and Surade) have the largest value (19.15%) in quadrant 3 (INMB is not good and ISG is good) and 19.15% in quadrant 4 (INMB and ISG are not good) in the southern sub-districts (ciemas, kalibunder, cidadap, palabuhanratu, cisolok, jampang kulon, sagaranten and waluran). In these areas, the level of health is high with low cases of disease (morbidity) but low nutritional status, many of which are malnourished, stunted and undernourished, one of which can be caused by health facilities and services as well as the social and economic culture of the community. Access to health services will be better results according to reference of Yuan et al. [51] where with the gradual increase in population income and continuous improvement of the medical security system, people's demand for better and higher quality medical and health services has increased.
As supported [22], the research services of general interest (SGI) contribute to the objectives of EU countries, as well as being the basis for territorial cohesion and convergence, with a major role in rural and peripheral areas. Gaps in access to these services lead to critical regional disparities, undermining cohesion.
Research findings in Romania showed that the European Pillar of Social Rights states the right of people to access health facilities and services, regardless of geographical residence [52]. Currently, the health system in Romania has several major shortcomings, ranging from the lack of advanced equipment in some hospitals, inadequate medical staff in many hospital units, to the lack of essential medicines needed for the treatment prescribed to the sick. In addition, according to the results of research by Laksono et al. [21], it provides an explanation that one of the indicators to see the quality of health system performance is to look at disparities in health facility utilization.
The results show that over the past few decades, North African countries have significantly improved the economic, social and health conditions of their populations [53]. However, these improvements are not evenly distributed among groups with different neighbourhoods, regions, or income levels. The vastness of the region is one of the reasons why health equity takes a long time. Interestingly, there is a different view from others results [54] that for China, increasing the number of hospitals, doctors, and beds significantly reduced mortality. The distribution of medical resources in eastern, central and western China is uneven. More hospitals, beds, and doctors in the less developed western region can more effectively reduce local mortality. In the central and eastern regions, hospitals, beds, and doctors have no significant impact on local mortality rates. According to Miller and Vasan [55] that people living in the rural South of South America have higher morbidity and mortality rates compared to their counterparts in urban and other rural areas.
The findings of this research on regional disparities in public health, particularly a sub-district level analysis for health planning development of Sukabumi Regency, Indonesia will greatly assist the sustainable development plan for health in the Sukabumi Regency government area for planning activity programs in 2026-2030.
The community health degree index was determined by 3 variables, i.e., the non-mortality index (death mother, death baby, and death toddler), the non-morbidity index (Hypertension, Diabetes, People with Mental Disorders, Pneumonia, HIV, Diarrhea, and TB) and nutritional status index (malnutrition < -2 SD and < -3 SD, stunting, overnutrition, and Chronic Energy Deficiency). The highest sub-district with PHDI score is Curugkembar sub-district at 85.29 and the lowest is Tegalbuleud sub-district at 52.57. The public health degree index, non-mortality index, non-morbidity index, and nutritional status index are categorized into 5 categories (very high, high, moderate, low, and very low). The largest percentage of INMO is classified as moderate at 42.55%, the largest percentage of INMB is classified as moderate at 44.68%, the largest percentage of NSI is classified as moderate at 17%, the largest percentage of PHDI is classified as moderate at 40.43%.
The evaluation of the public health degree index in Sukabumi Regency aimed to assess and map the success of health development, providing valuable insights for regional policymaking. This study employed four index dimensions for evaluation: the non-mortality index (INMO), the non-morbidity index (INMB), the nutritional status index (NSI), and the public health degree index (PHDI). Results indicated that most sub-districts in the Sukabumi area fall into the medium category for public health, with scores between 36.2 and 44.7. Notable disparities in public health existed between the southern and northern regions, with the south generally exhibiting higher index scores.
To enhance public health and contribute to regional development, several actions can be undertaken. These include improving cross-sector coordination to elevate community health status, increasing health human resources through training, and upgrading facilities and infrastructure to address health issues. Lastly, strengthening health promotion efforts to prevent morbidity and mortality is also essential.
[1] Windhani, K., Purwaningsih, Y., Mulyaningsih, T., Samudro, B.R., et al. (2023). Human capital and regional economic growth in Indonesia: A spatial analysis approach. Indonesian Journal of Geography, 55(3): 473-487. https://doi.org/10.22146/ijg.88241
[2] Koch, U., Stout, S., Landon, B.E., Phillips, R.S. (2016). From healthcare to health: A proposed pathway to population health. Healthcare, 4: 291-297. https://doi.org/10.1016/j.hjdsi.2016.06.007
[3] Regif, S.Y., Nasution, F.A., Pattipeilohy, A., Naif, Y.I., et al. (2023). Revitalizing rural healthcare: A case study of village maternity cottages in Indonesia. International Journal of Sustainable Development and Planning, 18(10): 3309-3316. https://doi.org/10.18280/ijsdp.181030
[4] Hasyim, A.W., Sukojo, B.M., Fatahillah, E.R., Anggraini, I.A. (2025). Assessing the impact of population density and land use on land surface temperature for sustainable urban planning in Malang City, Indonesia. International Journal of Sustainable Development and Planning, 20(5): 2179-2191. https://doi.org/10.18280/ijsdp.200533
[5] Ayu, K., Achjar, H., Gama, K., Lestari, A.S., Sudiantara, K. (2024). Empowering families intervention and elderly groups to reduce the anxiety levels of elderly with diabetes mellitus in Indonesia. Journal of Public Health and Development, 22(2): 107-118. https://doi.org/10.55131/jphd/2024/220209
[6] Fumagalli, E., Pinna Pintor, M., Suhrcke, M. (2024). The impact of health on economic growth: A narrative literature review. Health Policy, 143: 105039. https://doi.org/10.1016/j.healthpol.2024.105039
[7] Rabha, F., Begum, G. (2022). Hypertension: Is it a concern only among the overweight and obese Garo women of Kamrup district, Assam? Journal of Public Health and Development, 20(3): 194-208. https://doi.org/10.55131/jphd/2022/200316
[8] Wongnoy, K., Juwa, S., Srisookkum, T. (2023). Health literacy, health behavior, social support and quality of life among socially dependent elderly people, in Phayao Province, Thailand. Journal of Public Health and Development, 21(2): 189-200. https://doi.org/10.55131/jphd/2023/210216
[9] Fudge, M., Ogier, E., Alexander, K.A. (2021). Emerging functions of the wellbeing concept in regional development scholarship: A review. Environmental Science and Policy, 115: 143-150. https://doi.org/10.1016/j.envsci.2020.10.005
[10] Liu, T., Yang, S., Peng, R., Huang, D. (2022). A geographically weighted regression model for health improvement: Insights from the extension of life expectancy in China. Applied Sciences, 11(5). https://doi.org/10.3390/app11052022
[11] Rigg, J. (2024). The Sustainable Development Goals (SDGS). https://doi.org/10.4324/9780429282348-52
[12] Mardiana, Kartini, A., Sutiningsih, D., Suroto (2024). Nutritional status of young athletes in Central Java, Indonesia. Kemas, 20(2): 252-259. https://doi.org/10.15294/kemas.v20i2.49619
[13] The Health Research and Development Agency. (2020). Anthology of health development performance in Indonesia.
[14] Fauzi, A., Oxtavianus, A. (2014). Pengukuran Pembangunan Berkelanjutan di Indonesia. Jurnal Sosial dan Pembangunan, 30(1): 42-55. https://doi.org/10.29313/mimbar.v30i1.445
[15] Ministry of Health of the Republic of Indonesia. (2022). Results of the 2022 Indonesian Nutritional Status Survey (SSGI). Kemenkes, pp. 99.
[16] Muflih, M., Widaryanti, R., Erwanto, R. (2024). Identifying malnutrition risks in vulnerable groups is key to complementary therapy in health crises. Jurnal Kesahatan Masyarakat, 20(2): 269-279. https://doi.org/10.15294/ kemas.v2
[17] Ministry of Health of the Republic of Indonesia. (2019). Profil kesehatan Indonesia 2019.
[18] The West Java Provincial Health. (2022). West Java Health Profile 2022.
[19] Ministry of Health of the Republic of Indonesia. (2023). Transformasi Kesehatan Mewujudkan Masyarakat Indonesia Sehat dan Unggul.
[20] Central Bureau of Statistics. (2022). Sukabumi Regency in Figures 2022.
[21] Laksono, A.D., Wulandari, R.D., Soedirham, O. (2019). Regional disparities of health center utilization in rural Indonesia. Malaysian Journal of Public Health Medicine, 19(1): 158-166. https://doi.org/10.37268/mjphm/vol.19/no.1/art.48
[22] Franco, P., da Costa, E.M. (2022). Regional disparities in health services provision in the European Union. When territory matters. Finisterra, 57(120): 45-71. https://doi.org/10.18055/Finis2699
[23] Li, H., Wang, R., Wang, H. (2025). Regional disparities and influencing factors of health production efficiency: Evidence from China. BMC Public Health, 25(1): 2406. https://doi.org/10.1186/s12889-025-23537-y
[24] Rahmi, N., Putera, A. (2019). Welfare, government health sector expenditure and life expectancy in Aceh Province: A panel data approach. Jurnal Ekonomi Pembangunan, 17(1): 31-37. https://doi.org/10.29259/jep.v17i1.8946
[25] Andini, P., Herrhyanto, N., Suherman, M. (2017). Multivariate geographically weighted regression application using MATLAB software. Jurnal EurekaMatika, 5(1): 97-105. https://doi.org/10.17509/jem.v5i1.10311
[26] Ningsih PNP, Jayanegara K., Kencana Ipen. (2013). Analysis of the public health status of Bali Province using the general structured component analysis (GSCA) method. E-Jurnal Mat, 2(2): 54-58. https://doi.org/10.24843/mtk.2013.v02.i02.p039
[27] Eguvbe, A.O., Ologbo, T.O., Ofili, U.B., Oghenekaro, E.A. (2024). Elevated lipoprotein (a) levels in hypertensive patients in southern part of Nigeria. Journal of Public Health and Development, 22(2): 239-249. https://doi.org/10.55131/jphd/2024/220219
[28] Harismayanti., Syukur, S.B. (2021). Analysis of chronic energy deficiency in pregnant women in the working area of Puskesmas Telaga Biru. Media Publikasi Promosi Kesehatan Indonesia, 4(2): 162-170. https://doi.org/10.56338/mppki.v4i2.1491
[29] Mulianisaa, R., Tunggal, T., Suhrawardi, S. (2022). Literature study of the relationship between Anemia and chronic energy deficiency with the incidence of low weight birth. Jurnal Kebidanan Bestari, 5(2): 149-157. https://doi.org/10.31964/jkb.v5i2.81
[30] Kulsum, U., Wulandari, D.A. (2022). Efforts to reduce the incidence of KEK in pregnant women through health education. Jurnal Pengemas Kesehatan, 1(1): 27-30. https://doi.org/10.52299/jpk.v1i01.6
[31] Simbolon, D., Rahmadi, A., Jumiyati, J., Sutrio, S. (2022). Nutrition assistance for pregnant women with chronic energy deficiency and anemia to increase nutritional intake. Jurnal Gizi Klinik Indonesia, 18(3): 136-144. https://doi.org/10.22146/ijcn.65675
[32] Nardo, M., Saisana, M., Saltelli, A., Tarantola, S., Hoffman, A., Giovannini, E. (2005). Handbook on Constructing Composite Indicators: Methodology and User Guide. https://doi.org/10.1787/9789264043466-en
[33] Fauzi, A. (2019). Technique Analysis Sustainability. Gramedia Main Library Jakarta.
[34] Rahma, H., Fauzi, A., Juanda, B., Widjojanto, B. (2019). Development of a composite measure of regional sustainable development in Indonesia. Sustainability, 11: 5861. https://doi.org/10.3390/su11205861
[35] Fauzi, A., Oxtavianus, A. (2014). Measuring sustainable development in Indonesia. MIMBAR, Jurnal Sosial dan Pembangunan, 30(1): 42-52. https://doi.org/10.29313/mimbar.v30i1.445
[36] Faradisa, R., Afifah, U.N. (2020). Infrastructure development composite index of provinces in Indonesia. Jurnal Ekonomi Dan Pembangunan Indonesia, 20(1): 33-55. https://doi.org/10.21002/jepi.2020.03
[37] Afandi, Y.P., Muftiadi, A. (2023). Prioritizing regional development using composite index in West Java. Jurnal Pembangunan Wilayah Dan Kota, 19(3): 326-335. https://doi.org/10.14710/pwk.v19i3.43267
[38] Silaen, M., Rahayu, S., Aryanti, I., Prasetyo, A., et al. (2025). Health and socio-economic factors as determinants of antenatal care service access in Indonesia. Clinical Epidemiology and Global Health, 33: 102010. https://doi.org/10.1016/j.cegh.2025.102010
[39] Farhan, A.A., Kubio, C. (2025). Unveiling neonatal mortality inequities in Ghana: A geospatial and temporal analysis of regional disparities, healthcare accessibility, and institutional gaps to drive targeted interventions. Pediatrics & Neonatology. https://doi.org/10.1016/j.pedneo.2025.04.004
[40] Hailu, B.A. (2025). Trends in cancer incidence and mortality in the United States (1999-2021): A retrospective cohort study of health disparities and regional variations. Journal of the National Medical Association, 117(3): 185-192. https://doi.org/10.1016/j.jnma.2025.04.007
[41] Adachi, T., Takei, Y., Toyama, G., Hori, E., et al. (2025). Regional disparities in 1-month survival following traffic accident-related out-of-hospital cardiac arrest in Japan: A nationwide observational study. American Journal of Emergency Medicine, 96: 249-255. https://doi.org/10.1016/j.ajem.2025.07.002
[42] Basri, H., Hadju, V. (2020). Breastfeeding and complementary food on nutritional status infants in Indonesia. Enfermeria Clinica, 30: 191-195. https://doi.org/10.1016/j.enfcli.2019.10.067
[43] Sitaresmi, T., Hairmansis, A., Widyastuti, Y., Rachmawati, Susanto, U., et al. (2023). Advances in the development of rice varieties with better nutritional quality in Indonesia. Journal of Agriculture and Food Research, 12: 100602. https://doi.org/10.1016/j.jafr.2023.100602
[44] Situmorang, H.E., Sweet, L., Graham, K., Grant, J. (2022). Health care provider’s perceptions of factors that influence infant mortality in Papua Indonesia: A qualitative study. Women and Birth, 35(2): 201-209. https://doi.org/10.1016/j.wombi.2021.04.007
[45] Mboi, N., Syailendrawati, R., Ostroff, S.M., Elyazar, I.R.F., et al. (2022). The state of health in Indonesia’s provinces, 1990-2019: A systematic analysis for the global burden of disease study 2019. The Lancet Global Health, 10(11): e1632-e1645. https://doi.org/10.1016/S2214-109X(22)00371-0
[46] Mardani, R.A.D., Wu, W., Hajri, Z., Thoyibah, Z., Yolanda, H., Huang, H. (2024). Effect of a nutritional education program on children's undernutrition in Indonesia: A randomized controlled trial. Journal of Pediatric Health Care, 38(4): 552-563. https://doi.org/10.1016/j.pedhc.2024.02.006
[47] Pratamawati, T.M., Zein, A.F.M.Z., Khasanah, U., Nauphar, D., et al. (2025). Clinical profile of hypertension patients in primary health care in Cirebon Regency, Indonesia. Endocrine and Metabolic Science, 18: 100232. https://doi.org/10.1016/j.endmts.2025.100232
[48] Wasserman, J., Palmer, R.C., Gomez, M.M., Berzon, R., et al. (2019). Advancing health services research to eliminate health care disparities. American Journal of Public Health, 109: 564-569. https://doi.org/10.2105/AJPH.2018.304922
[49] Alegría, M., Araneta, M.R., Rivers, B. (2019). The national advisory council on minority health and health disparities reflection. American Journal of Public Health, 109: S14-S15. https://doi.org/10.2105/AJPH.2019.304961
[50] Dong, E., Xu, J., Sun, X., Xu, T., et al. (2021). Differences in regional distribution and inequality in health-resource allocation on institutions, beds, and workforce: A longitudinal study in China. Archives of Public Health, 79: 78. https://doi.org/10.1186/s13690-021-00597-1
[51] Yuan, L., Cao, J., Wang, D., Yu, D., et al. (2023). Regional disparities and influencing factors of high-quality medical resources distribution in China. International Journal for Equity in Health, 22: 8. https://doi.org/10.1186/s12939-023-01825-6
[52] Cristache, S.E., Marin, E., Șerban, D. (2019). Regional disparities in the public health care system: Evidence from Romania. Proceedings of the International Conference on Applied Statistics, 1: 203-215. https://doi.org/10.2478/icas-2019-0018
[53] Boutayeb, A., Helmert, U. (2011). Social inequalities, regional disparities and health inequity in North African countries. International Journal for Equity in Health, 10: 23. https://doi.org/10.1186/1475-9276-10-23
[54] Chai, K.C., Zhang, Y. Bin, Chang, K.C. (2020). Regional disparity of medical resources and its effect on mortality rates in China. Frontiers in Public Health, 8: 8. https://doi.org/10.3389/fpubh.2020.00008
[55] Miller, C.E., Vasan, R.S. (2017). The southern rural health and mortality penalty: A review of regional health inequities in the United States. Social Science & Medicine, 176(1): 100-106. https://doi.org/10.1016/j.socscimed.2020.113443