Yasser Wahyuddin*![]() | Kayla Rizki Endlessia
| Kayla Rizki Endlessia![]() | Ardelia Rahma Putri
| Ardelia Rahma Putri![]() | Shofiyatul Qoyimah
| Shofiyatul Qoyimah![]()
© 2025 The authors. This article is published by IIETA and is licensed under the CC BY 4.0 license (http://creativecommons.org/licenses/by/4.0/).
OPEN ACCESS
The concept of chrono-urbanism, particularly embodied in Carlos Moreno’s ‘15-Minute City’ model, advocates for urban environments where residents can fulfill their daily needs within a 15-minute walk from their homes. Achieving such short-distance mobility necessitates the integration of micromobility solutions—small vehicles powered either electrically or manually. This study spatially analyzes the residential zones of Banyumanik District and Central Semarang District in Semarang City, Indonesia, utilizing GIS-based methods to assess the feasibility of adopting the 15-Minute City framework in these areas. The selected districts represent both a central urban residential area and a secondary urban center. Employing techniques such as Kernel Density estimation, GIS Closest Facility, GIS Isochrones, and GIS Urban Network Analysis, the research quantifies the accessibility of public facilities within a 15-minute radius. Findings indicate that both districts are characterized by low-density residential development and a limited concentration of public facilities within the target proximity. From the perspective of the 15-Minute City concept, Semarang City faces morphological challenges, as the prevalence of expansive landed housing undermines the necessary clustering of services and amenities. Consequently, the study underscores the importance of reinforcing policies that promote mixed-use zoning and the development of vertical housing within residential areas as crucial measures to counteract urban sprawl and enhance the efficiency of public facility provision.
chrono-urbanism, 15-minute, Semarang City, Kernel Density, GIS-closest facility, GIS-Isochrones, GIS-UNA
The concept of the 15-Minute City, developed by Carlos Moreno, offers an inspiring model for urban living that prioritizes people over cars [1]. It envisions neighborhoods where everyone can reach essential services—like workplaces, schools, healthcare, shops, and recreational areas—within just a 15-minute walk or ride using small, sustainable vehicles. This approach encourages local living, lessens the need for long commutes, and promotes healthier, more equitable, and greener cities. However, although the idea is appealing, applying it directly to non-European cities such as those in Indonesia demands thoughtful adaptation and a keen understanding of local circumstances.
Unlike a well developed and completed urbanized European cities, urban development in Indonesia has followed a different path. Rather than being shaped around walkability and compact, mixed-use districts, Indonesian cities have largely expanded with low-rise, spread-out housing, significant urban sprawl, and a heavy reliance on motorcycles and cars as the main modes of transportation [2]. This pattern is especially visible in fast-growing cities like Semarang, Surabaya, and the vast sprawl of Jakarta's metropolitan area. The prevailing approach of developing large, single-purpose housing estates—often gated and isolated from the rest of the city—has led to fragmented urban areas where homes, jobs, and services are physically separated. As a result, residents frequently have to travel considerable distances to reach workplaces and amenities [3, 4].
As a result, bringing the 15-Minute City concept to Indonesian cities isn't as simple as replicating a European model. True implementation demands careful adaptation that deeply considers Indonesia's unique urban patterns, economic realities, cultural traditions, and systems of local governance. Rather than aspiring to the rigid geographic proximity often implied by the 15-minute metric in walking terms [5], Indonesian cities must reframe the concept based on functional proximity, combining physical, social, and digital accessibility.
In particular, this locally adapted vision recognizes that major Indonesian cities have traditional neighborhoods known as kampung, which serve as the historical core of urban development. These kampungs provide a valuable—though often underappreciated—foundation for local living. Despite their informal origins, many kampungs already demonstrate central elements of the 15-Minute City: walkable areas, diverse land uses, strong community bonds, and easy access to essential services [6]. Rather than replacing these neighborhoods through top-down modernization or large-scale vertical housing projects, urban policies should focus on upgrading and linking kampungs to the wider city. By doing so, planners can strengthen and expand the existing patterns of proximity-based living that function effectively at a neighborhood level, using a locally informed, bottom-up approach [7].
In expansive residential developments, especially those comprised mainly of private landed homes, it's crucial to implement retrofitting strategies. One effective approach is to create localized service hubs-compact groupings of shops, clinics, schools, public spaces, and co-working areas located within or near housing clusters. These hubs would allow residents to conveniently meet most daily needs close to home, reducing dependence on long commutes or distant central services. Encouraging this transformation through more flexible zoning laws would further help blend different functions into residential neighborhoods. However, with the mix of kampung and a more contemporary larger housing development and market mechanism property would provide a dynamic urban structure in Indonesia [8].
Mobility must also be reimagined within this context. In cities where walking culture is limited due to poor pedestrian infrastructure and tropical climate conditions, the 15-minute radius could be realistically extended through active and informal modes of transport, such as cycling, electric bikes, and motorcycle taxis. This is not a compromise but a pragmatic reflection of Indonesia’s existing transport ecosystem [9].
Transitioning toward the 15-Minute City concept in Indonesia requires a gradual and flexible approach. Efforts must address the country's varied urban environments, from dense kampung neighborhoods and suburban outskirts to transit-oriented developments. These challenges provide valuable opportunities to test the model, enabling lessons to be learned from both achievements and setbacks before implementing it on a broader scale. Success should be measured not just by how quickly people can reach destinations, but also by considering factors such as social equity, environmental health, accessibility, and community well-being.
At this point, numerous urban planning scholars in Indonesia have recognized Carlos Moreno’s 15-Minute City concept as a significant shift toward more decentralized, environmentally friendly, and spatially just urban governance [10].
Yet, in Asia—and particularly Indonesia—there is a tendency to focus intently on these urban transformation goals. The 15-Minute City should not be considered a one-size-fits-all solution, but rather a flexible idea that adapts to the unique social, spatial, and cultural conditions of each location. In Indonesia, this model has been reimagined as the 15-Minute City, representing a significant step toward creating more livable, inclusive, and resilient urban environments that respond thoughtfully to local needs and characteristics [11, 12].
In the Indonesian context, realizing the 15-Minute City calls for a distinctly local adaptation—one that acknowledges the country's informal urban patterns, builds upon established community frameworks, and reimagines proximity in terms of practical accessibility, social equity, and quality of urban life [13]. By adopting this tailored approach, Indonesian cities can progress toward more sustainable, resilient, and inclusive futures, capturing the essence-if not the exact form-of the original 15-Minute City model. To date, much of the research on this concept has relied on simplified analog methods, such as drawing a circle around a central point to represent a reachable area within a set time, without accurately reflecting the complexity of real urban environments. This study addresses that gap by harnessing the power of Geographic Information Systems (GIS) to deliver a detailed analysis of spatial relationships within Indonesian cities.
GIS is a technological tool designed to store, analyze, and share geographic data, offering important advantages for urban planning. It enables more precise mapping of land use and infrastructure, especially in assessing the reach and coverage of public facilities, thus supporting better-informed decision-making processes [14].
Carlos Moreno's 15-Minute City concept represents a significant evolution in urban thinking by prioritizing the human scale, temporal accessibility, and functional diversity within walkable or cyclable neighborhoods. As urbanization accelerates in the Global South, especially in Indonesia, the potential for a proximity-based city model raises critical questions: Can a concept rooted in Europe’s dense, historic cities translate effectively to Indonesia's more sprawling, car-dependent, and culturally diverse urban landscapes?
To address this, we must explore the theoretical foundations of the 15-Minute City and critically assess its adaptation within the Indonesian context. The concept is built upon four central principles: (1) ensuring that essential services—such as education, healthcare, commerce, and recreation-are accessible within a 15-minute radius for all residents; (2) fostering mixed-use neighborhoods that integrate housing, business, and community services; (3) promoting a compact urban form to make proximity practical; and (4) supporting vibrant local communities.
While originally developed in Europe, the 15-Minute City embodies universal values—such as proximity, local living, and community vitality—that resonate with Indonesian urbanism. However, successful implementation in Indonesia requires careful contextualization. This involves acknowledging local urban forms, leveraging the strengths of informal settlements, reforming land-use policies, and empowering community participation.
This study selected Banyumanik District and Central Semarang District as focus areas due to their dense, compact characteristics, making them promising candidates for applying the 15-Minute City concept. Banyumanik District, located in the southern part of Semarang City, acts as a sub-center for urban development and is largely shaped by residential neighborhoods, educational facilities, commercial centers, and public services. In contrast, Central Semarang District forms the heart of the city, hosting a concentration of economic, trade, and service activities. This area features a wide range of amenities, such as shopping malls, hotels, office buildings, and commercial hubs. The functional diversity, high mobility, and solid infrastructure present in both districts make them ideal for studying short-distance, sustainable urban planning. The research aims to determine how well the urban zones of Semarang-considering their low-density, landed housing, and the spread of public services—align with the geometric principles of the 15-Minute City model.
2.1 Urban morphology: Compact city vs sprawl
Urban morphology examines the physical layout and structure of cities, typically falling along a spectrum between the compact city and urban sprawl. The compact city model promotes higher density, mixed land uses, and efficient public transit to achieve sustainability and resource conservation. In contrast, urban sprawl is marked by low-density development, single-use zoning, and a heavy dependence on private vehicles.
Many Indonesian cities exhibit symptoms of urban sprawl due to a combination of factors including rapid population and economic growth, limited land availability in city centers, and the expansion of infrastructure like roads. This leads to development pushing outwards into surrounding peri-urban areas, often resulting in fragmented, unplanned, and inefficient land use patterns.
Debates over sprawl versus compact development persist as key concerns in sustainable urban planning. Compact cities, by increasing density, can foster energy savings and livable urban environments; meanwhile, sprawl can address the demand for green spaces and accommodate family needs. However, the benefits and drawbacks of each strategy depend greatly on local circumstances and the phase of urbanization. In developed nations with slower population growth and limited land for new construction, compact models often deliver intended outcomes. Yet in rapidly urbanizing, developing nations, the situation diverges: swelling demand for housing and minimal building demolition rates mean that compact strategies can inflate land prices, fueling the rise of informal settlements. As land becomes scarce and expensive, low-income groups are priced out, and even governments struggle to secure land for social housing or urban interventions. This dynamic often results in unmanaged sprawl, undermining the very goals of sustainable development.
The morphological features of a compact city-greater density and mixed-use environments—naturally support the 15-Minute City vision by facilitating walkability and ready access to amenities. On the other hand, sprawling, low-density cities with segregated land uses and car-centric designs pose significant obstacles to this concept. Sprawl's physical separation of functions impedes walkability, making it difficult for residents to reach everyday services within a 15-minute radius. This, in turn, increases reliance on private vehicles, exacerbating traffic congestion and air pollution, and hindering the creation of accessible, interconnected neighborhoods.
Indonesian cities face notable challenges in realizing the 15-Minute City due to prevailing patterns of urban sprawl. The ambition to make daily needs accessible within 15 minutes—whether by foot, bicycle, or public transit-is complicated by dispersed urban forms. Despite these hurdles, urban planners across Indonesia continue to pursue more livable cities, considering the 15-Minute City model as a potential path for transformation, even as they navigate the entrenched legacy of detached housing and informal settlements.
The rise of chrono-urbanism-a concept centered on urban livability and sustainability-raises important questions for Indonesian cities: To what extent can their existing urban morphology accommodate the pressures and demands of sustainable urban form and ecological urbanism?
2.2 Chrono urbanism: 15-Minute City concept
While urbanism has traditionally centered on spatial considerations-such as the layout of streets, zoning, land use, and urban form—contemporary cities demand an expanded perspective that takes time into account. The growing complexity of urban environments and the evolving pace of daily life highlight the importance of time as a key dimension in city planning. This is where chrono-urbanism comes into play: an approach that prioritizes not just where things are, but how long it takes to access them [15].
Unlike conventional urban planning, which measures the physical distance between people and city services, chrono-urbanism focuses on travel time and the temporal inequalities embedded in urban systems. Considering time allows for a deeper understanding of urban justice, accessibility, and the synchronization of daily rhythms within city life.
Derived from the Greek word "chronos" (meaning time) and "urbanism," chrono-urbanism emerged in the early 2000s through the scholarship of French urban theorists and geographers, especially Luc Gwiazdzinski. Its relevance gained wider recognition with Carlos Moreno's development of the 15-Minute City concept, positioning time (chrono) [16] as a critical factor in the quest for more just, efficient, and livable urban environments.
Chrono-urbanism is not merely about speed but about equity of access through time. It aims to shift urban planning from spatial-only models (e.g., Euclidean distance) to temporal models (travel time, rhythm of life), Acknowledge how different social groups experience time poverty or temporal exclusion, promote policies that synchronize urban services with daily life rhythms (working hours, caregiving, commuting, etc.) [17].
Chrono-urbanism aligns closely with several foundational urban theories, such as Time Geography, which examines how individual movement is shaped by both spatial and temporal constraints. It also relates to the Right to the City framework, emphasizing the democratization of both time and space and recognizing that temporal justice is a key component of spatial justice.
At a deeper level, chrono-urbanism resonates with the principles of Everyday Urbanism, which centers on the routines of daily life and their spatial-temporal dimensions. This approach introduces the concept of urban rhythms-patterns that may be cyclical, linear, or irregular—that help define our experience of city life.
This study utilizes a spatial quantitative analysis framework, drawing on GIS [18], to examine how the 15-Minute City concept [19] could be implemented in selected urban areas of Banyumanik and Semarang Tengah within the City of Semarang.
The main goal is to evaluate the spatial distribution, accessibility, and interconnectedness of essential urban services and residential areas within a 10-minute travel window. To establish a robust methodological foundation, four principal spatial analysis techniques were employed:
By integrating these analytical tools, the study provides a nuanced, data-driven assessment of spatial fairness, time-based accessibility, and the effectiveness of urban design in the context of the 15-Minute City model. The findings offer practical insights for developing more sustainable, people-oriented urban spaces in Indonesian cities, especially those with polycentric patterns and a prevalence of single-family homes.
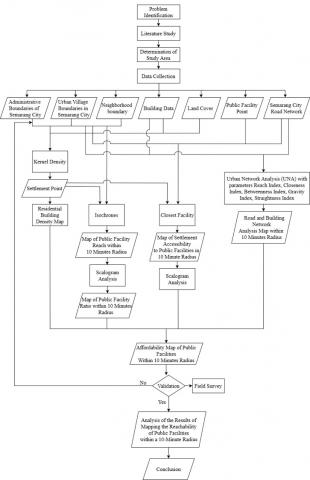
As depicted in Figure 1, the research process began with the identification of core challenges, a comprehensive literature review, and the careful selection of study areas based on data availability and relevance. The subsequent phase focused on gathering data through formal requests to local government bodies and digital mapping techniques.
Finally, the four principal methods—Kernel Density Estimation, Isochrone Mapping, Closest Facility Analysis, and Urban Network Analysis—were applied to rigorously evaluate how effectively public facilities in the study areas align with the principles of the 15-Minute City.
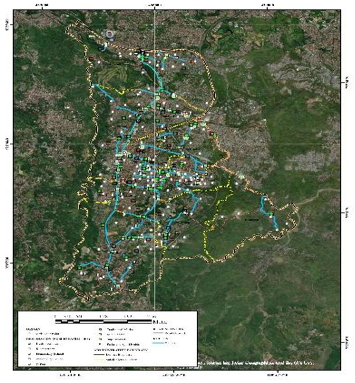
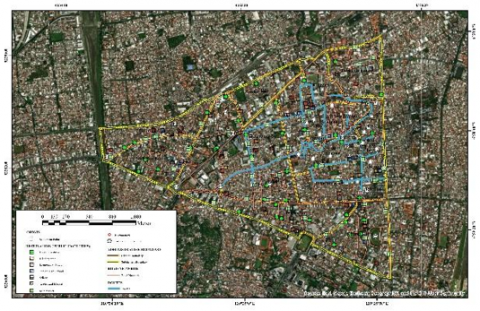
The data utilized throughout this study were sourced from multiple avenues. Frequent coordination and meetings with the Urban Planning Board Agencies of Semarang City facilitated efficient data collection. Additional information was gathered through OpenStreetMap and the Semarang City geoportal, supplemented by on-screen digitization using Google Earth Pro. For data processing, both ArcMap and QGIS software were employed. Table 1 below summarizes the research data.
Figure 1. Methodological framework
Table 1. Data research
|
Data |
Data Type |
Year |
Data Source |
|
Administrative Boundary of Districts in Semarang City |
Vector |
2021 |
Semarang City Spatial Planning Office |
|
Subdistrict Boundary in Semarang City |
Vector |
2021 |
Semarang City Geoportal |
|
Neighborhood boundary |
Vector |
2024 |
Subdistricts Office |
|
Land Cover |
Vector |
2021 |
Semarang City Spatial Planning Office |
|
Building Data |
Vector |
2024 |
Open Street Map |
|
Semarang City Road Network |
Vector |
2024 |
Semarang City Public Works Department |
|
Settlement Point |
Vector |
2024 |
on-screen digitizing |
|
Public Facility Point |
Vector |
2024 |
Google Earth Pro and on-screen digitizing |
This study categorizes public facility data points into six types: education, health, trade, office, park, and sports field facilities. Each type includes specific subcategories; for example, educational facilities cover kindergartens, elementary schools, and junior high schools, while health facilities include pharmacies, clinics, and health centers. Trade facilities consist of supermarkets, minimarkets, and traditional markets. For the offices, we appointed the subdistrict administrative office as the representative.
As for the methodology, it is important to underline that by using QGIS as a prominent tool in this paper, some problems were encountered during the analysis process. This research uses QGIS, an open source tool; therefore, its formal licensing cannot be guaranteed. However, the biggest challenge arises from data availability. There is a lack of coordinate point shapefiles provided by the authorized Spatial Planning Agency, and there is no official geospatial data on population density per square kilometer. This requires manual data collection, so we are aware of the limitations and potential errors that may arise.
4.1 Residential density analysis
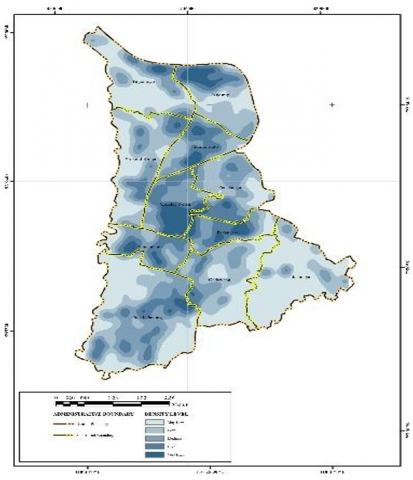
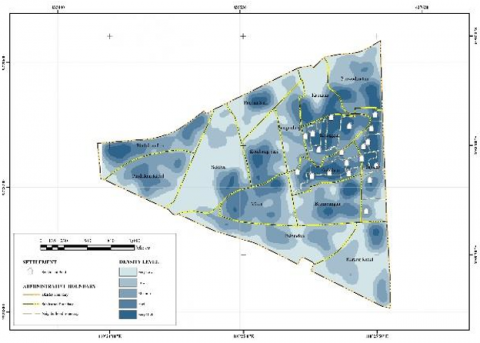
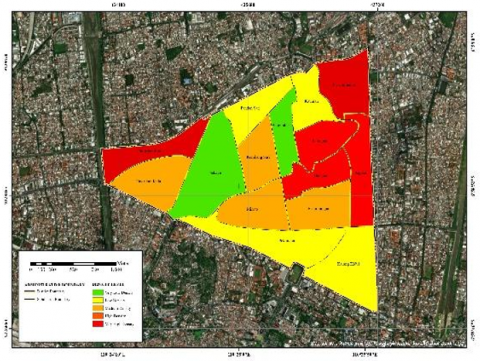
To visualize patterns of residential density, the Kernel Density method was employed to identify clusters of high-density residential buildings across the study area. This method classifies density levels into five distinct categories: very low, low, medium, high, and very high within both Banyumanik and Central Semarang Districts. Figure 2 presents the results of this analysis, highlighting where residential concentration is greatest in each district.
According to the Kernel Density analysis, Padangsari, Srondol Wetan, and Banyumanik Subdistricts have the highest concentrations of residential buildings in Banyumanik District. In Central Semarang District, Gabahan, Jagalan, and Kranggan Subdistricts exhibit the greatest residential density. Once the data is processed and analyzed, building densities are visually represented using color classifications, as illustrated in Figure 3.
(a) Banyumanik District
(b) Central Semarang District
Figure 2. Kernel Density analysiss processing result
(a) Banyumanik District
(b) Central Semarang District
Figure 3. Residential building density map
4.2 Public facilities accessibility
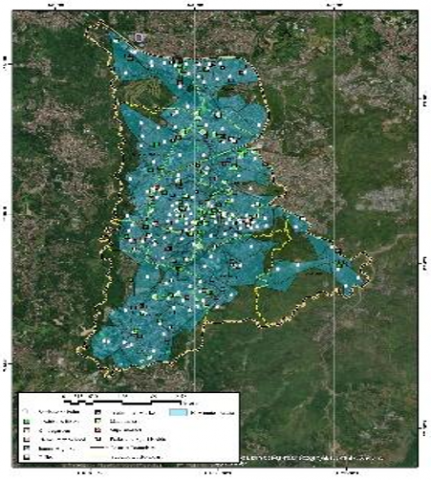
After mapping residential density, the next phase focused on evaluating how accessible public facilities are within the studied districts. To accomplish this, the Isochrones tool in QGIS was applied, utilizing residential and facility location data. In the context of the 15-Minute City concept, residential areas are intentionally linked with essential service centers to reduce walking distances. The city core, in particular, features a blend of land uses and densities, placing various amenities within a short walk. Assessing access to public facilities thus provides key insights into how well these residential areas are served by daily necessities.
Figure 4 shows how easily residents can access public facilities by walking or cycling, measuring micromobility accessibility within each district. Figure 4 presents the processing results from the Isochrones QGIS method for Banyumanik District, analyzing both walking and cycling modes.
Tables 2 and 3 present detailed findings from the Isochrones and Scalogram analyses conducted for Banyumanik and Central Semarang Districts. These assessments evaluate accessibility for both walking and cycling modes, highlighting how easily residents can reach essential services.
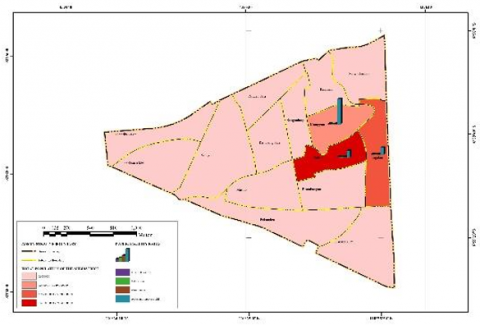
Table 2 and Table 3 indicate that the subdistricts Srondol Wetan, Padangsari, and Pedalangan exhibit higher accessibility to public facilities. These areas feature a combination of residential and other land uses, such as education, health, commerce, and additional public amenities, contributing to greater proximity to facilities. In contrast, Jabungan Subdistrict demonstrates lower accessibility due to more irregular settlement patterns, resulting in reduced population density and increased distances to public facilities. Access to health services, educational institutions, commercial centers, and open green spaces remains limited, requiring residents to travel farther to meet daily needs. Figure 5 depicts the Public Facility Accessibility Ratio map for Banyumanik District. Figure 5 displays the public facility ratio in Banyumanik District, calculated by comparing the number of residents to accessible facilities. While Table 4 and Table 5 display the ratios between population and public facility affordability (by foot) within the study area.
(a) Walking
(b) Cycling
Figure 4. Public facilities accessibility in Banyumanik District
(a) Walking
(b) Cycling
Figure 5. Map of public facility accessibility ratio Banyumanik District
Table 2. Number of public facilities accessed by walking in Banyumanik District
|
Public Amenities |
||||||
|
Subdistrict |
Education Facilities |
Health Facilities |
Commerce |
Parks and Sports Fields |
Office |
Totally |
|
Srondol Wetan |
195 |
174 |
120 |
41 |
11 |
541 |
|
Padangsari |
133 |
67 |
77 |
39 |
11 |
327 |
|
Pedalangan |
74 |
42 |
50 |
18 |
6 |
190 |
Table 3. Number of public facilities accessed by cycling in Banyumanik District
|
Public Amenities |
||||||
|
Subdistrict |
Education Facilities |
Health Facilities |
Commerce |
Parks and Sports Fields |
Office |
Totally |
|
Srondol Wetan |
1035 |
551 |
508 |
317 |
108 |
2519 |
|
Padangsari |
893 |
453 |
474 |
272 |
89 |
2181 |
|
Pedalangan |
570 |
309 |
323 |
165 |
66 |
1433 |
Table 4. Ratio in Banyumanik District (Foot walking)
|
Ratio Between Population and Accessibility of Public Facilities (Walking) |
|||||
|
Subdistrict |
Total Population |
Ratio |
|||
|
Health Facilities |
Education Facilities |
Commerce |
Parks and Sports Fields |
||
|
Srondol Wetan |
21.212 |
1 : 122 |
1 : 108 |
1 : 177 |
1 : 517 |
|
Padangsari |
12.445 |
1 : 186 |
1 : 94 |
1 : 162 |
1 : 319 |
|
Pedalangan |
12.023 |
1: 286 |
1: 162 |
1: 240 |
1: 668 |
Table 5. Ratio in Banyumanik District (Cycling)
|
Ratio Between Population and Accessibility of Public Facilities (Cycling) |
|||||
|
Subdistrict |
Total Population |
Ratio |
|||
|
Health Facilities |
Education Facilities |
Commerce |
Parks and Sports Fields |
||
|
Srondol Wetan |
21.212 |
1 : 38 |
1 : 20 |
1 : 42 |
1 : 67 |
|
Padangsari |
12.445 |
1 : 27 |
1 : 14 |
1 : 26 |
1 : 46 |
|
Pedalangan |
12.023 |
1: 39 |
1: 21 |
1: 37 |
1: 73 |
Table 6. Number of public facilities accessed by walking in Central Semarang District
|
Public Amenities |
||||||
|
Subdistrict |
Education Facilities |
Health Facilities |
Commerce |
Parks and Sports Fields |
Office |
Totally |
|
Gabahan |
106 |
51 |
69 |
7 |
27 |
260 |
|
Jagalan |
108 |
57 |
58 |
5 |
26 |
254 |
Table 7. Number of public facilities accessed by cycling in Central Semarang District
|
Public Amenities |
||||||
|
Subdistrict |
Education Facilities |
Health Facilities |
Commerce |
Parks and Sports Fields |
Office |
Totally |
|
Jagalan |
517 |
321 |
332 |
63 |
110 |
1343 |
|
Gabahan |
430 |
263 |
260 |
54 |
90 |
1097 |
Table 8. The ratio in Central Semarang District (Walking)
|
Ratio Between Population and Accessibility of Public Facilities (Walking) |
|||||
|
Subdistrict |
Total Population |
Ratio |
|||
|
Health Facilities |
Education Facilities |
Commerce |
Parks and Sports Fields |
||
|
Jagalan |
5.320 |
1 : 49 |
1 : 92 |
1 : 1.064 |
1 : 93 |
|
Gabahan |
7.164 |
1: 68 |
1: 104 |
1: 1.032 |
1: 140 |
Table 9. Ratio in Central Semarang District (Cycling)
|
Ratio Between Population and Accessibility of Public Facilities (Cycling) |
|||||
|
Subdistrict |
Total Population |
Ratio |
|||
|
Health Facilities |
Education Facilities |
Commerce |
Parks and Sports Fields |
||
|
Jagalan |
5.320 |
1 : 17 |
1 : 10 |
1 : 16 |
1 : 84 |
|
Gabahan |
7.164 |
1: 263 |
1: 17 |
1: 27 |
1: 132 |
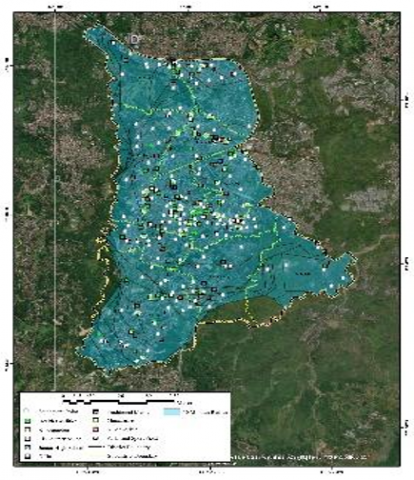
Tables 4 and 5 show that Padangsari, Srondol Wetan, and Pedalangan have the highest ratios due to integrated land use, allowing quick access, while Kranggan has the lowest due to fewer and more distant facilities. In Central Semarang District, Tables 6 and 7 indicate Gabahan and Jagalan offer the best facility access—especially on foot or by bike—thanks to numerous, well-distributed facilities and mixed land use. Figure 6 highlights the analysis for walking mode.
The ratio for Central Semarang District, shown in Tables 8 and 9, indicates that Gabahan and Jagalan Subdistricts have the highest scores for both walking and cycling. Due to good accessibility, dense housing, and well-distributed public facilities, residents can reach these facilities quickly. Figure 7 shows the ratio map results.
(a) Walking
(b) Cycling
Figure 6. Isochrones Central Semarang
(a) Walking
(b) Cycling
Figure 7. Map of public facility accessibility ratio in Central Semarang District
4.3 Distance and travel time
To accurately assess distance and travel time in accordance with Chrono-urbanism principles, this study employed the Nearest Facility Analysis within GIS tools. This approach calculates the shortest routes between residential areas (origins) and public facilities (destinations) in both Banyumanik District and Central Semarang District, enabling a detailed evaluation of accessibility to key amenities within a 10-minute travel window. The analysis specifically considers micromobility options such as bicycles, using an average cycling speed of 15km/h. The findings from this Nearest Facility Analysis are illustrated in Figure 8.
(a) Banyumanik District
(b) Central Semarang District
Figure 8. Closest facility processing result
Table 10. Closest facility in Banyumanik District
|
Closest Facility |
||||||
|
Subdistrict |
Education Facilities |
Health Facilities |
Commerce |
Parks and Sports Fields |
Office |
Totally |
|
Banyumanik |
70 |
59 |
42 |
11 |
7 |
189 |
|
Srondol Wetan |
69 |
51 |
38 |
14 |
4 |
176 |
|
Pedalangan |
41 |
45 |
39 |
9 |
3 |
137 |
Table 11. Closest facility in Central Semarang District
|
Closest Facility |
||||||
|
Subdistrict |
Education Facilities |
Health Facilities |
Commerce |
Parks and Sports Fields |
Office |
Totally |
|
Jagalan |
23 |
12 |
17 |
5 |
6 |
63 |
|
Gabahan |
22 |
14 |
14 |
4 |
6 |
60 |
Based on the analytical outcomes illustrated in Figure 8(a) and the data presented in Table 10, the Banyumanik District demonstrates that Srondol Wetan, Banyumanik, and Pedalangan subdistricts exhibit the highest levels of public facility accessibility as determined by the nearest facility Analysis performed in GIS. The spatial distribution of public facilities within these subdistricts is relatively uniform, attributable to the comprehensive development of the transportation network and equitable allocation of public amenities. Conversely, Tinjomoyo Subdistrict registers the lowest accessibility score. Field observations confirm that a substantial proportion of public facilities in this area are located beyond the residential catchment defined by a 10-minute travel threshold.
For Central Semarang District, as depicted in Figure 8(b) and summarized in Table 11, Gabahan and Jagalan subdistricts possess superior accessibility to public facilities, reflecting well-structured spatial patterns and adequate facility distribution. In contrast, Kranggan Subdistrict demonstrates markedly lower accessibility, with public facilities dispersed irregularly and thus less accessible to residents within the established 10-minute travel radius.
4.4 Urban network: The relationship between buildings and road networks
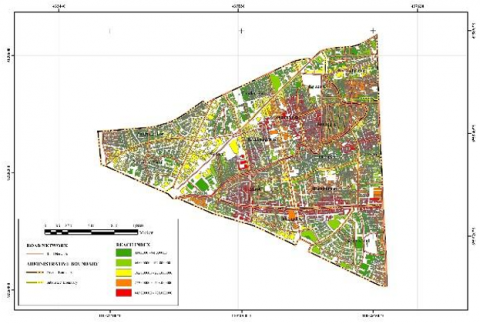
The examination of the interplay between urban edifices and the surrounding road infrastructure was expanded through the application of Urban Network Analysis. This methodological approach facilitates a nuanced assessment of building accessibility by considering both connectivity and the spatial configuration of the road network. Such analysis yields valuable insights into the efficacy of existing transportation systems in accommodating the daily mobility requirements of residents, particularly with regard to achieving essential services within a prescribed travel radius, as exemplified by the 15-Minute City paradigm.
4.4.1 Reachness index analysis
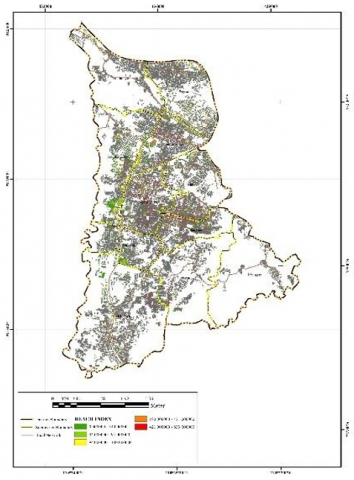
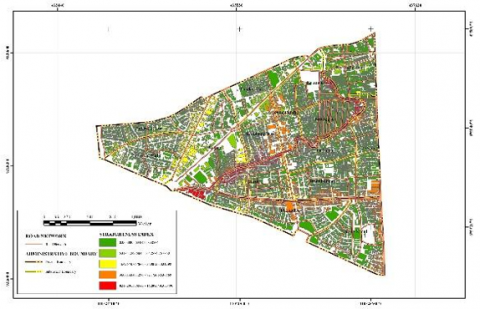
The Reachness Index quantifies accessibility by calculating the number of buildings within a defined time radius using the road network. This index indicates how connected an area is to other locations within a city or region.
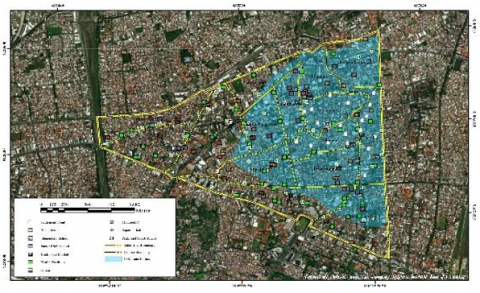
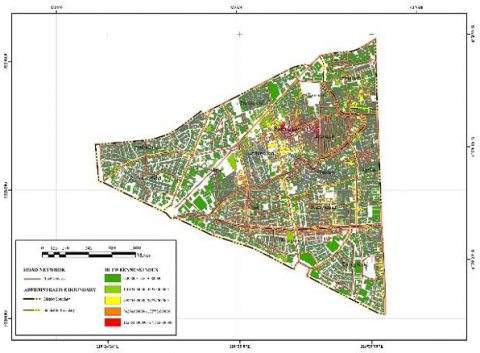
Figure 9 shows that Srondol Wetan, Padangsari, and Sumurboto have the highest accessibility levels in Banyumanik District. These subdistricts feature many areas marked in red and several public facilities, indicating strong connectivity and easy access via the road network.
The reach index analysis for Central Semarang District (Figure 10) shows that Kranggan and Jagalan have the highest accessibility, as highlighted in red on the map. Buildings in these subdistricts are easily reached via the road network, demonstrating strong connectivity.
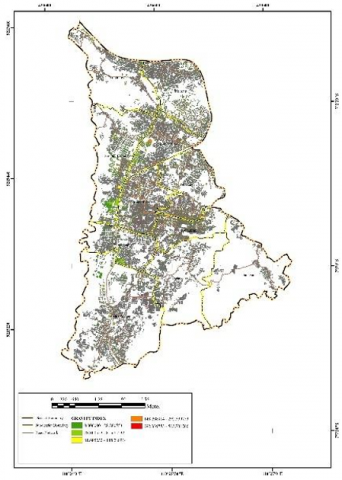
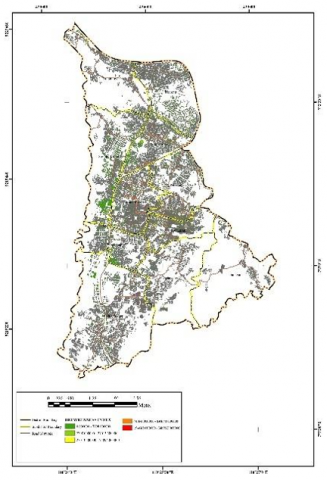
4.4.2 Gravity index analysis
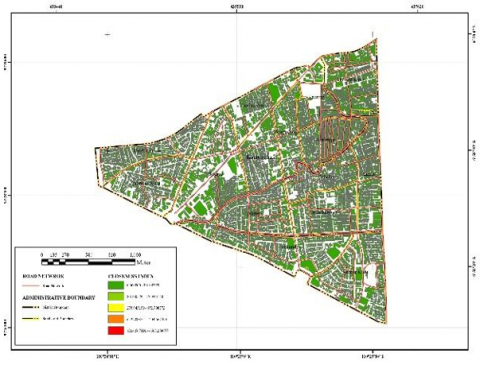
The gravity index measures how central a location is by considering nearby points within a set radius. It evaluates a site's influence on its surroundings using population and distance.
Figure 9. Reachness index map of Banyumanik District
Figure 10. Reach index map of Central Semarang District
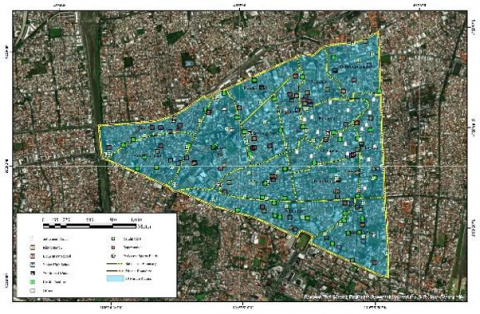
Figure 11. Gravity index map of Banyumanik District
Figure 12. Gravity index map of Central Semarang District
Analysis of the gravity index in Banyumanik District, as illustrated in Figure 11, shows that Srondol Wetan, Sumurboto, and Padangsari have the highest levels of accessibility. These subdistricts stand out because they are easily reached from many other locations in the road network, thanks to the relatively short distances between points. This means that a wide range of places can access these areas quickly and with minimal travel.
Additionally, the gravity index analysis for Central Semarang District, as depicted in Figure 12, highlights Kranggan and Jagalan as the subdistricts with the highest scores. These areas are highly accessible from numerous surrounding locations because they are situated near many other points within the road network. As a result, travel times and distances to reach these subdistricts from other places are relatively short.
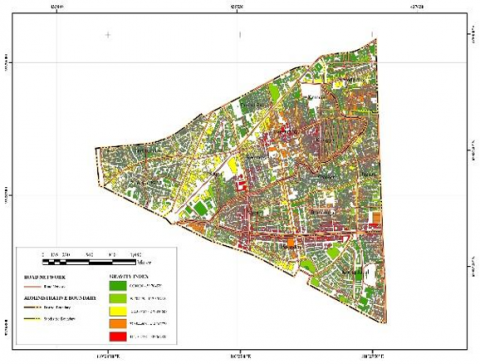
4.4.3 Betweenness index analysis
The betweenness index reflects how many routes between buildings pass through a particular building. The greater the number of routes that traverse a building, the higher its betweenness value. On the map, a red line highlights areas with the highest connectivity.
Figure 13. Betweenness index map of Banyumanik District
Figure 14. Betweenness index map of Central Semarang District
The betweenness index analysis for Banyumanik District, depicted in Figure 13, reveals that Pudakpayung, Srondol Wetan, and Padangsari are the subdistricts with the highest index values. Many buildings in these areas appear in red or orange, signifying that the shortest routes in the road network often pass through them. Field validation further confirms that this region has a highly interconnected road network.
The betweenness index analysis for Central Semarang District, presented in Figure 14, identifies Kranggan and Jagalan as the subdistricts with the highest betweenness scores. Buildings in these areas are marked in red or orange on the map, indicating that many of the shortest routes within the road network pass through them.
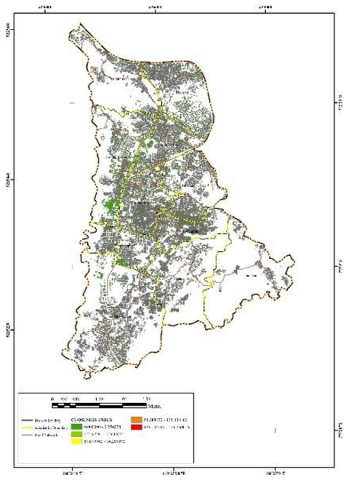
4.4.4 Closeness index analysis
The closeness index measures how easily a location can be reached within the network. A higher closeness value means that the area is more accessible and can connect to numerous destinations quickly and efficiently.
According to Figure 15, the closeness index analysis for Banyumanik District reveals that Banyumanik, Sumurboto, and Pedalangan are the subdistricts with the highest values. These areas stand out for their excellent accessibility from many different locations. The well-organized and efficient road network in this district ensures smooth movement between places, which plays a key role in producing high closeness index scores here.
Figure 15. Closeness index map of Banyumanik District
For Central Semarang District, Figure 16 highlights that Gabahan and Jagalan are the subdistricts with the highest closeness index values. Areas with elevated closeness values occupy strategic positions within the road network, making them highly accessible from many different points. This strong accessibility is supported by a well-connected road infrastructure, which enhances smooth movement throughout the district and contributes to the high closeness scores observed in these locations.
Figure 16. Closeness index map of Central Semarang District
4.4.5 Straightness index analysis
The straightness index considers three primary aspects: the configuration of the road network, the distance traveled, and how easily buildings can be accessed. This metric is used to evaluate how direct or efficient the travel route is between two buildings within the network.
Figure 17. Straightness index map of Banyumanik District
Figure 18. Straightness index map of Central Semarang District
The straightness index analysis for Banyumanik District, presented in Figure 17, identifies Srondol Wetan, Padangsari, and Pedalangan as the subdistricts with the highest scores. Thanks to their strategic locations and well-connected road networks, buildings in these areas can reach a wide range of destinations quickly and with minimal travel distance.
Examining the straightness index analysis for Central Semarang District, as illustrated in Figure 18, reveals that Kranggan and Jagalan stand out with the highest values. These subdistricts benefit from strategic locations and a well-structured road network, which enhances connectivity. As a result, buildings in these areas are able to access a variety of destinations swiftly and efficiently, both in terms of distance covered and travel time.
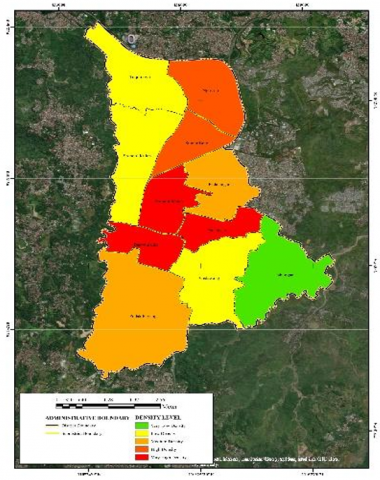
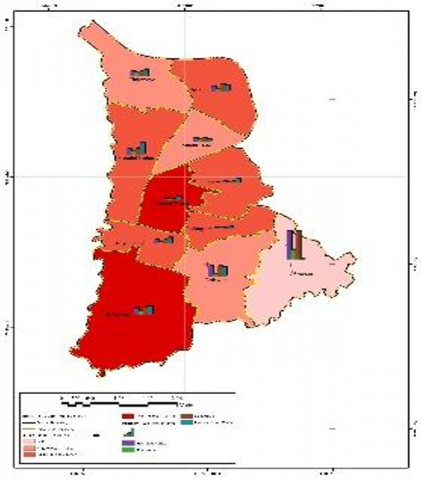
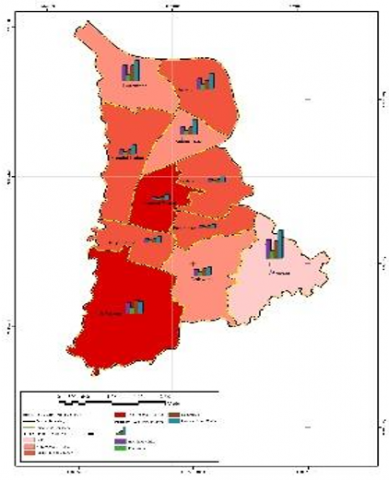
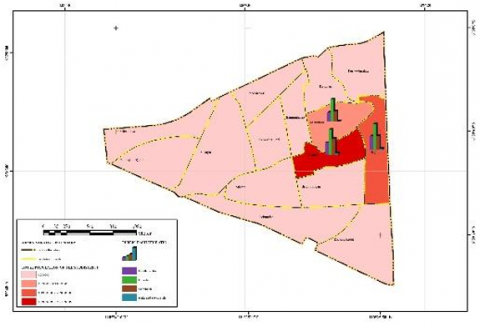
Referring to Table 12, the subdistricts of Srondol Wetan, Banyumanik, Padangsari, and Kranggan are highlighted within Banyumanik District. Meanwhile, Kranggan, Jagalan, and Gabahan are the standout areas in Central Semarang District that align with the 15-Minute City principle. Collectively, Banyumanik demonstrates greater potential, thanks to its high accessibility and diverse land use, both of which foster efficient movement throughout the area.
Table 12. Kernel Density, isochrones, closest facility and urban network analysis of Banyumanik District
|
Subdistrict |
Processing Method |
|||
|
Kernel Density |
Isochrones |
Closest Facility |
Urban Network Analysis |
|
|
Padangsari |
|
Total Affordability of Public Facilities:
|
Total Affordability of Public Facilities:
|
|
|
Srondol Wetan |
|
Total Affordability of Public Facilities:
|
Total Affordability of Public Facilities:
|
|
|
Banyumanik |
|
Total Affordability of Public Facilities:
|
Total Affordability of Public Facilities:
|
|
Table 13. Kernel Density, isochrones, closest facility and urban network analysis of Central Semarang District
|
Subdistrict |
Processing Method |
|||
|
Kernel Density |
Isochrones |
Kernel Density |
Urban Network Analysis |
|
|
Gabahan |
|
Total Affordability of Public Facilities:
|
Total Affordability of Public Facilities:
|
|
|
Jagalan |
|
Total Affordability of Public Facilities:
|
Total Affordability of Public Facilities:
|
|
|
Kranggan |
|
Total Affordability of Public Facilities:
|
Total Affordability of Public Facilities:
|
|
In contrast, Table 13 shows that Central Semarang, while exhibiting a more organized urban structure, is challenged by significant distances between facilities and a dense, narrow road network. As a result, Banyumanik emerges as a stronger closeness for implementing the 15-Minute City concept, thanks to its spatial characteristics, road network design, and distribution of public amenities. Nevertheless, both districts offer promising opportunities for growth if guided by thoughtful planning aimed at achieving sustainable and inclusive urban development.
A comprehensive analysis of the various methods underscores Banyumanik District’s strong conformity to the core tenets of the 15-Minute City paradigm. The findings derived from the Kernel Density method indicate a higher concentration of residential buildings in Banyumanik, while the Isochrones approach demonstrates the district’s extensive accessibility to public facilities, attributed to their well-planned distribution. Further, the Closest Facility method accentuates Banyumanik’s advantages, as its mixed land use pattern significantly enhances access to vital amenities. The UNA method corroborates these observations by revealing that the district benefits from an integrated road network and robust building connectivity, leading to superior index values.
Collectively, these results affirm that Banyumanik District effectively embodies the fundamental components of a 15-Minute City: elevated population density, convenient access to essential public facilities, and a vibrant mixture of land uses and economic activities. As such, Banyumanik emerges as an exemplary area for advancing the implementation of the 15-Minute City concept. Nonetheless, the distinctive spatial features of Semarang City preclude the wholesale application of this model across all districts. A citywide, nuanced evaluation remains necessary to accurately identify which areas are optimally aligned with the 15-Minute City framework.
This study assessed the feasibility of implementing the 15-Minute City concept within the residential areas of Semarang, with particular focus on building density, accessibility, and network connectivity. The findings reveal that Banyumanik District and Central Semarang District possess notable potential for facilitating access to public facilities within a 15-minute walk or cycle. These neighborhoods benefit from a compact urban form, diverse land uses, and well-developed connectivity, collectively enhancing their alignment with the principles of the 15-Minute City. Notably, Banyumanik District stands out due to its integrated urban structure and equitable service distribution, making it a model for future mixed-use land policy initiatives aimed at increasing density and compactness.
Nevertheless, the predominance of landed housing in Semarang City contributes to a sprawling urban structure, which in turn diminishes population density per square kilometer. The continued emphasis on single housing zoning presents significant challenges to achieving the efficiency envisioned by the 15-Minute City model. Adapting this European urban paradigm to the context of Indonesian cities requires a strategic approach, including the promotion of residential development proximate to public service facilities, advancement of mixed land use, implementation of Transit-Oriented Development principles, and ultimately, a transition toward vertical housing solutions.
We thank the support of the Diponegoro University for the Research Grant from the Annual Work and Budget Plan of the Faculty of Engineering, Diponegoro University.
[1] Khavarian-Garmsir, A.R., Sharifi, A., Sadeghi, A. (2023). The 15-Minute City: Urban planning and design efforts toward creating sustainable neighborhoods. Cities, 132: 104101. https://doi.org/10.1016/j.cities.2022.104101
[2] Iqbal, L.M., Georgios, T., Kizos, T. (2024). Decoding the image of island urban sprawl: Insights from the Indonesian archipelago. Planning Practice & Research, 39(4): 636-664. https://doi.org/10.1080/02697459.2024.2342756
[3] Gamal, A., Rohmah, L., Muhyi, M.M. (2023). Housing preference shifting during COVID-19 pandemic in Indonesia. Journal of Urban Management, 12(3): 268-283. https://doi.org/10.1016/j.jum.2023.05.002
[4] Rustiadi, E., Pravitasari Emma, A.E., Setiawan Yudi, Y., Mulya Ardy, S.P., Pribadi Didit, D.O., Tsutsumida, N.T. (2021). Impact of continuous Jakarta megacity urban expansion on the formation of the Jakarta-Bandung conurbation over the rice farm regions. Cities, 111: 103000. https://doi.org/10.1016/j.cities.2020.103000
[5] Vichiensan, V., Nakamura, K. (2021). Walkability perception in Asian cities: A comparative study in Bangkok and Nagoya. Sustainability, 13(12): 6825. https://doi.org/10.3390/su13126825
[6] Affif, A.M. (2020). Walkability index of Kampung Madras commercial area. Arsitektura: Jurnal Ilmiah Arsitektur dan Lingkungan Binaan, 18(2): 239-248. https://doi.org/10.20961/arst.v18i2.43421
[7] Ford, L.R. (1993). American geographical society A model of Indonesian city structure. Geographical Review, 83(4): 374-396. https://doi.org/https://doi.org/10.2307/215821
[8] Monkkonen, P. (2013). Urban land-use regulations and housing markets in developing countries: Evidence from Indonesia on the importance of enforcement. Land Use Policy, 34: 255-264. https://doi.org/10.1016/j.landusepol.2013.03.015
[9] Muzayanah, I.F.U., Ashintya, D., Kenny Devita, I., Eldo Malba, S., Arundina, T. (2022). Walking down the street: How does the built environment promote physical activity? A case study of Indonesian cities. International Journal of Urban Sustainable Development, 14 (1): 425-440. https://doi.org/10.1080/19463138.2022.2135099
[10] Fabiansa, A., Navastara, A.M., Yusuf, M., Ramadhan, M.R., Akbar, R.A. (2024). From 15-minutes city to proximity paradigm: Insights from surabaya rungkut development unit. In IOP Conference Series: Earth and Environmental Science, 1353(1): 012028. https://doi.org/10.1088/1755-1315/1353/1/012028
[11] Abdelfattah, L., Deponte, D., Fossa, G. (2022). The 15-Minute City: Interpreting the model to bring out urban resiliencies. Transportation Research Procedia, 60: 330-337. https://doi.org/10.1016/j.trpro.2021.12.043
[12] Alawadi, K., Anabtawi, R., Alshehhi, G. (2025). The minute city: Between theory and practicality in suburban landscapes. Sustainability: Science, Practice and Policy, 21(1): 2444007. https://doi.org/10.1080/15487733.2024.2444007
[13] Pozoukidou, G., Angelidou, M. (2022). Urban planning in the 15-Minute City: Revisited under sustainable and smart city developments until 2030. Smart Cities, 5(4): 1356-1375. https://doi.org/10.3390/smartcities5040069
[14] Khashoggi, B.F., Murad, A. (2020). Issues of healthcare planning and GIS: A review. ISPRS International Journal of Geo-Information, 9(6): 352. https://doi.org/10.3390/ijgi9060352
[15] Qiu, N., Xing, Z., Han, X., Du, M. (2025). Chrono-urbanism in action: Collaborative governance for heritage preservation and livability in Beijing’s Hutongs. Cities, 160: 105841. https://doi.org/10.1016/j.cities.2025.105841
[16] Di Marino, M., Tomaz, E., Henriques, C., Chavoshi, S.H. (2023). The 15-Minute City concept and new working spaces: A planning perspective from Oslo and Lisbon. European Planning Studies, 31(3): 598-620. https://doi.org/10.1080/09654313.2022.2082837
[17] Hillier, B. (2012). The city as a socio-technical system: A spatial reformulation in the light of the levels problem and the parallel problem. In Digital Urban Modeling and Simulation. Berlin, Heidelberg: Springer Berlin Heidelberg, pp. 24-48. https://doi.org/10.1007/978-3-642-29758-8_3
[18] An, Y., Wu, X., Liu, R., Liu, L., Liu, P. (2023). Quantitative analysis village spatial morphology using “SPSS+GIS” approach: A case study of linxia hui autonomous prefecture. Sustainability, 15(24): 16828. https://doi.org/10.3390/su152416828
[19] Metwally, E., Menshway, Y., Zaki, F.M. (2025). The role of GIS in promoting the 15-Minute City concept for sustainable urban using network analysis (Case study: El Rehab city). Mansoura Engineering Journal, 50(1): 9. https://doi.org/10.58491/2735-4202.3260
[20] Hassanpour, A., Bigazzi, A. (2024). Operating speed distributions in off-street cycling facilities by vehicle type and motorization. Journal of Cycling and Micromobility Research, 2: 100021. https://doi.org/10.1016/j.jcmr.2024.100021
[21] Kassim, A., Tayyeb, H., Al-Falahi, M. (2020). Critical review of cyclist speed measuring techniques. In Journal of Traffic and Transportation Engineering (English Edition). Chang’an University, 7(1): 98-110. https://doi.org/10.1016/j.jtte.2019.09.001