Ruby Bisht*![]() | Amit Kumar Uniyal
| Amit Kumar Uniyal![]()
© 2025 The authors. This article is published by IIETA and is licensed under the CC BY 4.0 license (http://creativecommons.org/licenses/by/4.0/).
OPEN ACCESS
This research strives to create sustainable mechanisms, which will enhance work-life balance (WLB) among teachers in Uttarakhand, India. A quantitative research design was applied using a structured questionnaire to capture data of 194 rural teachers who were selected using stratified random sampling between January and March 2024. The study investigated the connection between workload, teaching environment perceptions, and demographic variables and WLB. Correlation, regression, and factor using SPSS were used in statistical analysis. The findings indicated that there was a significant negative relationship between workload and WLB (r = 0.732, p < 0.001); strong positive relationship between teaching environment perceptions and WLB (r = 0.821, p < 0.001). Age, gender, and marital status played off as significant predictors (R2 = 0.510, p < 0.001) as well. These results contextualize the necessity of specific measures (workload control, flexible time, and support systems in institutions) to support the well-being and retention of rural teachers.
work-life balance, rural educators, strategies, quantitative research, statistical analysis
Work-life balance (WLB) is a vital issue for professionals across all sectors, and educators in rural locations face even more complex issues [1, 2]. Rural instructors frequently face isolation, limited resources, and the burden of managing several jobs within tiny institutions [3]. These educators usually work long hours, handling not just teaching, but also administrative chores, extracurricular activities, and student counseling, which limits their time and contributes to high levels of stress [4, 5]. According to research, the difficulty in reaching WLB for rural educators has an impact on their general well-being, work satisfaction, and retention rates in these locations. Balancing professional and personal obligations is especially difficult when resources are low and support systems are scarce [6, 7]. Teachers in these situations may experience burnout more quickly, resulting in high turnover rates and reduced educational quality in rural areas [8, 9]. Considering these problems is captious for developing solutions to improve WLB, which will increase job satisfaction and ensure the long-term retention of professional educators in rural areas [10, 11]. Several strategies have been introduced to maintain work-life balance for rural educators, considering the unique problems they confront. One significant solution is to introduce flexible scheduling for both teachers and students, giving educators more control over their time [12, 13]. Furthermore, time management training can assist educators in prioritizing activities and allocating time more effectively, hence lowering the stress of managing various duties. The use of digital tools has also proven useful in streamlining administrative tasks. For instance, computers and online platforms can be utilized for virtual lesson planning, online student exams, and digital communication with parents, decreasing the need for time-consuming paper- based work [14]. This technological innovation not only saves time but also allows teachers to better plan their schedules, which benefits both their professional and personal lives. Another effective technique is to create community support through mentorship programs or peer networks [15]. These initiatives offer rural teachers the same resources and emotional support as their urban counterparts, decreasing professional isolation and building a sense of belonging [16]. Together, these tactics enable rural educators to better balance their work and family life, improving their well-being and job satisfaction [17]. While these initiatives for enhancing WLB in rural school settings are promising, they do confront some limitations. Flexible scheduling can be difficult to execute in small rural schools because of personnel constraints. Many schools have fewer teachers and resources to cover classes [18]. The use of digital tools requires both reliable internet connectivity and necessary technological abilities, which are sometimes constrained in rural regions, making this technique less accessible [19]. Similarly, while mentorship programs and peer support networks can assist in alleviating professional isolation, they necessitate significant effort and organization. If not managed appropriately, these methods may increase teachers' burdens rather than reduce them [20]. The additional preparation and communication required for these support systems may inadvertently create stress for educators rather than providing respite [21]. As a result, these initiatives must be carefully customized to the specific demands and limits of rural instructors, ensuring they are both practicable and effective without incurring additional obligations [22].
Despite the fact that research on WLB in education has been conducted, the existing ones are more likely to target urban educators or educators at higher educational institutions [11, 19]. The literature gap on the subject of rural school-teachers, particularly with reference to the Indian situation, is apparent because school-teachers alone in rural areas are affected by certain types of social and cultural conditions and infrastructural problems. Further, most of the previous studies incorporate qualitative or broad descriptive measures in their approach, whereby their findings are dominated by a shallow statistical knowledge of the particular factors that affect WLB in rural settings. The novelty of the study is associated with the fact that this is empirical research that focuses on secondary school teachers in rural schools of the Indian state of Uttarakhand and this particular population is underrepresented in existing WLB studies. Although past literature has considered the WLB among educators, some of them are limited to urban settings, institutions of higher learning, or broad generic groups of professionals without regard to the structural, social, or occupational issues that affect the functioning of teachers in rural areas. The proposed imminent study fills that gap by suggesting a region-specific, statistically sound study through implementation of stratified random sampling and utilization of advanced quantitative methods of correlation, regression and factor analysis. Moreover, it is no longer superficial since it examines the interaction between workload, how individuals perceive the work environment, and demographic factors that influence WLB outcomes. The approach of the study to base its findings on the real-life rural setting and formulate them in the form of practical, policy-oriented advice makes the research create original knowledge of academic value as well as operational interest. It is because of this that it offers an unprecedented empirical basis on which further educational planning, resources provision, and institutional reforms can be done using specifically in relation to education ecosystems in both rural India and other parts of the world.
2.1 Relationship between workload and work-life balance of rural teachers
Research has looked into the relationship between rural teachers' workloads and their WLB. Ogakwu et al. [23] conducted a 12-session Lucid Emotive Work-related Well-being Intervention to evaluate the impact of workloads and demands on primary school teachers in Nigeria. The results showed an improvement in work-life quality and stress organization following the intervention, showing that good task management can improve well-being. Abdulaziz et al. [24] found that WLB improves organizational commitment among teachers, but it also has a negative effect that is tempered by job engagement. Rashid et al. [25] highlighted the negative impact of workload on teachers' job performance and stress levels, emphasizing the significance of supervisory support in effective WLB management. Edeh et al. [26] found that transformational leadership mediates the association between WLB and teacher in-role performance, emphasizing the noteworthiness of work-life balance to retain productivity and alleviate workload issues. Collectively, these studies show that enhancing WLB and overall well-being among rural school-teachers requires efficient workload management. Similarly, Ademola et al. [27] used a descriptive research approach to evaluate the association between WLB and work performance among Ekiti State secondary school teachers. They used a multistage sampling strategy to choose 720 instructors and 72 principals from 72 public secondary schools. The Pearson Product Moment Correlation demonstrated a substantial link (r = 0.595) between WLB and job performance, with work-family stress and workload having a negative impact on performance. Mathews et al. [28] investigated the impact of WLB practices, including workload and school environment, on job satisfaction in Nairobi County's public secondary schools, and recommended recruiting more teachers and enhancing school security to improve teachers' overall experience.
2.2 Perceptions of work-life balance difficulties among rural teachers
Different studies have identified several challenges that rural instructors confront in terms of WLB. For example, Ogakwu et al. [29] studied the influence of the Rural Education Outreach and Health Campaign (REOHC) on public school teachers in Nigeria and discovered that the intervention dramatically increased WLB and burnout prevention. Kumar and Prakash [30] focused on the specific issues that female school teachers faced during the COVID-19 epidemic, namely how changes in their positions impacted their capacity to sustain WLB while providing online courses from home. Similarly, Chana et al. [31] discovered that conflicts in work and family life had adverse impact on job satisfaction and performance among business studies instructors in Nigeria, prompting them to advocate employing more professors to reduce workload. Boakye et al. [32] and Žnidaršič and Marič [33] found that work-life interference negatively impacts job satisfaction. This emphasizes how important it is to have encouraging workplaces and family-friendly policies to improve work engagement, job satisfaction, and life satisfaction. These studies collectively highlight the substantial hurdles that rural educators face when attempting to reconcile work and family responsibilities, emphasizing the necessity for institutional support to alleviate these issues. Cusipag et al. [34] investigated how employer support, workplace, and student attitudes influence Job satisfaction and work-life balance among Filipino educators. The study indicated that the workplace has a favorable influence on WLB and job satisfaction, but student attitudes have no effect on WLB but have an impact on job satisfaction. Notably, employer support was found to improve teaching outcomes, demonstrating that, despite hurdles, online teachers can attain WLB and job satisfaction. Solanki and Mandaviya [35] also investigated the differences on the basis of genders in perceived job stress among university instructors in Gujarat, India, and discovered that female instructors experienced significantly higher job stress, which had an impact on their WLB, whereas males managed anger better but reported more stress-related health issues.
2.3 Demographic factors and work-life balance of rural teachers
Several studies have investigated the extent to which demographic characteristics influence teachers' work-life balance. Al-Alawi et al. [36] explored the effects of work-family and family-work conflict on female teachers in Saudi Arabia and discovered that, while both WLB Job satisfaction has a favourable impact on employee performance, family-work conflict has a significant negative impact. Mayya et al. [37] investigated how Indian college instructors' work-life balance varied by gender, and discovered that male, older, and scientific faculty reported higher WLB than other gender categories. Anbalagan [38] stressed the combined strain that female educators face when reconciling conventional family demands with professional responsibilities. In comparison to their female counterparts and private college teachers, male instructors, class tutors, and those employed in public schools’ report experiencing emotional exhaustion and having the lowest WLB, according to a comparable survey of Chinese college teachers conducted by Wei and Ye [39]. These studies emphasize the important influence of gender, age, and job function on WLB among teachers, particularly in rural areas. In the context of the COVID-19 epidemic, Rawal [40] investigated the obstacles that school instructors in Noida faced when delivering online curriculum from home, as well as their coping techniques. The study stressed how blurred work-life boundaries impacted women educators in particular, causing higher stress owing to extended working hours, a lack of recognition, and the difficulties of balancing personal and professional commitments in the same environment. Leo et al. [41] explored how the pandemic disproportionately affected female educators, particularly those with childcare duties. Their mixed-methods study of 752 educators from New York State discovered that Stress and WLB issues were more prevalent among women, owing mostly to work-related stresses rather than childcare tasks, while childcare responsibilities were still a significant issue for both genders. This underscores the critical need for additional study on WLB in the education sector, especially given the persistent issues.
The purpose of this study is to explore the feasible and long-term strategies for improving the WLB of rural educators. By concentrating on teachers lived experiences in remote places, the study will generate concrete recommendations that take into account both the strengths and limitations of present practices. The study will cover essential topics such as workload management, support systems, and technology integration, while also taking into account the unique obstacles that rural schools experience. Ultimately, the research findings will be used to enhance the quality of life for rural teachers, promoting their professional longevity and well-being. The study's goal is to establish a more stable and supportive educational environment by promoting a healthy balance between work and life, which will benefit not only educators but also the larger rural communities that they serve. The research objectives of the study include:
1. To assess the various factors affecting the WLB of teachers in rural areas.
2. To explore the perception of WLB of teachers in rural areas.
3. To examine the impact of various demographic variables on WLB of teachers in rural areas.
4. To suggest some measures to improve the WLB of teachers in rural areas.
Alternative Hypothesis (H1): There is a significant relationship between workload and work-life balance of rural teachers.
Alternative Hypothesis (H2): Teachers in rural areas perceive significant difficulties in maintaining work-life balance.
Alternative Hypothesis (H3): Demographic factors (age, gender, marital status) significantly impact the work-life balance of rural teachers.
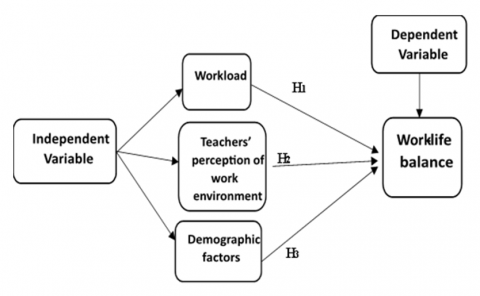
Figure 1 shows the conceptual framework of the study, where workload, Teacher’s perception of work environment and demographic factors are independent variables and work life balance is dependent variable.
Figure 1. Conceptual framework of the study
This study adopted a quantitative research design to investigate the influence of workload, perceptions of the teaching environment, and demographic factors on the WLB of rural educators in Uttarakhand, India. Data were collected using a structured questionnaire consisting of 15 items rated on a 5-point Likert scale (1 = Strongly Disagree to 5 = Strongly Agree). The research questionnaire was turned into a Google Form. The items were grouped under four domains: workload, perception of work environment, demographic information (age, gender, marital status), and WLB. To ensure content validity, the questionnaire was reviewed by a panel of three academic experts specializing in educational research and rural teacher development. Based on their suggestions, certain items were revised for clarity and contextual alignment. A pilot test was conducted in December 2023 with 25 rural school teachers outside the main sample to ensure clarity and consistency. The instrument showed excellent reliability, with a Cronbach’s alpha of 0.939, indicating strong internal consistency. Data collection was conducted between January 5 and March 28, 2024. Participants were selected through stratified random sampling, based on district-level teacher population data sourced from UDISE+ 2023–24, ensuring balanced representation across Uttarakhand’s rural districts. The final sample comprised 194 rural teachers.
Ethical considerations were carefully addressed. While the study did not require formal institutional ethical approval, it followed standard ethical research practices. Participants were informed of the study’s purpose and assured of confidentiality and anonymity. Participation was entirely voluntary, and respondents had the right to withdraw at any point without penalty. Data were analyzed using SPSS software, employing descriptive statistics, independent t-tests, Pearson correlation, multiple regression, and factor analysis to examine relationships between variables and test the proposed hypotheses.
The data on WLB among rural educators reflects a generally positive outlook but with notable challenges. Most participants (91.3%) disagree or strongly disagree that they can balance their professional and personal lives, with 56.2% disagreeing and 35.1% strongly disagreeing. Only a small minority (7.7%) agree, representing overall satisfaction with WLB. In terms of workload, 86.6% feel their workload is reasonable & permits them to accomplish both work & personal responsibilities. Only 10.8% disagree, suggesting that workload is generally seen as manageable, though a small percentage feel overburdened.
6.1 Demographic details
The demographic gives individual information about an individual, such as age range, gender, marital status, teaching experience, and educational level.
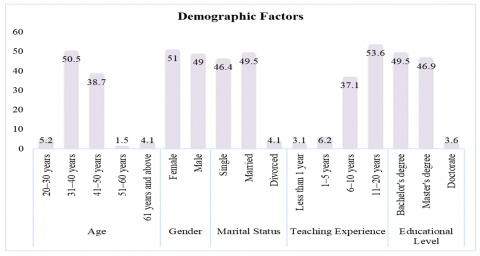
Figure 2 reveals key demographic insights into a group of rural educators. Most participants (50.5%) are aged between 31–40 years, with the next largest group (38.7%) being 41–50 years. Educators aged 20–30 and 61 years and above represent smaller portions, 5.2% and 4.1%, respectively. Gender distribution is fairly balanced, with 51% female and 49% male participants. Regarding marital status, almost half (49.5%) are married, 46.4% are single, and 4.1% are divorced. Teaching experience is diverse, with a majority (53.6%) having 11–20 years of experience, followed by 37.1% with 6–10 years. Those with less than 5 years of experience account for 9.3% of the sample. Educational qualifications are primarily at the bachelor’s level (49.5%), closely followed by master's holders (46.9%), while 3.6% possess a doctorate. This demographic distribution offers valuable context for understanding the WLB needs of rural educators.
6.2 Descriptive statistics
Table 1 displays the descriptive statistics for various demographic & work-related variables among 194 respondents. Age has a mean of 2.49 with a standard deviation (SD) of 0.797, representing a relatively young average age among participants. The standard error mean (SEM) of 0.057 suggests that this estimate of age is stable. Gender has a mean of 1.49, with an SD of 0.501, representing a fairly balanced representation of male and female educators, with an SEM of 0.036. Marital status shows a mean of 1.58 and an SD of 0.573, suggesting a predominance of married individuals among respondents. Teaching experience has a mean of 3.41 with an SD of 0.745, reflecting a range of experience levels, while the SEM of 0.053 represents precise estimation. Educational level has a mean of 1.54, with an SD of 0.568, suggesting that most participants hold at least a bachelor's degree. WLB has a mean of 4.0402, representing a generally positive perception, and TPWE has a mean of 4.0289, reflecting satisfaction with the work environment. Workload also shows a mean of 4.0082, suggesting that most educators perceive their workload positively. All SDs represent moderate variability in responses.
Table 1. Descriptive statistics
|
|
N |
Mean |
Std. Deviation |
Std. Error Mean |
|
Age |
194 |
2.49 |
.797 |
.057 |
|
Gender |
194 |
1.49 |
.501 |
.036 |
|
Marital Status |
194 |
1.58 |
.573 |
.041 |
|
Teaching Experience |
194 |
3.41 |
.745 |
.053 |
|
Educational Level |
194 |
1.54 |
.568 |
.041 |
|
WLB |
194 |
4.0402 |
.72828 |
.05229 |
|
TPWE |
194 |
4.0289 |
.66783 |
.04795 |
|
Workload |
194 |
4.0082 |
.70991 |
.05097 |
Figure 2. Demographic information
6.3 Reliability statistics
Cronbach's Alpha is used in Table 2 to show reliability statistics for the measured constructs. The aggregate Cronbach's Alpha is 0.939, representing strong internal consistency among the items examined. This high result represents that the items accurately assess the same underlying construct. Furthermore, Cronbach's Alpha based on standardized items is 0.939, representing that reliability remains consistent independent of item scaling. The analysis contains 15 items, representing that the questionnaire or scale used was well-designed and produced reliable results for assessing the variables of interest.
Table 2. Reliability statistics
|
Cronbach's Alpha |
Cronbach's Alpha Based on Standardized Items |
No. of Items |
|
.939 |
.939 |
15 |
6.4 T-test
Table 3 displays outcomes of the t-test comparing various factors against a test value of zero. For age, the t-value is 43.530 with 193 degrees of freedom (df) & a significance level (Sig.) of < 0.001, representing a significant mean difference (MD) of 2.490, with a 95% confidence interval (CI) ranging from 2.38 to 2.60. Gender also shows a t-value of 41.400 and an MD of 1.490, confirming statistical significance with a CI of 1.42 to 1.56. Marital status has a t-value of 38.349, with an MD of 1.577 and a CI from 1.50 to 1.66. For teaching experience, the t value is 63.830, demonstrating an MD of 3.412 within a CI of 3.31 to 3.52. Educational level yields a t-value of 37.823 and an MD of 1.541, while WLB and TPWE show exceptionally high t-values of 77.269 and 84.026, respectively, both with MDs over 4, emphasizing significant positive perceptions. All tests represent highly significant results at the less than 0.001 level, reinforcing the reliability of these findings.
Table 3. T-test
|
Test Value=0 |
||||||
|
t |
df |
Sig. (2-tailed) |
Mean Difference |
95% Confidence Interval of the Difference |
||
|
Lower |
Upper |
|||||
|
Age |
43.530 |
193 |
<.001 |
2.490 |
2.38 |
2.60 |
|
Gender |
41.400 |
193 |
<.001 |
1.490 |
4.12 |
1.56 |
|
Marital Status |
38.349 |
193 |
<.001 |
1.577 |
1.50 |
1.66 |
|
Teaching Experience |
63.830 |
193 |
<.001 |
3.412 |
3.31 |
3.52 |
|
Educational level |
37.823 |
193 |
<.001 |
1.541 |
1.46 |
1.62 |
|
WLB |
77.269 |
193 |
<.001 |
4.04021 |
3.9371 |
4.1433 |
|
TPWE |
84.026 |
193 |
<.001 |
4.02887 |
3.9343 |
4.1234 |
|
Workload |
78.641 |
193 |
<.001 |
4.00825 |
3.9077 |
4.1088 |
6.5 ANOVA
Table 4 displays the outcomes of ANOVA analysis, which examines the differences between groups. The sum of squares (SOS) between people is 1207.734 with 193 df, yielding a mean square (MS) of 6.258. An analysis of variance between items shows an SOS of 10.237 with 14 df and an MS of 0.731, resulting in an F-value of 1.909 & a Sig. of 0.021, representing statistically significant differences among items. The non-additivity residual, with an SOS of 3.215, has an F-value of 8.415 and a Sig. of 0.004, suggesting meaningful interactions affecting the results. The total SOS for the balance is 1031.881, with a residual MS of 0.382, contributing to the overall total SOS of 2253.067 across 2909 df. Overall, these results represent significant differences within the groups, emphasizing the importance of the variables examined in this study.
Table 4. ANOVA
|
Sum of Squares |
df |
Mean Square |
F |
Sig. |
|||
|
Between people |
1207.734 |
193 |
6.258 |
|
|||
|
Within people |
Between people |
10.237 |
193 |
.731 |
1.909 |
.021 |
|
|
Residual |
Non-Additivity |
3.215 |
193 |
3.215 |
8.415 |
.004 |
|
|
Balance |
1031.096 |
193 |
.382 |
|
|
||
|
Total |
1035.096 |
193 |
.383 |
|
|
||
|
Total |
1045.333 |
193 |
.385 |
|
|
||
|
Total |
2253.067 |
193 |
.775 |
|
|
||
6.6 Hotelling's T-squared
Table 5 presents outcomes of Hotelling's T-squared test, which assesses differences between group means for multivariate data. The Hotelling's T-squared value is 21.704, representing the overall effect size. The associated F-value is 1.446, with df1 equal to 14 and df2 equal to 180. The Sig. value of 0.136 proposes that the observed differences between groups are not statistically significant at conventional levels (e.g., p < 0.05). This result implies that there may not be strong evidence of multivariate differences among the groups for the variables included in the analysis.
Table 5. Hotelling's T-squared
|
Hotelling’s T-Squared |
f |
df1 |
Df2 |
Sig |
|
21.704 |
1.446 |
14 |
180 |
.136 |
6.7 Correlation coefficient (R)
Table 6 shows the outcomes of Kendall's tau-b & Spearman's rho tests for WLB, TPWE, and workload. Kendall's tau-b analysis reveals that WLB has a strong positive association with TPWE (0.395) and a moderate correlation with workload (0.352). This suggests that improvements in WLB are associated with better perceptions of the teaching environment and a manageable workload. The correlation between TPWE and workload is also moderate at 0.340, representing that as perceptions of the teaching environment improve, the workload is perceived as less burdensome. In terms of Spearman's rho, WLB shows a stronger correlation with TPWE (0.488) and a moderate correlation with workload (0.447). These values reinforce the findings from Kendall's tau-b, highlighting that as WLB improves, there are significant positive perceptions of both the teaching environment and workload. Overall, these results suggest that enhancing WLB is likely to improve educators' perceptions of their work environment and reduce the negative impact of workload.
Table 6. Correlation coefficient
|
WLB |
TPWE |
Workload |
||
|
Kendall’s tau b |
WLB |
1.000 |
.395* |
.352* |
|
|
TPWE |
.395* |
1.000 |
.340* |
|
|
Workload |
.352* |
.340* |
1.000 |
|
Spearman’s rho |
WLB |
1.000 |
.488* |
.447* |
|
|
TPWE |
.488* |
1.000 |
.430* |
|
|
Workload |
.447* |
.430* |
1.000 |
* represents p ≤ 0.01
6.8 Hypothesis testing
6.8.1 Hypothesis 1
Table 7 displays the Pearson correlation coefficients (PCC) between WLB and TPWE. The R is 0.821 for the relationship between WLB and TPWE, representing a strong positive correlation. This suggests that as perceptions of WLB improve, perceptions of the teaching environment also enhance.
Table 7. Pearson correlation for H1
|
|
WLB |
TPWE |
|
WLB |
1.000 |
.821 |
|
TPWE |
.821 |
1.000 |
Table 8 shows the outcomes of regression analysis for hypothesis H1. R-value is 0.821, representing a robust positive association between the IDV and DV. The R-squared value of 0.674 shows that the IDV can explain approximately 67.4% of variance in DV, representing a significant effect. The SOS for the regression is 68.977 with one df, subsequent in an MS of 68.977. F-value is 396.645, and the Sig. is < 0.001, representing that model is statistically significant. These findings suggest that IDV significantly predicts the DV, which supports hypothesis H1.
Table 8. Regression analysis for H1
|
R |
R Square |
Sum of Squares |
Df |
Mean Square |
F |
Sig |
|
.821a |
.674 |
68.977 |
1 |
68.977 |
396.645 |
<.001 |
Table 9 shows the coefficient analysis findings for Hypothesis H1. The unstandardized coefficient (USC) for constant is 0.434, with a standard error (SE) of 0.184, providing a t-value of 2.363 & a Sig. of 0.019, representing that constant is statistically significant. USC for TPWE is 0.895, with a SE of 0.045. This yields a standardized coefficient (Beta) of 0.821, with a t value of 19.916 & a Sig. of < 0.001. These data show that TPWE has a strong and statistically significant beneficial effect on DV, emphasizing the necessity of improving the teaching environment to improve outcomes linked to WLB.
Table 9. Coefficient analysis for H1
|
Model |
Unstandardized Coefficients |
Standardized Coefficients |
t |
Mean Square |
|
|
B |
Std. Error |
Beta |
|
|
|
|
Constant |
.434 |
.184 |
|
2.363 |
.019 |
|
TPWE |
.895 |
.045 |
.821 |
19.916 |
<.001 |
6.8.2 Hypothesis 2
Table 10 shows the PCC between WLB and workload. R-value is 0.732, representing a strong positive association. This implies that as workload grows, perceptions of WLB decline, emphasizing the importance of workload on teachers' capacity to maintain a healthy WLB.
Table 10. Pearson correlation for H2
|
|
WLB |
Workload |
|
WLB |
1.000 |
.732 |
|
Workload |
.732 |
1.000 |
Table 11 displays outcomes of regression analysis for hypothesis H2. An R-value of 0.732 shows a strong positive relationship between IDVs and DVs. R-squared result is 0.536, showing that the workload explains approximately 53.6% of variance in WLB, representing a significant impact. The SOS for the regression is 54.871, with one degree of freedom, yielding an MS of 54.871. The model is statistically significant (F-value 221.816, Sig. < 0.001). These results represent that workload significantly predicts WLB, supporting hypothesis H2.
Table 11. Regression analysis for H2
|
R |
R Square |
Sum of Squares |
Df |
Mean Square |
F |
Sig |
|
.732a |
.536 |
54.871 |
1 |
54.871 |
221.816 |
<.001 |
Table 12 displays the coefficient analysis results for Hypothesis H2. A constant's USC is 1.030, with a SE of 0.205, yielding a t-value of 5.016 & a Sig. of less than 0.001, suggesting statistical significance. The USC for the workload is 0.751, with an SD of 0.05. This gives a beta of 0.732, a t-value of 14.893, & a Sig. of < 0.001. These findings show that workload has a strong and statistically significant negative effect on WLB, lending support to the concept that higher workloads make it more problematic for educators to uphold a healthy WLB.
Table 12. Coefficient analysis for H2
|
Model |
Unstandardized Coefficients |
Standardized Coefficients |
t |
Mean Square |
|
|
B |
Std. Error |
Beta |
|
|
|
|
Constant |
1.030 |
.205 |
|
5.016 |
<.001 |
|
Workload |
.751 |
.050 |
.732 |
14.893 |
<.001 |
6.8.3 Hypothesis 3
Table 13 presents the PCC among WLB, age, gender, and marital status. The correlation between WLB and age is 0.377, representing a moderate positive relationship, suggesting that as age increases, WLB tends to improve. The correlation between WLB and gender is 0.305, reflecting a moderate positive relationship, implying a moderate influence of gender on WLB. The marital status correlation with WLB is 0.381, also representing a moderate positive relationship, suggesting that being married may contribute positively to WLB. Additionally, age correlates positively with gender (0.385) and marital status (0.340), representing that older individuals tend to have different gender and marital status distributions. Overall, these correlations suggest that demographic factors may have some influence on WLB among rural teachers, though the relationships vary in strength.
Table 13. Pearson Correlation for H3
|
|
WLB |
Age |
Gender |
Marital Status |
|
WLB |
1.000 |
.377 |
.305 |
68.977 |
|
Age |
.377 |
1.000 |
.385 |
.340 |
|
Gender |
.305 |
.385 |
1.000 |
.357 |
|
Marital Status |
.381 |
.340 |
.357 |
.1000 |
Table 14 displays the regression analysis results for Hypothesis H3, which examines the relationship between demographic factors (age, gender, and marital status) and WLB. The R-value of 0.700 represents a strong positive relationship between IDVs & WLB. With an R-squared value of 0.510, these demographic factors explain roughly 51% of the variance in WLB, showing a strong contribution. The regression's SOS is 50.030, with three df yielding an MS of 50.030. The model is statistically significant, with an F-value of 219.643 & Sig. < 0.001. The findings show that while demographic factors influence WLB, they only account for a considerable portion of the variance, hinting that other factors may also play a role in WLB prediction.
Table 14. Regression analysis for H3
|
R |
R Square |
Sum of Squares |
df |
Mean Square |
F |
Sig |
|
.700a |
.510 |
50.030 |
3 |
50.030 |
219.643 |
<.001b |
Table 15 presents the coefficient analysis results for hypothesis H3, examining the influence of demographic factors on WLB. A constant has a USC of 4.303 with a SE of 0.261, resulting in a t-value of 16.506 & a Sig. of less than 0.001, representing its statistical significance. The USCs for age, gender, and marital status are 0.755, 0.706, and 0.784, respectively, all with SEs below 0.106. The Beta for age, gender, and marital status are 0.761, 0.704, and 0.766, respectively, demonstrating their substantial impact on WLB. All demographic factors show strong statistical significance (p < 0.001), suggesting that they significantly contribute to the WLB of rural teachers, highlighting the importance of considering these factors in future research & interventions.
Table 15. Coefficient analysis for H3
|
Model |
Unstandardized Coefficients |
Standardized Coefficients |
t |
Sig |
|
|
B |
Std. Error |
Beta |
|||
|
Constant |
4.303 |
.261 |
|
16.506 |
<.001 |
|
Age |
.755 |
.068 |
.761 |
21.812 |
<.001 |
|
Gender |
.706 |
.106 |
.704 |
20.056 |
<.001 |
|
Marital Status |
.784 |
.095 |
.766 |
24.890 |
<.001 |
6.9 Factor analysis
Table 16 shows outcomes of FA. Kaiser-Meyer-Olkin (KMO) Measure of Sampling Adequacy is 0.746, suggesting that sample size is enough for FA. Values greater than 0.7 are considered satisfactory. Bartlett's Test of Sphericity produces an estimated chi-square value of 394.939 with 3 df & a Sig. of < 0.001, representing that correlations between variables are strong enough to support component analysis. The significant result (p < 0.05) from Bartlett's test shows that the data is acceptable for dimensionality reduction using FA. This suggests that variables are interrelated enough to identify underlying components.
Table 16. Factor analysis
|
Kaiser-Meyer-Olkin Measure of Sampling Adequacy |
.746 |
|
|
Bartlett's Test of Sphericity |
Approx. Chi-Square |
394.939 |
|
df. |
3 |
|
|
Sig. |
<.001 |
|
Table 17 displays the communalities for variables WLB, TPWE, and workload. The beginning communalities for all variables are 1.000, representing that the FA accounts for all variance from the start. After extraction, WLB has a communality of 0.857, which means that the extracted components account for 85.7% of its variation. TPWE has an extraction value of 0.875, showing that 87.5% of its variance is accounted for, whilst workload has an extraction value of 0.809, suggesting that the components account for 80.9% of its variance. These high extraction values suggest that the factors account for a considerable portion of the variance for each variable, making them relevant to the investigation.
Table 17. Communalities
|
|
Initial |
Extraction |
|
WLB |
1.000 |
.857 |
|
TPWE |
1.000 |
.875 |
|
Workload |
1.000 |
.809 |
Table 18 shows the overall variation explained by the components in the FA. The first component has an initial eigenvalue of 2.541 and accounts for 84.708% of the overall variance. This demonstrates that the first component accounts for the vast majority of variability in data. A second component has an eigenvalue of 0.282, which increases the overall variance by 9.396%, to 94.104%. A third component has an eigenvalue of 0.177 & represents 5.896% of variance, for a total of 100%. However, only the first component is retained based on the extraction sums of squared loadings because it accounts for 84.708% of the variance, representing that it is the most important feature in the model.
Table 18. Total variance explained
|
Component |
Initial Eigenvalues |
Extraction Sums of Squared Loadings |
||||
|
Total |
% of Variance |
Cumulative % |
Total |
% of Variance |
Cumulative % |
|
|
1 |
2.541 |
84.708 |
84.708 |
2.541 |
84.708 |
84.708 |
|
2 |
.282 |
9.396 |
94.104 |
|
|
|
|
3 |
.177 |
5.896 |
100.000 |
|
|
|
Table 19 displays the component matrix from the FA. The matrix shows the loadings of each variable on the first component. WLB has a loading of 0.926, TPWE has a loading of 0.935, and workload has a loading of 0.900. These high values, all above 0.90, represent that all three variables strongly correlate with the first component. This suggests that the component effectively represents a significant portion of the variance in these variables, making it a critical factor in explaining the relationships between them.
Table 19. Component matrix
|
|
Component |
|
1 |
|
|
WLB |
.926 |
|
TPWE |
.935 |
|
Workload |
.900 |
The findings of this study reveal a significant negative correlation between workload and work–life balance (WLB) among rural teachers (r = 0.732, p < 0.001), with workload alone accounting for 53.6% of the variance in WLB. This confirms that increased workload has a substantial detrimental impact on educators' ability to maintain balance between their professional and personal lives. These findings ought to be similar to those of Ademola et al. [27], who established strong correlation (r = 0.595) between WLB and performance among the staff at secondary school institutions in Nigeria and that exhaustive workload had a negative impact on performance and well-being among the subjects. In the same manner, Rashid et al. [25] also pointed out that overabundant work demands were closely related to work stress and job slackening, whereas Ogakwu et al. [23] showed that workload interventions promoted the quality of work life of teachers and their control of stress. In comparison, the correlation coefficient of the current research is stronger than that of the mentioned studies, indicating that the influence of the workload on WLB can be more severe in the Indian context of the rural education environment, probably owing to the reduced amount of support and the multifunctionality of the roles that rural teachers are to undertake. This finding underscores the need for workload redistribution and structured administrative support in rural schools to preserve teacher well-being. These findings firmly establish workload as a dominant factor affecting rural teachers’ well-being. However, beyond task demands, how teachers perceive their daily work environment may further shape their ability to achieve balance, which is examined in Hypothesis 2.
Results for Hypothesis 2 indicate that teachers in rural areas perceive significant challenges in maintaining WLB, with a strong positive correlation between WLB and teaching environment perceptions (r = 0.821, p < 0.001), and 67.4% of the variance in WLB explained by this factor. This is aligned with that Chana et al. [31] in their study revealed that work-family conflict created a significantly low level of job satisfaction and performance amongst the teachers of business studies in Nigeria. Similarly, Cusipag et al. [34] pointed out that working conditions and the support of employers play a significant role in WLB and the satisfaction of Filipino teachers with work. The study at hand confirms such findings but adds extra value to the existing ones through the use of powerful quantitative data analysis that proved that workplace perceptions are not only influential but categorically strong in the formation of WLB. Gupta et al. [42] also suggest that work life quality is another important aspect, which determines the enhancement of work environment conditions and efficiency of an organization. Moreover, whereas Kumar and Prakash [30] concentrated on the qualitative nature of simple difficulties of female teachers in COVID-19 and most importantly, relating to online learning at home, this study generalizes the understanding of challenge across gender and demographic borders in rural Indian society. The high R² value emphasizes that improving the perceived work environment — through supportive leadership, time autonomy, and resource access — is critical for strengthening WLB in rural schools. While the work environment significantly influences WLB perceptions, it is also important to recognize that not all teachers experience these challenges equally. Therefore, Hypothesis 3 investigates the role of demographic factors in shaping WLB outcomes across different educator profiles.
The analysis for Hypothesis 3 shows that demographic factors — specifically age, gender, and marital status — significantly influence WLB among rural educators, with a combined predictive power of 51% (R² = 0.510, p < 0.001). The findings are backed by Mayya et al. [37], who determined that male and older faculty members indicated superior WLB over female and younger ones in Indian higher education. Rawal [40] further indicated that the level of stress experienced by the female school- teachers assigned to offer online curriculum as a result of the pandemic was high as a result posing blurred boundaries between work and home, whereas Leo et al. [41] pointed out that women teachers especially those with other responsibilities including caretaking suffered disproportionately with regards to WLB management. This paper reiterates these trends in the setting of a rural area in India and provides more details, describing the correlation of each demographic factor with WLB quantitatively. The findings suggest that targeted interventions — such as flexible work hours for female and married teachers or stress management programs for mid-career educators — could be particularly effective in addressing the nuanced WLB needs of diverse teacher subgroups. Additionally, the relatively strong effect sizes across all demographic predictors highlight the importance of customizing support mechanisms based on teacher profiles.
Collectively, the results of all three hypotheses reinforce the understanding that work–life balance among rural educators is shaped by a combination of organizational, perceptual, and personal factors. Workload and perceptions of the teaching environment emerged as the most influential, statistically accounting for a large share of variance in WLB. At the same time, demographic characteristics—such as age, gender, and marital status—contribute meaningfully to these differences, highlighting the need for nuanced and personalized support mechanisms. The alignment of these findings with prior literature strengthens their validity while also extending current knowledge by providing localized, data-driven insights specific to the Indian rural education context. Ultimately, this study emphasizes that enhancing work–life balance for rural teachers requires a multi-dimensional strategy—one that addresses not only systemic workload management but also fosters inclusive school cultures and accommodates the lived realities of diverse educators.
This study aimed to explore the variables that affect rural teachers' WLB, including age, gender, and marital status, as well as their opinions of WLB. The statistics demonstrate that teachers' WLB is significantly impacted by workload and instructional judgments. The results of this study presented a robustly positive correlation between workload & Work-life balance, with a higher workload having a detrimental effect on it. Instructors who think their classrooms are good also have better WLB. However, DC such as age, gender, and marital status showed a significant effect on rural teachers' WLB. These variables were important predictors of WLB, representing that other factor, such as workload and institutional environment, take precedence.
Given these findings, it is evident that resolving workload issues and improving the teaching environment are essential for improving rural teachers' WLB. Reduced administrative tasks, flexible work arrangements, and mental health support may all improve rural educators' general well-being and job satisfaction, promoting a more balanced work-life dynamic in remote schools.
Based on the findings of the study, some of the specific yet feasible recommendations are put forward to foster work-life balance (WLB) among rural educators. The existence of a substantial negative correlation of workload and the WLB (r = 0.732, p < 0.001) presupposes the necessity to eliminate excessive workloads. Schools need to bring in more systematized scheduling changes, so they should provide one non-instructional time per day to be available only to planning or personal breaks. Rural schools may hire part time assistants, especially government plans such as MGNREGA or student internships, to take up the routine clerical work to avoid administrative burden as well. Correlation shows that there is a close positive relationship between the perceptions of teachers and the work environment with that of WLB (r = 0.821, p < 0.001) which underscores the significance of collegial support systems. Instantaneous professional isolation can be alleviated by forming informal peer-mentorship or teacher-buddy programs. Secondly, districts education office ought to prepare communal online store of ready-to-use teaching resources along with assessment schemes and report designs to make planning easy and also delete reduplication of employment. Given that the demographic variables yielded an overall influence of considerable proportions (i.e., R2 = 0.510) and in particular on married and female teachers, the flexible scheduling policies, including optional staggered reporting times or step-down on the burdens during the caretaker phase, can be tested. Last but not least, schools must undertake WLB appraisal quarterly using standardized tools so as to keep track of the well-being of teachers and ensure they are aware of arising challenges. Regular stress management, digital, and time management workshops will also be able to contribute to the psychological well-being and productivity of teachers. The recommendations created on the basis of this data are realistic and sensitive to the needs of rural teachers, providing an alternative to a more sustainable and favorable atmosphere of work in the educational field.
We extend our gratitude to all those rural teachers who have participated in the survey and shared their valuable insights.
[1] Malik, A., Allam, Z. (2021). An empirical investigation of work life balance and satisfaction among the university academicians. The Journal of Asian Finance, Economics and Business, 8(5): 1047-1054. https://doi.org/10.13106/jafeb.2021.vol8.no5.1047
[2] Naseem, R., Khan, K.I., Naseem, S., Akhtar, Q. (2024). Female academics in higher education institutes and their work-life balance strategies: A voiceless saga. International Journal of Knowledge and Learning, 17(6): 573-595. https://doi.org/10.1504/IJKL.2024.141819
[3] Joseph, J.A. (2022). Influence of institutional work-life balance practices on teachers’ performance in public secondary schools in Homa-bay County, Kenya. Doctoral dissertation, University of Nairobi.
[4] Yahya, L.O., Azeez, R.O. (2024). Does communication and work-life balance practices affect the mental well-being of female teachers in Lagos State? International Journal of Business and Management Research, 5(2): 20-43.
[5] Arsha, D.Z., Isse, B., Moronkeji, A. (2024). The viability of four-day workweek in the education sector: Evaluating managerial views, stakeholder opinions, and the pursuit of work-life balance. Master Thesis, Malmö University.
[6] Friesen, K. (2021). Exploring the lived experiences of rural southwest Minnesota teachers in the spring 2020 transition to distance learning during the COVID-19 pandemic. Doctoral dissertation, Bethel University (Minnesota).
[7] Cornell, J.M. (2022). No principal left behind: A qualitative study on the current leadership challenges for principals in small rural districts and access to support for professional growth. Northwest Nazarene University.
[8] Diego-Medrano, E., Salazar, L.R. (2021). Examining the work-life balance of faculty in higher education. International Journal of Social Policy and Education, 3(3): 27-36.
[9] Fazal, S., Masood, S., Nazir, F., Majoka, M.I. (2022). Individual and organizational strategies for promoting work–life balance for sustainable workforce: A systematic literature review from Pakistan. Sustainability, 14(18): 11552. https://doi.org/10.3390/su141811552
[10] Ramachandaran, S., Doraisingam, P., Nuraini, R. (2024). Harmonizing work-life equilibrium: Unveiling academicians' perspectives in Malaysian higher education on work-life balance. http://doi.org/10.2139/ssrn.4881412
[11] Franco, L.S., Picinin, C.T., Pilatti, L.A., Franco, A.C. (2021). Work-life balance in Higher Education: A systematic review of the impact on the well-being of teachers. Ensaio: Avaliação e Políticas Públicas em Educação, 29(112): 691-717. https://doi.org/10.1590/S0104-403620210002903021
[12] Tochia, C. (2021). How the digital workforce has re-defined boundary management and perceptions of technological tools on maintaining work-life balance. Doctoral dissertation, University of Southampton.
[13] Udoh, A.O., Jack, I.F., Nwogu, U.J. (2024). Assessing the effectiveness of work-life balance initiatives and service delivery in tertiary educational institutions in Akwa Ibom State. International Journal of Innovative Psychology & Social Development, 12(2): 97-112.
[14] Ünal, I., Dulay, S. (2022). Teachers’ work-life balance in emergency remote teaching during the COVID-19 pandemic. Asian Journal of Distance Education, 17(2): 89-108. https://www.asianjde.com/ojs/index.php/AsianJDE/article/view/657.
[15] Sarka, S.W., Shiiwua, M. (2021). Impact of information and communication technology on work-life balance of employees in Access Bank Plc. African Scholar Journal of Mgt. Science and Entrepreneurship (JMSE-7), 23(7): 131-154. https://www.africanscholarpublications.com/wp-content/uploads/2022/03/AJMSE_Vol23_No7_Dec2021-7.pdf.
[16] Nocco, M.A., McGill, B.M., MacKenzie, C.M., Tonietto, R.K., et al. (2021). Mentorship, equity, and research productivity: Lessons from a pandemic. Biological Conservation, 255: 108966. https://doi.org/10.1016/j.biocon.2021.108966
[17] Dwivedi, P., Shrivastava, U., Nair, S.J. (2024). Investigating the impact of training programs on work-life balance of women teachers in secondary schools using PLS-SEM approach. Discover Public Health, 21(1): 13. https://doi.org/10.1186/s12982-024-00137-6
[18] Warren, T. (2021). Work–life balance and gig work: ‘Where are we now’ and ‘where to next’ with the work–life balance agenda? Journal of Industrial Relations, 63(4): 522-545. https://doi.org/10.1177/00221856211007161
[19] Cvenkel, N. (2020). Work-life balance and well-being at work. In: Crowther, D., Seifi, S. (eds) The Palgrave Handbook of Corporate Social Responsibility. Palgrave Macmillan, Cham. https://doi.org/10.1007/978-3-030-22438-7_19-1
[20] Dreyer, R.J. (2022). It is a Balancing Act: How Copreneurs Craft Work-Life Balance. Staats-und Universitätsbibliothek Hamburg Carl von Ossietzky.
[21] Punam, C. (2021). Work-life balance and job satisfaction amongst secondary school teachers of Sikkim. Doctoral dissertation.
[22] Agarwal, P. (2021). A study of work life balance of corporate women employees in Delhi NCR. Doctoral Dissertation, Shri Jagdishprasad Jhabarmal Tibrewala University.
[23] Ogakwu, N.V., Ede, M.O., Manafa, I.F., Okeke, C.I., Onah, S.O. (2024). Quality of work-life and stress management in a rural sample of primary school teachers: An intervention study. Journal of Rational-Emotive & Cognitive-Behavior Therapy, 42(1): 135-161. https://doi.org/10.1007/s10942-022-00494-8
[24] Abdulaziz, A., Bashir, M., Alfalih, A.A. (2022). The impact of work-life balance and work overload on teacher’s organizational commitment: Do job engagement and perceived organizational support matter. Education and Information Technologies, 27(7): 9641-9663. https://doi.org/10.1007/s10639-022-11013-8
[25] Rashid, S., Subhan, Q.A., Imran, M. (2022). Impact of work life balance, workload and supervisory support on teachers’ job performance with mediating role of stress: A case of private institutions. International Journal of Business and Management Sciences, 3(1): 21-34. https://ijbmsarchive.com/index.php/jbmis/article/view/116.
[26] Edeh, N.I., Ezebuiro, F.N., Okute, A.L., Nwadi, C.L., Ugwunwoti, E.P. (2024). Mediation roles of transformational leadership andpsychological empowerment on work-life balance and in-role performance of vocational educators in Nigeria. Journal of Technical Education and Training, 16(1): 112-127. https://penerbit.uthm.edu.my/ojs/index.php/JTET/article/view/13780.
[27] Ademola, O.A., Tsotetsi, C., Gbemisola, O.D. (2021). Work-life balance practices: Rethinking teachers’ job performance in Nigeria secondary schools. Journal of Studies in Social Sciences and Humanities, 7(2): 102-114.
[28] Mathews, O.A., Jeremiah, K.M., Ursulla, O.A. (2021). Influence of characteristics of work-life balance on teachers' levels of job satisfaction in public secondary schools in Nairobi, Kenya. International Journal of Educational Administration and Policy Studies, 13(2): 85-94.
[29] Ogakwu, N.V., Ede, M.O., Amaeze, F.E., Manafa, I., et al. (2022). Occupational health intervention for work–life balance and burnout management among teachers in rural communities. Journal of Community Psychology, 50(7): 2923-2937. https://doi.org/10.1002/jcop.22806
[30] Kumar, J.S., Prakash, V. (2023). Work life balance among female school teachers delivering online curriculum during COVID-19. Indonesian Journal of Multidisciplinary Science, 2(4): 2390-2395. https://doi.org/10.55324/ijoms.v2i4.415
[31] Chana, M.U., Ibrahim, A., Abdulhamid, U. (2022). Influence of work-life-balance and family-life-balance on job performance and satisfaction of business studies teachers in Bauchi State, Nigeria. Innovare Journal of Education, 10(2): 15-19. https://doi.org/10.22159/ijoe.2022v10i2.44331
[32] Boakye, A.N., Asravor, R.K., Essuman, J. (2023). Work-life balance as predictors of job satisfaction in the tertiary educational sector. Cogent Business & Management, 10(1): 2162686. https://doi.org/10.1080/23311975.2022.2162686
[33] Žnidaršič, J., Marič, M. (2021). Relationships between work-family balance, job satisfaction, life satisfaction and work engagement among higher education lecturers. Organizacija, 54(3): 227-237. https://doi.org/10.2478/orga-2021-0015
[34] Cusipag, M.N., Oluyinka, S., Bernabe, M.T.N., Bognot, F.L. (2024). Perceptions toward achieving work-life balance and job satisfaction in online teaching. Multidisciplinary Science Journal, 6(1): e2024012. https://doi.org/10.31893/multiscience.2024012
[35] Solanki, S., Mandaviya, M. (2021). Does gender matter? Job stress, work-life balance, health and job satisfaction among university teachers in India. Journal of International Women's Studies, 22(7): 121-134.
[36] Al-Alawi, A.I., Al-Saffar, E., AlmohammedSaleh, Z.H., Alotaibi, H., Al-Alawi, E.I. (2021). A study of the effects of work-family conflict, family-work conflict, and work-life balance on Saudi female teachers’ performance in the public education sector with job satisfaction as a moderator. Journal of International Women's Studies, 22(1): 486-503.
[37] Mayya, S.S., Martis, M., Ashok, L., Monteiro, A.D., Mayya, S. (2021). Work-life balance and gender differences: A study of college and university teachers from Karnataka. Sage Open, 11(4): 21582440211054479. https://doi.org/10.1177/21582440211054479
[38] Anbalagan, S. (2022). Work-life balance of higher secondary school teachers. Journal of Positive School Psychology, 6(2): 5015-5023.
[39] Wei, C., Ye, J.H. (2022). The impacts of work-life balance on the emotional exhaustion and well-being of college teachers in China. Healthcare, 10(11): 2234. https://doi.org/10.3390/healthcare10112234
[40] Rawal, D.M. (2023). Work life balance among female school teachers [k-12] delivering online curriculum in Noida [India] during COVID: Empirical study. Management in Education, 37(1): 37-45. https://doi.org/10.1177/0892020621994303
[41] Leo, A., Holdsworth, E.A., Wilcox, K.C., Khan, M.I., Ávila, J.A.M., Tobin, J. (2022). Gendered impacts of the COVID-19 pandemic: A mixed-method study of teacher stress and work-life balance. Community, Work & Family, 25(5): 682-703. https://doi.org/10.1080/13668803.2022.2124905
[42] Gupta, P., Lakhera, G., Sharma, M., Joshi, S. (2024). Digital stress effect on employee quality of life: Overcoming barriers towards sustainable development. In 2024 International Conference on Recent Innovation in Smart and Sustainable Technology (ICRISST), Bengaluru, India, pp. 1-6. https://doi.org/10.1109/ICRISST59181.2024.10921806