Muthana Basheer Hamad*![]() | Ayad Mohammed Mikhlif
| Ayad Mohammed Mikhlif![]()
© 2025 The authors. This article is published by IIETA and is licensed under the CC BY 4.0 license (http://creativecommons.org/licenses/by/4.0/).
OPEN ACCESS
The study aims to determine the extent of the demographic shift in the composition of the age structure, and its indicators: the dependency ratio and the index of longevity for the residents of Ramadi District in Anbar Governorate between the years (1997-2023) and to reveal the amount and direction of change, whether negative or positive, between the categories of the age structure and the dependency ratio of its types and the index of longevity, and to know The amount of labor force growth and its relative representation. To trace the phenomenon historically, the study took the historical approach between the years (1997-2023), as well as the descriptive approach in interpreting and analyzing the phenomenon, and its relationship with other phenomena, within the borders of the administrative territory of Ramadi District in Anbar, and adopted the 1997 census data for the beginning of the time period, and the field survey for the year 2023. The study sample consisted of (716) individuals (households), distributed as (453) in urban areas and (263) in rural areas. The study found that the demographic shift in the structure of the age structure was clear during the study period (1997-2023) in favor of the middle-aged group (14-64) and the elderly (65 and over), with an increase in their proportional representation at the expense of the young group (0-14) in 2023. Due to the decrease in fertility and the increase in the life span of the population, the study also revealed a decrease in the total dependency ratio and the dependency of the young due to a decrease in the relative representation of the dependent young group, an increase in the representation of the middle-aged group of breadwinners, and an increase in the dependency of the elderly and evidence of longevity. Due to the high proportional representation of the elderly group (65 and over) in the age structure. Due to the change in the structure of the age structure and the dominance of the middle-aged group (14-64) over the largest percentage of representation, the decline in the proportional representation of the young group (0-14) and the doubling of the proportional representation of the elderly group (65 and over) this shift contributed to the impact despite the change in its indicators, with a decrease in the proportion of dependency of young people and total dependency, and an increase in dependency of the elderly and the evidence of longevity, and to contain the rapid growth of the economically active forces and to achieve an acceptable level of development and not to waste this wealth of manpower, the decision-making bodies must take planning measures to advance economic activities and provide job opportunities in a way that this growth corresponds to achieve an advanced level of development.
demographic transition, age structure, grayscale, geographic, the population, dependency ratio
Societies are characterized by a shift in demographic characteristics, including a shift in the age structure of the population. It is influenced by social, economic and political factors specific to each society. Some countries are in a position to achieve (demographic gains) based on expectations of a boom in the numbers of the working-age population, including the study area. The study of the demographic transformation of the age structure of the population of Ramadi District in Anbar Governorate comes; Because it is linked to development efforts, which requires monitoring changes in the age structure, in order to establish a sound outlook to respond to future needs of the population. Because the positive demographic transformation of the population capable of working for any population could be a positive opportunity if it is invested, or it could be a burden and a drain on resources if it is not invested.
Most population societies are witnessing shifts in the age structure of their population, with a shift in size and relative distribution between groups in the age structure. Under the influence of social, economic and political factors, the study attempts to answer the following questions:
1) What are the characteristics of the age structure of the population of Ramadi District in 1997 and 2023?
2) What are the demographic changes in the structure of the age structure and its indicators, the dependency ratio and the index of longevity in 2023 for residents of Ramadi District?
3) What are the factors affecting the demographic transition in the age structure and its indicators?
2.1 Hypothesis
Since the general characteristic of population societies is a change in the structure of their age structure due to the influence of more than one factor (social, economic, political), and the weight of relative representation across these categories changes, the study therefore assumes:
1) There is a discrepancy in the demographic characteristics of the age structure between 1997 and 2023 for the residents of Ramadi District in Anbar Governorate.
2) There is a demographic shift in the structure of the age structure among population groups, and its indicators are the dependency ratio and the index of longevity in 2023 compared to 1997 in Ramadi District in Anbar Governorate.
This study sheds light on the characteristics of the age structure and its indicators, and attempts to link the demographic transition to the factors that affect it. Therefore, it aims to achieve the following:
1) Analysis of the demographic characteristics of the age structure of the population of Ramadi District for the years 1997 and 2023.
2) Analysis of the demographic shift in the age structure and its indicators for the population of Ramadi District in 2023 from the age structure of 1997.
3) Identifying the factors affecting the demographic shift in the age structure and its indicators during the period of the study.
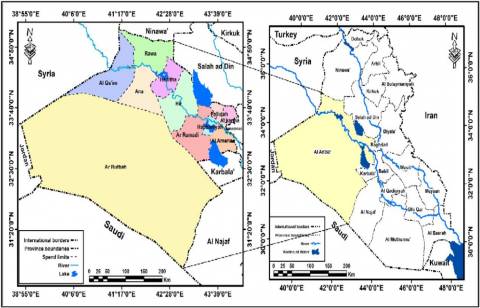
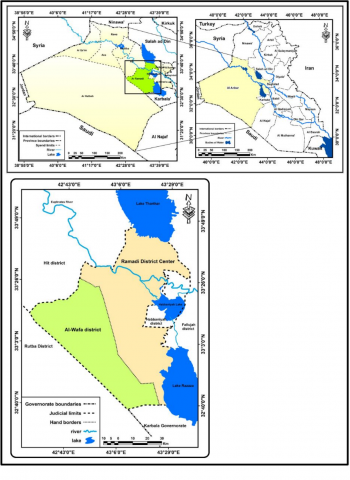
The study area was chosen as the Ramadi District in Anbar Governorate. It is located in the central part of Iraq and the eastern part of Anbar Governorate, between latitudes (25-32°) and (41-33°) north and longitudes (27-42°) and (38-43°) east, from the north it is bordered by Hit District and Lake Tharthar, from the east it is bordered by Fallujah District, from the south it is bordered by Karbala Governorate, and from the west it is bordered by Rutba District (Figures 1 and 2.)
Figure 1. Location of Anbar Governorate, Iraq
Figure 2. Location of Ramadi District, Anbar Governorate, Iraq
The study area covers an area of (6733km2), representing (4.9%) of the total area of the governorate, which is (137,808km2) (Central Bureau of Statistics, 2022). The reason for choosing this area is that it represents the administrative center of Anbar Governorate, and has a population weight exceeding half a million people. A quarter of the population of Anbar Governorate, which exceeded two million people according to 2023 estimates (Central Bureau of Statistics, 2023).
For the purpose of fully covering the research topic, the research was divided into an abstract, an introduction, three sections, results, and recommendations. Based on the above, the study attempts to analyze (the demographic shift in the age structure of the population of Ramadi District (1997-2023)) according to the following topics.
5.1 Residents of Ramadi District
5.1.1 Population growth
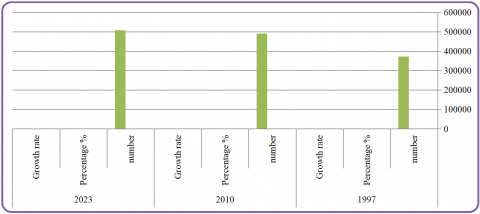
The population of Ramadi District developed progressively over time, as shown in Figure 3. Its population was 372,152 people in 1997, with a high population growth of 3.8% over 1987. Then it increased in 2010 to reach 491,700 people, with an annual growth rate of 2.2% and reached positive population growth, reaching 0.2% and reaching 507,421 people in 2023. The low growth is due to the separation of the Habbaniya District and its transformation to the level of a district in the administrative pyramid.
Figure 3. Numerical and relative distribution and growth rate of the population of Ramadi District for the period (1997-2023)
5.1.2 Environmental distribution (urban and rural)
There are many foundations and standards adopted in classifying regions and their inhabitants into urban and rural, and Iraq is one of the countries that adopted the administrative standard and municipal services as a basis for distinguishing between urban and rural areas [1]. Municipal services are considered the basis for classification [2].
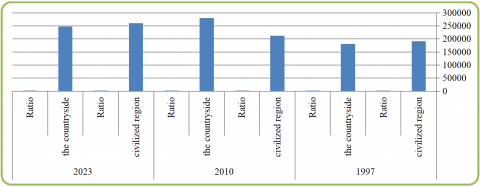
From Figure 4, the urban population reached 191,404 people in 1997, constituting 51.4% of the district's population, while the rural population constituted 48.6%, with a population of 180,748 people. In 2010, the proportion made up by the urban population decreased to 43.0%, and the proportion increased. The rural population increased to 57.0%. Despite this, the urban population increased to 211,734 people, and the rural population increased to 279,966 people. In 2023, the proportion of the urban population over the rural population increased to 51.2%, with a population of 260,019 people, while the proportion of the rural population decreased to 48.8%, with a population of 247,410 people.
Figure 4. Numerical and relative environmental distribution of the population of Ramadi District in Anbar Governorate for the period (1997-2023)
5.1.3 Average family size
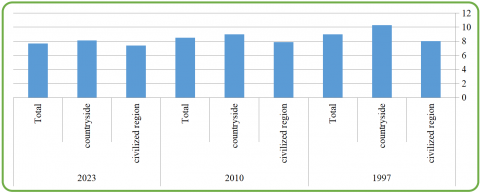
Family size means the number of its members, while the average family size is derived by dividing the total population by the number of families for the place in which the average family size is to be calculated. The average family size reflects changes in the demographic, political, economic and social aspects in each of its time periods. These factors, all or some of them, or individually, may stimulate the creation of shifts in population characteristics, the most important of which is fertility, which affects the average family size, whether it increases or declines. This effect varies temporally from year to year and varies spatially from one place to another. It is clear from Figure 5 and Table 1 that the average family size was high in 1997 in the urban and rural areas of Ramadi District and for the total. This can be explained by the extended family structure, whose influence continued until this period. For economic reasons related to the cost required for fission and building an independent family in addition to the social factor [3], after 1997 the decline in the average family size began and continued until 2023.
Figure 5. Average family size by environment (urban and rural) in Ramadi District during the period (1997-2023)
Table 1. Average family size by environment (urban and rural) in Ramadi District during the period (1997-2023)
|
Unity Administrative |
1997 |
2010 |
2023 |
||||||
|
Civilized Region |
Countryside |
Total |
Civilized Region |
Countryside |
Total |
Civilized Region |
Countryside |
Total |
|
|
Judiciary |
8 |
10.3 |
9 |
7.9 |
9 |
8.5 |
7.4 |
8.1 |
7.7 |
6.1 Demographic characteristics of age structure (1997-2023)
The age structure of the population is one of the demographic measures that shows the demographic specificity of society. It is considered one of the important elements in determining and crystallizing many demographic, economic and social variables [4] because age is one of the most important general characteristics of an individual that determines how he thinks, how he produces, and what it requires [5], which is one of the most important demographic factors indicative of the productive power of the population and the amount of their activity [6]. The age structure indicates the age status of the society, and their classification according to age groups and the age group to which they belong, and the structure varies. Ages between population groups, and vary over time from one period of time to another [7]. There are divisions into many categories according to the length of the category, and the best way to achieve the purpose of the research is the division into the main categories [8]: the juvenile category (0-14 years), the middle-aged category (adults) (15-64 years), then the elderly category (old people) (65 years and over).
1) Demographic characteristics of the age structure 1997.
The age composition of 1997 was affected by the educational, social, economic, health, and political conditions for approximately one hundred years before this date. This period witnessed fluctuation and was not at a certain level, with a period of decline before the middle of the last century, then development, then decline again during the economic blockade in the period the nineties of the last century, and the economic, educational, and political conditions were similar.
A- Percentage
2) Distribution of age structure groups in 1997.
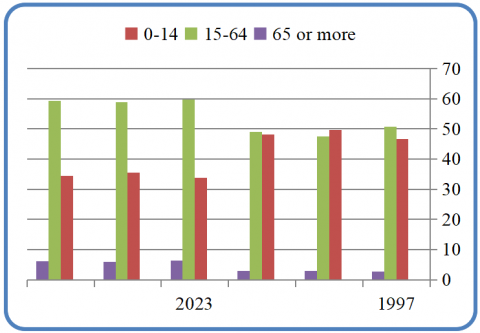
From Figure 3, which represents the relative distribution of age groups in Ramadi District, it appears to us that the young (0-14) and middle-aged (15-64) categories represented the largest percentage of the age structure, while the percentage of the elderly (65 and above) insignificant in 1997.
In urban areas, as shown in the percentage favored middle-aged people (15-64) at the expense of young people (0-14), with a relative difference of (4.1%), while the elderly group (65 and over) represented only a small percentage (2.7%). While the relative distribution in the countryside was in favor of the young group (0-14) at the expense of the middle-aged group (15-64), with a relative difference (0.7%), meaning that the two groups were very close in percentages. As for the elderly group (65 and over), their percentage was only (2.9%).
As for the relative division of the age structure of the total population in urban and rural areas, it showed close proportions between the two categories of young people (0-14) and middle-aged people (15-64), and the difference between them was only (1%) in favor of the middle-aged group (15-64). The elderly group (65 and over) maintained the lowest percentage in the age structure (2.8%).
The reasons for the high percentage of proportional representation of the young group (0-14 years) are due to several reasons, including social reasons, especially in a society that tends towards forming large families, and the influence of this group by the population policy of the state before this date, which supported the encouragement of childbirth, especially after 1978, and until the mid-eighties [9]. Another reason is the trend of the population after wars and crises towards completing marriage and childbearing projects, which increases the number of births that feed young people, which increases their percentage.
6.2 Dependency ratio in 1997
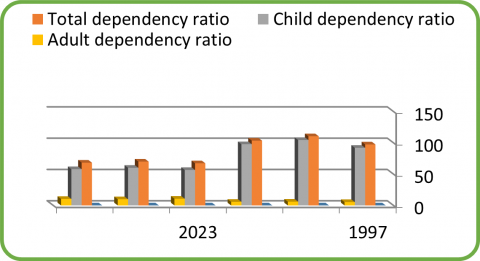
Dependency is a demographic phenomenon that reflects the relationship between the age groups of the age structure, and shows the size of the economic burden borne by the productive section of the population, which is the ratio of the population of the two categories (young (0-14) and the elderly (65 and over)) to every 100 of the middle class population. Age (15-64) years. It is clear from Figure 4 and that the total dependency ratio was high [10], coming in at (97.4, 110.5) in urban and rural areas, and it was (103.5) for total housing for the year 1997, respectively. Its increase is due to the increase in the proportion of the young group, and the proportion is higher in the countryside than in the urban areas, because the proportion of the dependent group among the young is higher, and in contrast the proportion of the middle-aged breadwinner group decreases.
As for the child dependency ratio, which is the ratio of the population of the young age group (0-14) to every 100 of the population of the middle age group (15-64) years [11], it was (92.0, 104.5, 97.8) in urban and rural areas and for their combination. respectively, it is high; Because the young group has a high demographic weight, both in size and relative to the total size of the population. As for the adult dependency ratio, which means the ratio of the population of the elderly (65 and over) to every 100 of the middle-aged population (15-64) years [12], it was low (5.4, 6.0, 5.7) in urban areas. And the rural and their groups, respectively, due to the low size and proportion of this group, which represents the demographic weight of the total size of the population, or what constitutes the middle-aged group (15-64) of the demographic weight of the total size of the population (see Table 2).
Table 2. Dependency ratio for children, adults, and college for the years 1997 and 2023
|
Unity Administrative |
1997 |
2023 |
||||
|
Civilized Region |
Countryside |
Total |
Civilized Region |
Countryside |
Total |
|
|
Total dependency ratio |
97.4 |
110.5 |
103.5 |
67.3 |
70.0 |
68.3 |
|
Child dependency ratio |
92.0 |
104.5 |
97.8 |
56.6 |
60.1 |
57.9 |
|
Adult dependency ratio |
5.4 |
6.0 |
5.7 |
10.7 |
9.9 |
10.4 |
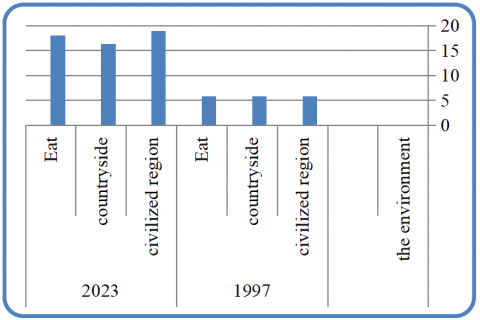
The aging index is a measure of the characteristics of the age structure. It measures the relationship between the elderly (65 years and over) and the young (0-14 years). The index is calculated by dividing the numbers of the elderly (65 years and over) by the numbers of the young (0-14). Then the result is multiplied by 100, and if the index percentage is less than 15%, the population is considered young, and if it is between 15% and 59%, the aging rate is average, but if it reaches 60% or more, the population is considered old [13]. From Figure 5 in 1997, we notice a decline in the index of urbanization, as it was (5.8) in urban and rural areas and for their combination. This percentage means that the population is young and youthful. This is due to the decrease in the percentage of elderly people (65 years and over), with an increase in the percentage of young people (0-14 years), and this leads to a decrease in the index of longevity.
7.1 Demographic characteristics of the age structure in 2023
A) Percentage distribution of age structure categories in 2023.
Figure 3, which represents the relative distribution of age groups in urban and rural Ramadi District and for the total, it appears to us that the proportion of the young age group (0-14) decreased in favor of the middle age group (15-64), while the proportion of the elderly (65 and over) is the lowest of the two categories, with a positive development in its percentage and doubling. In urban areas, as shown in Figure 6, the percentage favored middle-aged people (15-64) at the expense of young people (0-14), with a relative difference of (26.0%), while the elderly group (65 and over) represented a percentage of (6.4%). While the percentage distribution in the countryside was also in favor of the middle-aged group (15-64) at the expense of the young group (0-14), with a relative difference of (23.4%), meaning that the change is similar to that in urban areas. As for the elderly category (65 and over), its percentage was (5.8%).
Figure 6. Change in the percentage distribution by age structure categories for the years (1997-2023) in Ramadi District
As for the relative breakdown of the age structure of the total population, urban and rural, it also showed that the middle-aged group (15-64) outperformed the young group (0-14) by (25.0%), and the percentage of the elderly group (65 and over) remained the lowest in the age structure (6.2%).
There is a shift in the age structure of the population of Ramadi district, especially the young group (0-14 years), whose percentage has declined. This group is affected first, then the effect withdraws after a period of time towards the middle-aged and elderly groups. Its proportional representation is a reflection of the social, economic, and political conditions that its population has experienced, after 2003, which represents the occupation of Iraq, including wars and turbulent security conditions, all of which contribute to the pressure to reduce the birth rate, in addition to the prevailing global and Iraqi trend of declining fertility rate. Births decreased after 2003, for example, reaching 14.7 in 2007 and at a rate close to this number in the years that followed. Then the rate rose again after the end of the security turmoil after ISIS occupied the governorate, reaching 25.6 in 2018 and 30.0 in 2023 (Anbar Health Directorate, 2023). This will lead in the future to a return to the increase in the proportion of the young group and a decline in the proportion of the elderly group.
B) Dependency ratio in 2023.
Figure 4, which represent the dependency ratio for the year 2023, shows a decline in the total dependency ratio, the dependency ratio for children, and an increase in the dependency ratio for adults compared to the year 1997. Due to a decline in the demographic weight of the proportion of young people (0-14), and an increase in the demographic weight of the proportion of middle-aged people (15-64), as well as an increase in the demographic weight of the proportion of the elderly (65 and over) out of the total size of the population.
It is clear from Figure 7 that the total dependency ratio declined in 2023 to (67.3, 70.0, 68.3) in urban and rural areas and their total, respectively. Due to the decline in the percentage of young people and the increase in the percentage of middle-aged people, which are both sides of the equation by which the percentage is calculated, and the percentage exceeded in the countryside. Due to the high percentage of dependents among young people, and in contrast, the percentage of middle-aged breadwinners in the age structure decreases in urban areas.
Figure 7. Change in the dependency ratio for young people, the elderly, and college (1997-2023) in Ramadi District
As for the child dependency ratio, its percentage decreased from 1997 to (56.6, 60.1, 57.9) in urban and rural areas and their total, respectively, due to the decline in the percentage of young people and the increase in the percentage of middle-aged people out of the total size of the population, which are both sides of the equation for the ratio. As for the adult dependency ratio, it increased from 1997 and was (10.7, 9.9, 10.4) in urban and rural areas and their total, respectively. It is the only dependency whose percentage increased this year. Due to the increase and doubling of the proportion of the elderly group (65 years and over), despite the increase in the proportion of the middle-aged group (15-64) in the age structure of the population.
7.2 Index of aging in 2023
From Figure 8 and Figure 5 in the year 2023, we notice an increase in the urbanization index in urban and rural areas and their combination, compared to the year 1997. The percentage of urbanization index was average, as it exceeded 15% in urban and rural areas and their combined, and recorded (18.9, 16.4, 18.0) respectively. Due to the increase in the percentage of the elderly group (65 years and over) and its doubling, and the decrease in the percentage of young people (0-14 years) out of the total population, which are both sides of the equation for calculating the aging index, this contributes to raising the percentage of the aging index.
Figure 8. Change in the urbanization index according to environment for the years (1997-2023) in Ramadi District
8.1 Demographic shift in the age structure of the population of Ramadi District (1997-2023)
The demographic transition refers to historical changes in the demographic composition of a society, which occur over long periods of time, as there are no fixed demographic data in any society, especially over time, and not all demographic changes are negative in nature. On the contrary, the most important positive results are an increase in the extension of life, and the transition of the population structure from youth to old age, in most countries of the world. Because the trend in the demographic context is mainly towards population aging, which cannot be reversed. Low mortality and fertility rates, and high life expectancy (life expectancy). This is resulting from economic and social progress [14].
The main challenge lies in how to create a demographic balance between the size of the population and the state’s economic capabilities, that is, the ability to achieve a decent life for children and the economic requirements of society. This balance can only be completed by preparing for complete social demographic awareness of developing population policies that maintain the demographic balance, especially applying these policies with understanding. People recognize the utmost importance of these policies [15].
1) Shift in the relative distribution of age structure groups (1997-2023)
The demographic shift in the structure of the age structure in favor of the young, adult and elderly groups at the expense of the younger groups is a general natural trend in normal situations and cannot be reversed except under unnatural emergency conditions. The expansion of the middle part of the age structure indicates entry into the opportunity of the demographic gift. The expansion of the working-age population is higher than other groups [16].
From Figure 9 it is noted that the demographic shift in the relative composition of the age structure groups in urban and rural areas and their combination took two positive and negative trends. It was negative for the young group (0-14) and positive for the middle-aged group (15-64) and the elderly (65 and over). The proportion of the young age group (0-14) decreased by (12.8, 14.2, 13.7) respectively in urban and rural areas and for their total. While the proportion of the middle-aged group (15-64) increased by (9.1, 11.3, 10.3) respectively in urban and rural areas and for their total, the elderly group (65 and over) also had a positive shift, as its percentage increased (3.7, 2.9, 3.4) in urban areas. And the countryside and their combination, respectively.
Figure 9. Amount of relative shift in age structure categories (1997-2023)
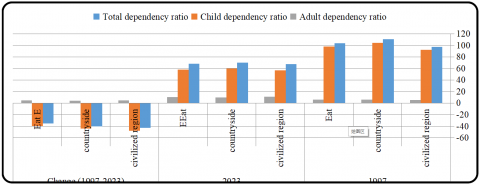
8.2 Shift in the dependency ratio (1997-2023)
The shift in the demographic weight in the structure of the age structure in favor of the young [17], adult, and elderly groups at the expense of the younger groups, is directly reflected and causes shifts in the dependency ratio, which rises and falls in proportion to the shifts between the age structure groups, and the dependency ratio is affected by the amount of movement in the demographic weight between the age groups of the population [18]. Within the age structure, its relationship is directly related to the categories of young people (0-14) and the elderly (65 and over), and inversely related to the category of middle-aged people (15-64).
From Figure 10, the change in the total dependency ratio and the dependency ratio of young people appears towards a decrease in urban and rural areas and for their combination, in the year 2023; This came mainly due to the decrease in the proportion of young people (0-14) and the increase in the proportion of the middle-aged group (15-64) in the age structure for the year 2023. The decrease in the proportion of young dependents is due to the trend towards preferring a small family on the one hand, and increasing the length of life due to the influence of health, economic and social development on the other hand [19], and this is a general natural trend. While the dependency ratio of the elderly was changing towards an increase; Due to the increase in the proportion of the elderly group in the age structure in 2023.
Figure 10. Change in the dependency ratio for children, adults, and college for the year (1997-2023)
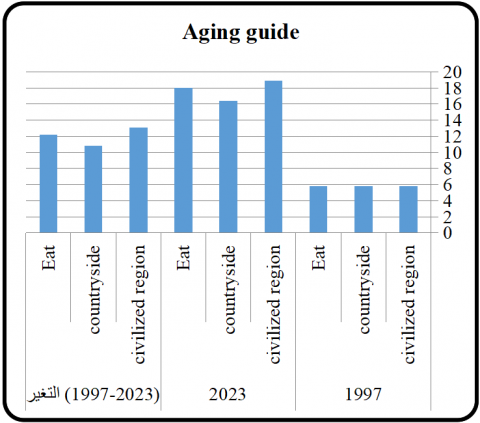
8.3 Transformation in the urbanization guide (1997-2023)
From Figure 11, which shows the amount of change in the urbanization index in the year 2023, the rate of urbanization index was moderate in urban and rural areas, exceeding 15% in their sum [20]. This positive change increased from the rate in 1997 by (13.1, 10.8, 12.2), respectively in urban areas. And the countryside and their combination; This is explained by the increase in the percentage of the elderly group (65 years and over), to increase their size representation of the total population, and this increases the percentage of the index of longevity [21]. Because the relationship between them is positive and positive, and the percentage of young people (0-14 years) is low. Because its representation in the total size of the population decreases, and this contributes to raising the percentage of aging evidence [22-28]. Because the relationship between them is inverse.
Figure 11. Transition in the urbanization index for the population of Ramadi District according to environment (urban, rural) for the years (1997-2023(
In conclusion, the research, through its three sections and the presentation and analysis of various official data included, the study reached a number of results that represent adequate answers to the main questions raised by the research problem, which were used to prove the validity of the research hypothesis, the most prominent of which are the following.
1) The proportional representation of the size of the age structure categories in 1997 was divided into approximately two halves, half represented by the middle-aged group (15-64), and the other half by the young (0-14) and (elderly 65 and over) categories.
2) A positive change appeared in the proportional representation in the age structure categories in 2023 in favor of the middle-aged group (15-64) and the elderly group (65 and over), and a negative change in the proportion of the young age group (0-14).
3) It became clear in 2023 that the largest demographic shift was represented by the young group (0-14), which lost more than 12% of its percentage. The largest positive demographic shift was in the middle-aged group (15-64), which gained more than 9%, and then the group of sselderly people (65 and over) by more than 3%.
4) The total theoretical dependency ratio will decrease in 2023 by more than 35%, and the dependency ratio for young people will be 40%. To decrease the proportional representation of the young group, and increase the proportional representation of the middle-aged group (15-64).
5) The elderly dependency ratio will increase in 2023. The proportional representation of the elderly group (65 and over) in the age structure has increased by more than double.
6) The study showed that the index of longevity will double more than twice in 2023. The proportional representation of the elderly group (65 and over) doubled and the proportional representation of the young group (0-14 years).
1) Accelerating decision-making by adopting a comprehensive development policy in all fields, and building a strategy aimed at increasing the benefit from the population opportunity during the coming period and investing in the increase of the population capable of working.
2) Involving residents in the decision-making process to ensure that policies meet their needs and aspirations.
3) Creating job opportunities through diversifying the economy, supporting small and medium-sized companies, and strengthening the link between education and the labor market.
4) Helping entrepreneurs, encouraging investment in new sectors, providing new job opportunities, and granting training, financing and guidance to small and medium-sized companies to increase their employment capacity.
Appendix (1)
Ministry of Higher Education and Scientific Research
Anbar University
College of Education for Human Sciences
Department of Geograph
The researcher (Muthanna Bashir Hamad, Iyad Muhammad Mukhlif) is conducting a field study for his research titled (Demographic Transition in the Age Structure of the Population of Ramadi District (1997-2023)), to kindly provide an accurate answer that requires a response. It is a study for the purposes of scientific research.
1) Urban: They are the population who live within the municipal boundaries of cities, such as the center of a district or the center of a district.
2) Rural population: They are the population who live outside the municipal boundaries of city centers, whether in villages or in the countryside.
1) Place of residence, family size, and gender composition.
|
Place of Residence |
Judiciary |
Civilized region |
Countryside |
Total Family Members |
Number of Males |
Number of Females |
|
Anbar |
Alramadi |
|
|
|
|
|
2) Age and gender structure according to the main age groups.
|
Category (0-14) Years Old) |
Category (15-64 Years) |
Category (65 Years and Over) |
|||
|
Number of males |
Number of females |
Number of males |
Number of females |
Number of males |
Number of females |
Appendix (2)
Numerical distribution of the age structure of the population of Ramadi District by environment and gender in 1997
|
The Environment |
Civilized Region |
Countryside |
The Total |
||||||
|
Category |
Males |
Females |
total |
Males |
Females |
total |
Males |
Females |
total |
|
0-14 |
45344 |
43857 |
89201 |
45567 |
44134 |
89701 |
90911 |
87991 |
178902 |
|
15-64 |
48984 |
47982 |
96966 |
42346 |
43526 |
85872 |
91330 |
91508 |
182838 |
|
≥65 |
2427 |
2810 |
5237 |
2372 |
2803 |
5175 |
4799 |
5613 |
10412 |
|
the total |
96755 |
94649 |
191404 |
90285 |
90463 |
180748 |
187040 |
185112 |
372152 |
Appendix (3)
Numerical distribution of the age structure of the population of Ramadi District by environment and gender in 2023
|
The Environment |
Urban |
The Countryside |
Total |
||||||
|
Category |
Males |
Females |
total |
Males |
Females |
total |
Males |
Females |
total |
|
0-14 |
631 |
613 |
1244 |
385 |
380 |
765 |
1016 |
993 |
2009 |
|
15-64 |
1109 |
1089 |
2198 |
639 |
633 |
1272 |
1748 |
1722 |
3470 |
|
≥65 |
120 |
115 |
235 |
63 |
63 |
126 |
183 |
178 |
361 |
|
the total |
1860 |
1817 |
3677 |
1087 |
1076 |
2163 |
2947 |
2893 |
5840 |
[1] Ayana, A.F.M. (2008). Population Geography, Foundations and Applications, 1st edition [Arabic] . Alexandria, Dar Al-Ma’rifa University.
[2] Abboud, H.G., Ali, B.B. (2023), Spatial analysis of drug crimes in the governorate of Anbar. Dirasat: Human and Social Sciences, 50(6): 116.
[3] Ismail, A.A. (1997). Foundations of demography and Its Geographical Applications (8th ed.) [Arabic] . Cairo: Dar Al-Thaqafa for Publishing and Distribution.
[4] Al-Bayati, N. (2013). [علم اجتماع السكان ؛ موضوعات في الديموغرافية الاجتماعية] Sociology of Population (1st ed.). Beirut: Dar Al-Jeel for Publishing, Printing and Distribution.
[5] Hussein, T. (1973). [نشأة مدن العراق و تطورها] The Origins and Development of the Cities of Iraq (1st ed.). Cairo: Arab Organization for Education, Culture and Science, Institute of Arab Research and Studies, Modern Art Press.
[6] Al-Rabi, A. (2022). Generation 2050: Turning Iraq’s demographic 'gift' into an economic window of opportunity. International Labour Organization. https://amjad rabi.com/portfolio/?utm_source=chatgpt.com.
[7] Al-Saadi, A.F. (2016). Population Studies in Geography and Demography (1st ed.). [Arabic] . Amman: Dar Al-Wadah. https://www.neelwafurat.com/itempage.aspx?id=lbb372885-369380&search=books.
[8] Al-Saadi, A.F. (2002). Population Geography: Part Two. [Arabic] . Baghdad: Dar Al-Kutub Directorate for Printing and Publishing. https://dr-abbasalsaadi.com/kutub.htm.
[9] Al-Saadi, A.F. (2013). The Population of Iraq: Studies in Its Demographic Foundations and Geographical Applications (1st ed.). [Arabic] . Baghdad: Ministry of Higher Education and Scientific Research, Al-Ghufran Printing Services. https://uomustansiriyah.edu.iq/books/20486.html.
[10] Al-Othman, B.A.A.O. (2000). Methods of using quantitative methods to measure the accuracy of the age structure of the population: An applied study of population censuses. Journal of the Iraqi Geographical Society, 44. https://iasj.rdd.edu.iq/journals/uploads/2024/12/21/54f6843313ff64f4948cf5247fa8bd80.pdf.
[11] Al-Issawi, F.M. (2001). Foundations of Population Geography (1st ed.). [Arabic] . Alexandria: University Knowledge House. https://www.firstbook.net/book.php?n=38759.
[12] Karadsheh, M.A. (2009). Social Demographics (1st ed.). [Arabic] . Amman: Modern World of Books. https://lib.univ-soukahras.dz/bib/16602.
[13] United Nations. (2022). World Population Prospects 2022: Summary of Results. https://www.un.org/development/desa/pd/content/World-Population-Prospects-2022.
[14] Central Statistics organization IRAQ. Geographical characteristics of Anbar Governorate. https://cosit.gov.iq/ar/?option=com_content&view=article&layout=edit&id=1203.
[15] Anbar Health Department. (2023). Birth data for the years 2007, 2018, and 2023. https://www.alanbar-health.com/.
[16] Department of Economic and Social Affairs. (2022). World Population Prospects 2022. United Nations. https://population.un.org/wpp/?utm_source=chatgpt.com.
[17] Trewartha, G.T. (1969). A Geography of Population: World Patterns. New York: John Wiley and Sons.
[18] Jifri, H. (2016). Finance and development. International Monetary Fund. 53(1). https://www.imf.org/external/pubs/ft/fandd/2016/06/index.htm.
[19] Mushref, Z.J., abd, A.H.W., Mikhlif, A.M., Abed, S.O. (2022). A cartographic representation of the characteristics of Al-Rutba district population. International Journal of Design & Nature and Ecodynamics, 17(4): 621-626. https://doi.org/10.18280/ijdne.170418
[20] Mikhlif, A.M., Kamel, O.F. (2021). The effect of wars on changing the average family size for the population of Anbar province (1977-2018) and its future expectations until 2028. Review of International Geographical Education Online, 11(3).
[21] Satam, A.T.M., Aldulaimi, A.M.K., Mushref, Z.J. (2022). Assessment of the water environment of the Euphrates River in the district of Fallujah. In AIP Conference Proceedings. AIP Publishing, 2400(1). https://doi.org/10.1063/5.0112622
[22] Satam, A.T.M., Mukhlef, W.H., Razzaq, A.S.A.A., Mushref, Z.J., Sulaiman, S.O. (2025). Spatial and temporal variations in water quality of the Euphrates River: A sustainable water management approach for Anbar Governorate, Iraq. International Journal of Design & Nature and Ecodynamics, 20(1): 99-106. https://doi.org/10.18280/ijdne.200111
[23] Tariq, B., Abbas, M., Arshad, Z., Kafi, M.A., Osman, N.H.B., Allumi, N.A., Abdul Rahim, M.K.I., Razalli, M.R.B. (2024). Exploring the impact of demographic factors on economic and sectoral dynamics: A comparative study of selected South Asian countries. International Journal of Sustainable Development and Planning, 19(10): 3949-3956. https://doi.org/10.18280/ijsdp.191023
[24] Andriyiv, N., Pushak, H., Petrukha, N., Kokhan, V., Shtangret, I. (2022). Transformation of threats to demographic security and sustainable development of the region due to increased military actions. International Journal of Sustainable Development and Planning, 17(7): 2221-2227. https://doi.org/10.18280/ijsdp.170722
[25] Sayel, J.J., Khalaf, A.M., Al-Bayati, A.H.I. (2025). Spatial distribution of some soil characteristics of Ramadi district, western Iraq. International Journal of Environmental Impacts, 8(1): 103-111. https://doi.org/10.18280/ijei.080111
[26] Ali, B.B., Globe, L.R., Salh, A.M. (2025). Analyzing directional urban sprawl from 1978 to 2023 using Shannon entropy analysis on landsat imagery: A case study in Ramadi City, Iraq. International Journal of Geoinformatics, 21(3): 62-70. https://doi.org/10.52939/ijg.v21i3.3995
[27] Ghadeeb, M. (2020). The planning problems and defects that accompanied the development of the basic plans for the city of Ramadi. Dirasat: Human and Social Sciences, 47(2) https://archives.ju.edu.jo/index.php/hum/article/view/107532.
[28] Mutar, Z.F., Hamad, N.S. (2024). Estimating long-term trends in elements and some phenomena of Iraq’s climate. Dirasat: Human and Social Sciences, 51(5): 33-54. https://doi.org/10.35516/hum.v51i1.10018