Almas Mukhametov*![]() | Eugenia Moreva
| Eugenia Moreva![]() | Madina Bayramli
| Madina Bayramli![]() | Artem Smirnov
| Artem Smirnov![]() | Igor Egorov
| Igor Egorov![]()
© 2025 The authors. This article is published by IIETA and is licensed under the CC BY 4.0 license (http://creativecommons.org/licenses/by/4.0/).
OPEN ACCESS
The aim of this research article is to develop and substantiate a SMART diversification strategy for the development of the Arabian Peninsula countries based on an analysis of their current national economic structure, global oil prices, and selected transformation strategies. The research methodology includes a quantitative analysis of time series from 1970 to 2023 for Saudi Arabia, Kuwait, Oman, and the United Arab Emirates, as well as a qualitative analysis of the correlation between oil prices and economic conditions. Within the framework of this study, new models and scientific approaches aimed at the sustainable development of non-resource sectors of the economy have been proposed, such as digital technologies, renewable energy, and tourism. Special attention is given to a comprehensive assessment of the impact of the proposed approaches on macroeconomic indicators and the economic resilience of the region, as well as on the adaptation of these models under conditions of global changes in capital and resource markets. To maintain political stability, it is essential to actively pursue a diversification policy focusing on increasing the share of renewable energy sources in the energy balance, enhancing food production, and advancing digital technologies and tourism.
green transition, innovation, non-oil development, region, resource dependence
In the contemporary rapidly changing global landscape, a national economy reliant solely on income from a single source is highly vulnerable, particularly when this income is derived from the exploitation of non-renewable resources. Simultaneously, the sustainable prosperity of an economy hinges on the successful implementation of an economic diversification strategy. Diversification is a fundamental element in the process of creating an attractive and thriving environment within a country, as well as in enhancing the quality of its institutions and the living standards of its citizens [1]. Numerous studies have demonstrated that abundant natural resources can negatively impact a country's economic growth [2-4]. The resource curse can arise for various reasons; however, the primary reason is that a country tends to concentrate all its productive resources in a single industry, such as mining or oil extraction while neglecting investments in other crucial sectors [5]. This term is often understood as weak growth in non-resource sectors of the economy [6].
The necessity for diversification in Arab oil-exporting countries is prompted by a paradigm shift regarding future prospects for global oil demand and an understanding of whether the oil industry will continue to generate sufficient rent in the future to sustain local economies and their extensive social welfare systems [7]. However, when examining the interplay between natural resources and the diversification of economic pathways, it is crucial to consider that export diversification serves as an optimal lever for harnessing the advantages of resource exploitation. Additionally, countries facing such challenges must address the root causes of structural vulnerability by reducing export concentration on a narrow range of commodities, thereby transforming the resource curse into a blessing [8]. Diversification of the energy balance has been recognized as the most important strategy for developing economies to achieve energy security goals and attain net-zero carbon emissions by 2050 [9, 10]. Economic diversification policies have garnered support among major commodity-producing countries due to numerous benefits, including macroeconomic stability, economic growth, job creation, increased private sector activity, and sustainable public finances. However, despite political interest in economic diversification, there is no single agreed-upon or accessible measure or index of economic diversification [11]. The success of economic diversification is a key factor in sustainable economic growth; thus, a country whose economy is solely reliant on natural resource revenues faces instability. Moreover, diversification creates jobs, reduces poverty, and enhances the quality of life and institutions [12].
Recently, the resource curse hypothesis has continued to evoke considerable debate regarding its causes and consequences [13-15]. However, there is a general consensus that this issue is closely linked to a broader approach to comprehensively understanding the complex relationship between natural resources and national economic policy. In this context, the present study primarily aims to provide a detailed reflection on the essence of the resource curse problem and to explore alternative solutions, using the economies of the Arabian Peninsula countries and potential non-oil development pathways for the region as a case study.
The utilization of the innovative potential of green hydrogen will play a crucial role in the countries of the Arabian Peninsula in the context of efforts to diversify economies, transition to sustainable energy, and combat climate change. In recent years, Saudi Arabia has been actively forming hydrogen alliances with countries capable of producing green hydrogen, in consideration of the broader global political, economic, and environmental agenda [16]. Additionally, the country has established Energy Production Centers, which aim to produce approximately 5 GW of hydrogen by 2025 [16].
The global transition to low-carbon energy presents critical challenges for oil and gas producers in the Middle East and North Africa (MENA) region, as the cyclical transformation exerts constant pressure on their development models, which largely rely on hydrocarbon revenue. Without economic reforms, this could lead to macroeconomic imbalances and ultimately jeopardize established social contracts and institutions within the region [17]. The sharp decline in oil prices that began in 2014 prompted these countries to initiate ambitious economic reform programs to enhance their economies' diversification, particularly through the development of sectors and industries alternative to those traditionally associated with resource-dependent economic systems [17].
As of 2022, the share of renewable energy adoption in the countries of the Arabian Peninsula accounted for only 0.15% of the total global installed capacity. Nevertheless, significant efforts are being made to achieve the stated energy goals by 2030, aiming for approximately 26%, with peak values of 50% in Saudi Arabia and 30% in the UAE and Oman [18]. Additionally, plans are being developed to add approximately 42.1 GW of solar photovoltaic capacity, which will increase the current installed renewable energy capacity by a factor of eight, reaching a total of 5.1 GW [18].
Numerous studies on the development issues facing oil-producing economies primarily focus on the implications of the global shift to low-carbon energy and the changes associated with economic diversification and the growth of low-carbon economies. However, a detailed examination of this issue reveals gaps in the existing body of knowledge regarding the current state of the Arabian Peninsula economies. Many of these countries have already taken significant steps toward diversifying their economic structures, a fact that often goes overlooked. Moreover, to maintain competitiveness, countries such as Saudi Arabia have been compelled to accelerate the diversification of their economies and develop projects within the context of sustainability concepts, such as "smart cities" and sustainable tourism, to achieve the goals of Vision 2030 and the United Nations Sustainable Development Goals [19]. Driven by its "Vision 2030" initiative, Saudi Arabia has embarked on the most ambitious and far-reaching transformation plan in its history. This transformation is fundamentally based on investments in and the development of artificial intelligence, as well as its integration into the new megacity Neom [20]. However, oil prices and international geopolitical risks adversely affect Saudi Arabia's diversification process in the short term, underscoring the urgent need for accelerated diversification [21].
Harnessing the potential of the non-oil economy requires substantial reforms in the labor market, business regulation, and fiscal management. The successful implementation of these reforms will contribute to a new cycle of economic development for the country [22]. However, at present, there is a lack of up-to-date data on the correlation between reform implementation and its successes with structural changes in the economy and society, as well as an assessment of the demographic trends and other factors influencing the market.
Climate change poses a significant threat to food security, particularly in the North Africa and Middle East region. Additionally, water scarcity is becoming a serious issue [23]. However, it may also present unexpected opportunities for Saudi Arabia and the United Arab Emirates, related to water resource management projects and desalination using renewable energy sources, as well as the promotion of sustainable agricultural practices [23].
In the 2000s, MENA countries focused on expanding non-oil sectors such as tourism, finance, industry, and education. Initially, they achieved an overall improvement in the economic performance of various non-oil sectors. This strategy primarily emphasized enhancing the role of the private sector, fostering human resource development, and increasing skills and knowledge among the population. However, reliance on the oil sector remains a pressing issue that needs to be addressed [24]. These studies have concentrated on the comparative analysis of a limited number of variables, which has hindered the identification of more serious economic problems faced by these countries related to their dependence on global oil prices. Moreover, the focus has generally been on examining the impact of natural resource rent, with diversification issues being limited to analyzing the dynamics of the share of value added in the industry as a percentage of GDP and domestic credit to the private sector as a percentage of GDP.
In contrast, over the past two decades, the role of the service sector in GDP formation has significantly increased. Notably, there has been substantial growth in tourism, the digital economy, and financial services. These areas have yet to receive adequate study in the context of examining diversification issues within the economies of the Arabian Peninsula. The qualitative aspects of economic development, particularly concerning labor productivity changes in comparison with OECD (The Organisation for Economic Co-operation and Development) countries, remain insufficiently explored. Additional research is needed to identify the main opportunities and challenges associated with the implementation of forward-looking diversification strategies, including financial, institutional, and social dimensions. The development of specific diversification models is of significant importance, particularly the creation and detailed description of original models of economic development diversification for the Arabian Peninsula countries that can be applied in practice.
From the perspective of political consequences, it is essential to prioritize economic diversification clearly. Strengthening the institutional framework and developing new forms of social contracts are crucial for supporting the diversification process [21]. The renewed focus on legal socialization today results from both the advancement of psychology and emerging social issues. Specifically, societal attention to this issue contributes to the creation of a viable and sustainable social order [25]. Currently, significant emphasis is placed on social relations affected during the diversification process, encompassing social norms, moral values, and perspectives [25].
Research on diversification indicators in resource-rich countries is often limited to analyzing resource dependence metrics, frequently overlooking social, political, and cultural aspects [6]. Therefore, an expanded approach to studying this issue is necessary. The aim of this research paper is to develop and justify a SMART diversification strategy for the development of Arabian Peninsula countries based on an analysis of their current national economic structures, global oil prices, and selected transformation strategies. The research objectives include examining contemporary approaches to the relationship between the availability of natural resources and economic development, as well as identifying theoretical gaps in addressing this issue. Furthermore, a more in-depth analysis is conducted of the institutional, political, and social aspects of resource dependence in the development of Arabian Peninsula countries and the leading directions for diversifying national economies. The analysis of the development of these countries encompasses a comprehensive set of demographic, economic, and social growth indicators. These indicators are utilized in conducting correlation and regression analyses to construct a model that assesses the dependence of these countries' economies on global oil prices and to forecast various scenarios for their future prospects.
3.1 Conceptual framework of the study
This study focuses on analyzing publicly available statistical data on the development of four countries in the Arabian Peninsula: Kuwait, Oman, Saudi Arabia, and the United Arab Emirates, which have been leading global oil producers in the region for over 50 years. The selection of these countries was motivated by the availability of necessary criteria for a qualitative comparative analysis. These criteria include close geographical proximity, significant influence within the oil industry economy, and similarities in political and cultural traditions.
3.2 Methodological design of the study
To develop and substantiate scientific approaches to the diversification of economic development, it is essential to examine contemporary theories of diversification, which constitutes the first stage of the study. The second stage involves reviewing the perspectives of researchers who have investigated these issues in the context of specific countries on the Arabian Peninsula and other regions of the world. The conceptual foundation for this research is grounded in the works of Al Naimi [1], Hassan [20], Lashitew et al. [6], and Shadab [24].
The third stage focuses on analyzing the trends and current state of development in these countries. Subsequently, models assessing the impact of global oil prices on Gross Domestic Product (GDP) will be developed, based on an analysis of their current economic structures and selected transformation strategies. Following this, it will be necessary to justify scientific approaches to the diversification of economic development for the countries of the Arabian Peninsula that can be practically applied.
The evaluation of the impact of the proposed approaches will center on key economic indicators, such as GDP, employment levels, investments in non-extractive sectors, and economic resilience. Identifying opportunities and challenges involves uncovering those related to the implementation of the proposed strategies, encompassing financial, institutional, and social aspects. The final stage will provide practical recommendations for policymakers, business leaders, and other stakeholders regarding the implementation of proposed measures for economic diversification.
3.3 Research materials
The data sources for this research are the statistical web resources of The World Bank Group (World Bank (2024). Data. Indicators. https://data.worldbank.org/indicator) and UNCTAD (UNCTAD (2024). General profile UNCTADstat. https://unctadstat.unctad.org/CountryProfile/GeneralProfile/en-GB/414/index.html) (United Nations Trade and Development), the Enerdata Yearbook (Energdata (2024). The Enerdata Yearbook, 2024. https://yearbook.enerdata.net/crude-oil/world-production-statistics.html), the Energy Institute's Statistical Review of World Energy (Energy Institute (2023). Energy Institute Statistical Review of World Energy. https://www.energyinst.org/statistical-review), and the IEA (IEA (2023). World Energy Outlook 2023. https://www.iea.org/reports/world-energy-outlook-2023).
The main time series variables analyzed include: oil production (in million tonnes), world crude oil average price (in \$/barrel), oil rents (as a percentage of GDP), total population, merchandise exports (in current US\$), GDP (in current US\$), GDP per capita (in current US\$), life expectancy at birth (in years), share of employment in 2000 (in percent), and GDP per person employed (in constant 2021 PPP\$). Additionally, indicators related to the structure of the economy, service exports, labor resources, the share of renewable energy sources, investments, capital accumulation, and inflation were also examined.
3.4 Methodological tools, formulas, and iterations
According to the studies by Kumar [26], Nguyen [27], O’Brien and Silcox [28], polynomial regression can be utilized to assess nonlinear dependencies. Polynomial regression is a distinct type of regression analysis in which the relationship between the independent variable (X) and the dependent variable (Y) is modeled as an n-th degree polynomial (1). For example:
$y=b_0+b_{1 x 1}+b_{2 x 1}{ }^2+b_{2 x 1}{ }^3+b_{n x 1}{ }^n$ (1)
In the equation, y represents the dependent variable, x denotes the independent variable, and n indicates the degree of the polynomial. The coefficients b0 – bn are the parameters that need to be optimized. During the regression analysis, an algorithm is employed to select several different models with varying values of h and k-fold cross-validation is conducted to determine which model yields the lowest mean squared error (MSE) on the test set (2).
$M S E=\frac{1}{n} \sum_{i=1}^n\left(y-\widehat{y}_l\right)^2$ (2)
In the equation, n is the number of observations, yi represents the actual values, and $\hat{y}_t$ represents the predicted values. For the calculation of regression models for forecasting, data from World crude oil, the average price (\$/barrel) was used as the independent variable (X), and GDP (current US\$) for each country was used as the dependent variable (Y). For each country, the selection of the polynomial equation (ranging from 2nd to 6th order) was conducted based on the comparison and analysis of the minimum MSE value. Data cleaning procedures were not applied, as no significant anomalous spikes were observed. The adequacy of the models was verified using Significance codes: * 0.1, ** 0.01, *** 0.001.
All calculations were performed in the integrated development environment (IDE) for the R programming language—RStudio 2024.04.2 Build 764—designed for statistical computing and graphics in the processing of scientific data.
3.5 Methodological research limitations
In selecting countries for this study, economic, political, and cultural aspects of country positioning, internal stability, and social well-being were taken into account. Consequently, countries such as Yemen, Qatar, and Bahrain are excluded from this research as they do not meet one or more specified criteria. The study utilized data from the period 1970 to 2023; however, specific data for the year 2023 were unavailable. Therefore, data from 2020, 2021, and 2022 were employed, which did not significantly impact the achievement of the study's objectives and goals.
In the 20th century, the growth of industrial oil production on the Arabian Peninsula and the subsequent increase in oil prices had a profound impact on the level and quality of life in Saudi Arabia, Kuwait, the United Arab Emirates, and Oman, facilitating more sustainable political, socio-economic, and cultural development in these countries. One notable indicator of improved living standards was the increase in life expectancy at birth, which was directly associated with rising revenues from oil sales due to the escalation of global prices since the early 1970s.
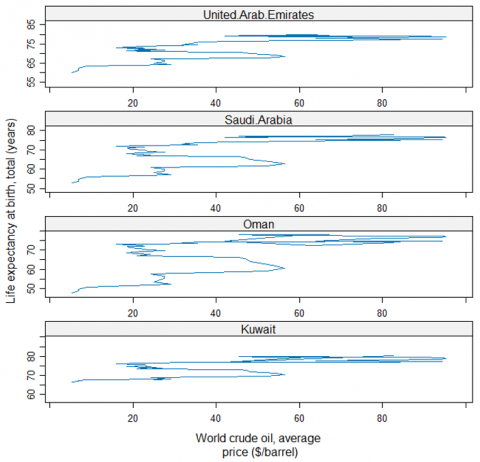
A comparison of life expectancy at birth in these countries from 1970 to 2022 reveals a positive correlation with the increase in global oil prices. The strongest correlation is observed in the United Arab Emirates (0.6939; p < .0001), where, compared to other countries, life expectancy at birth increased from 60 years to 79.2 years. Similarly, in Saudi Arabia (0.6247; p < .0001), life expectancy at birth rose from 52.7 years to 77.9 years. A statistically significant positive correlation is also evident in Kuwait (0.5908; p < .0001), where life expectancy at birth increased from 66.5 years to 80.3 years, and in Oman (0.5582; p < .0001), with an increase in life expectancy from 47.7 years to 73.9 years (Figure 1).
Figure 1. Dynamics of living standards (life expectancy at birth) and global oil prices (1970-2022)
Source: Compiled by the authors based on the analysis of data on the World Bank (World Bank (2024). Life expectancy at birth, total (years). https://data.worldbank.org/indicator/SP.DYN.LE00.IN)
In essence, these countries have managed to assert their exclusive economic right to obtain and utilize high natural rents for the initial acceleration of national development, modernization, and improvement of living standards. To this end, in September 1960, leading oil-producing countries established an international cartel known as the Organization of the Petroleum Exporting Countries (OPEC). The founding members included five countries: Iran, Iraq, Kuwait, Saudi Arabia, and Venezuela. As of 2024, the membership has expanded to 12 countries.
The primary objective of OPEC's activities has been to coordinate the oil policies of member countries to stabilize global oil markets and reduce price volatility. To achieve this, members of the organization agreed to ensure regular oil supplies to consumers and a stable income for producers by coordinating domestic production levels through the allocation of quotas for each country in the event of a sharp decline in global prices. Over the course of several decades, the role of OPEC has gradually transformed from the use of direct price cartel agreements to the application of more flexible tools for regulating the needs of the oil market and exploring new methods and avenues for diversification, within the context of adapting the economies of oil-producing countries to the demands of the anticipated energy transition.
However, history has shown that global politics and geopolitical tensions in the Middle East often exert a significant influence on pricing policies. A prime example is the oil crisis of the 1970s, triggered by an embargo on oil supplies to Western countries by Arab nations in response to their Middle Eastern policies. This situation resulted in a global price shock and simultaneously initiated mechanisms in many countries to reduce the energy intensity of oil production and consumption, as well as accelerated the search for alternative substitutes. Today, OPEC has effectively lost significant influence in the market due to the diversification of oil supplies to the global market and the increasing share of production and consumption of fuel derived from renewable and alternative energy sources.
As the analysis of global development indicates, oil producers have derived only short-term benefits from rising prices, simultaneously creating a high dependence of their economic well-being on the overall conditions of the global energy market, demand, and world prices. Furthermore, in these countries, the 1980s and 1990s witnessed a slowdown in growth in non-oil sectors of the economy, a phenomenon often referred to as the "resource curse."
Table 1. Correlation between oil production dynamics, world oil prices, and indicators of demographic and economic development (1970–2023)
|
Variable |
Year |
Oil Production (million tonnes) |
World Crude Oil, Average Price ($/barrel) |
Population, Total |
Merchandise Exports (Current US$) |
GDP (Current US$) |
GDP per Capita (current US$) |
||||||||
|
Kuwait |
Year |
— |
|
|
|
|
|
|
|
|
|
|
|
|
|
|
Oil production (million tonnes) |
0.39 |
** |
— |
|
|
|
|
|
|
|
|
|
|
|
|
|
World crude oil, average price ($/barrel) |
0.674 |
*** |
0.336 |
* |
— |
|
|
|
|
|
|
|
|
|
|
|
Population, total |
0.921 |
*** |
0.416 |
** |
0.691 |
*** |
— |
|
|
|
|
|
|
|
|
|
Merchandise exports (current US$) |
0.784 |
*** |
0.559 |
*** |
0.913 |
*** |
0.803 |
*** |
— |
|
|
|
|
|
|
|
GDP (current US$) |
0.879 |
*** |
0.561 |
*** |
0.876 |
*** |
0.9 |
*** |
0.976 |
*** |
— |
|
|
|
|
|
GDP per capita (current US$) |
0.803 |
*** |
0.509 |
*** |
0.921 |
*** |
0.728 |
*** |
0.945 |
*** |
0.931 |
*** |
— |
|
|
|
Oman |
Year |
— |
|
|
|
|
|
|
|
|
|
|
|
|
|
|
Oil production (million tonnes) |
0.91 |
*** |
— |
|
|
|
|
|
|
|
|
|
|
|
|
|
World crude oil, average price ($/barrel) |
0.674 |
*** |
0.403 |
** |
— |
|
|
|
|
|
|
|
|
|
|
|
Population, total |
0.97 |
*** |
0.874 |
*** |
0.616 |
*** |
— |
|
|
|
|
|
|
|
|
|
Merchandise exports (current US$) |
0.869 |
*** |
0.685 |
*** |
0.833 |
*** |
0.881 |
*** |
— |
|
|
|
|
|
|
|
GDP (current US$) |
0.901 |
*** |
0.72 |
*** |
0.775 |
*** |
0.939 |
*** |
0.981 |
*** |
— |
|
|
|
|
|
GDP per capita (current US$) |
0.903 |
*** |
0.714 |
*** |
0.889 |
*** |
0.877 |
*** |
0.967 |
*** |
0.955 |
*** |
— |
|
|
|
Saudi Arabia |
Year |
— |
|
|
|
|
|
|
|
|
|
|
|
|
|
|
Oil production (million tonnes) |
0.707 |
*** |
— |
|
|
|
|
|
|
|
|
|
|
|
|
|
World crude oil, average price ($/barrel) |
0.674 |
*** |
0.607 |
*** |
— |
|
|
|
|
|
|
|
|
|
|
|
Population, total |
0.996 |
*** |
0.715 |
*** |
0.684 |
*** |
— |
|
|
|
|
|
|
|
|
|
Merchandise exports (current US$) |
0.82 |
*** |
0.727 |
*** |
0.919 |
*** |
0.842 |
*** |
— |
|
|
|
|
|
|
|
GDP (current US$) |
0.892 |
*** |
0.715 |
*** |
0.775 |
*** |
0.919 |
*** |
0.929 |
*** |
— |
|
|
|
|
|
GDP per capita (current US$) |
0.822 |
*** |
0.751 |
*** |
0.875 |
*** |
0.842 |
*** |
0.937 |
*** |
0.953 |
*** |
— |
|
|
|
United Arab Emirates |
Year |
— |
|
|
|
|
|
|
|
|
|
|
|
|
|
|
Oil production (million tonnes) |
0.939 |
*** |
— |
|
|
|
|
|
|
|
|
|
|
|
|
|
World crude oil, average price ($/barrel) |
0.674 |
*** |
0.64 |
*** |
— |
|
|
|
|
|
|
|
|
|
|
|
Population, total |
0.948 |
*** |
0.917 |
*** |
0.755 |
*** |
— |
|
|
|
|
|
|
|
|
|
Merchandise exports (current US$) |
0.873 |
*** |
0.872 |
*** |
0.76 |
*** |
0.955 |
*** |
— |
|
|
|
|
|
|
|
GDP (current US$) |
0.916 |
*** |
0.907 |
*** |
0.792 |
*** |
0.981 |
*** |
0.988 |
*** |
— |
|
|
|
|
|
GDP per capita (current US$) |
0.727 |
*** |
0.741 |
*** |
0.847 |
*** |
0.708 |
*** |
0.723 |
*** |
0.754 |
*** |
— |
|
|
Significance codes: * 0.1, ** 0.01, *** 0.001
Source: Calculated by the authors based on Energy Institute (Energy Institute (2023). Energy Institute Statistical Review of World Energy. https://www.energyinst.org/statistical-review) and World Bank (World Bank (2024). Population, total. https://data.worldbank.org/indicator/SP.DYN.LE00.IN; World Bank (2024). Merchandise exports (current US\$). https://data.worldbank.org/indicator/TX.VAL.MRCH.CD.WT; World Bank (2024). GDP (current US\$). https://data.worldbank.org/indicator/NY.GDP.MKTP.CD; World Bank (2024). GDP per capita (current US\$). https://data.worldbank.org/indicator/NY.GDP.PCAP.CD)
Table 2. Oil: Total proved reserves
|
At end 2000 |
At end 2010 |
At end 2019 |
At end 2020 |
Share of Total, % |
R/P Ratio |
|
|
thousand million barrels |
thousand million barrels |
thousand million barrels |
thousand million barrels |
|||
|
Kuwait |
96.5 |
101.5 |
101.5 |
101.5 |
5.9 |
103.2 |
|
Oman |
5.8 |
5.5 |
5.4 |
5.4 |
0.3 |
15.4 |
|
Saudi Arabia |
262.8 |
264.5 |
297.6 |
297.5 |
17.2 |
73.6 |
|
United Arab Emirates |
97.8 |
97.8 |
97.8 |
97.8 |
5.6 |
73.1 |
|
Total Middle East |
696.7 |
765.9 |
836.0 |
835.9 |
48.3 |
82.6 |
|
Total World |
1300.9 |
1636.9 |
1734.8 |
1732.4 |
100.0 |
53.5 |
Source: Compiled by the authors based on Energy Institute (Energy Institute (2023). Energy Institute Statistical Review of World Energy. https://www.energyinst.org/statistical-review)
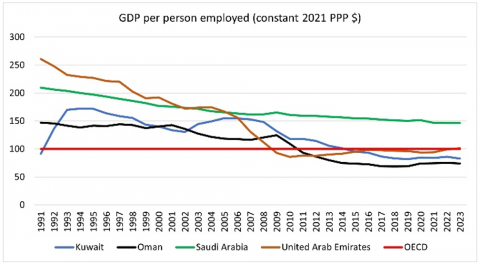
Figure 2. Percentage ratio of labor productivity based on the comparison of GDP per person employed (constant 2021 PPP\$) (1991-2023)
Source: Compiled by the authors based on information analysis World Bank (World Bank (2024). GDP per person employed (constant 2021 PPP\$). https://data.worldbank.org/indicator/SL.GDP.PCAP.EM.KD)
Over the past few decades, oil production in these countries has consistently increased, contributing to a rise in GDP per capita. However, this has also led to an increasing dependence of their sustainable economic development on the share of oil rents, which in certain years could exceed 50% of gross domestic product. In the early 21st century, the proportion of oil rent revenues in the economies of Kuwait reached 50.3%, Oman 44.5%, Saudi Arabia 41.7%, and the United Arab Emirates 20.8% (Appendix Tables 1-4). Additionally, long-term observations indicate a statistically significant direct correlation between oil production volumes, world prices, and economic development (Table 1).
At the same time, a stronger direct correlation is observed between oil production volumes and world oil prices in Saudi Arabia and the United Arab Emirates. This can be attributed to the high supply volumes from these countries in the global oil market. The economic and social well-being of the countries in the region still heavily relies on oil and its pricing.
Despite the significant economic successes achieved in these countries, the existing model of resource-based economic development has its limitations. Firstly, the high dependence on global markets and world oil prices has rendered their economies vulnerable to global trends and geopolitical risks. Secondly, the exhaustion of oil reserves in the long term, along with the shale revolution in the United States and the increase in oil production in other regions of the world, as well as measures to transition to renewable energy sources, have cast doubt on the prospects for future development.
On the other hand, as of the end of 2020, the total proven oil reserves in Kuwait amounted to 14.0 thousand million tonnes, or 5.9% of the world's total reserves; in Oman, approximately 0.7 thousand million tonnes, or 0.3%; in Saudi Arabia, 40.9 thousand million tonnes, or 17.2%; and in the United Arab Emirates, 13.0 thousand million tonnes, or 5.6% (Table 2).
If we additionally consider the ratio of reserves to production (R/P) as the volume of remaining reserves at the end of the year divided by the production in the reporting year, we can determine the duration of time for which oil can be produced at the current extraction rates. Based on the initial calculation date—2020—the R/P ratio for Kuwait is 103.2 years, for Oman 15.4 years, for Saudi Arabia 73.6 years, and for the United Arab Emirates 73.1 years.
It is also important to take into account the factor of rising extraction costs over time. As the reserves are depleted, the application of complex technologies and additional expenses are required, leading to a significant increase in production costs, which naturally impacts extraction volumes and shortens the operational lifespan of wells. Furthermore, these countries have essentially already passed their peak oil production, with many large fields nearing depletion. The global green transition towards renewable energy sources in many countries is also expected to contribute to a reduction in oil usage and demand, thereby lowering its world price.
Consequently, a discourse regarding future development has emerged in the oil-producing countries of the Arabian Peninsula, and state-level support has already been given to policies aimed at diversifying the economy and increasing revenues from the development of other sectors.
Table 3. Employment structure in the economy by main sectors
|
Sectors of the Economy |
Kuwait |
Oman |
Saudi Arabia |
United Arab Emirates |
OECD |
World |
|
|
Share of employment in 2000 (Percent) |
Services |
75.2 |
82.6 |
66.3 |
61.7 |
60.9 |
35.2 |
|
Industry (including construction) |
22.4 |
7.5 |
25.9 |
29 |
29.3 |
21.4 |
|
|
Agriculture, forestry, and fishing |
2.4 |
10 |
7.9 |
9.3 |
9.8 |
43.4 |
|
|
Share of employment in 2022 (Percent) |
Services |
72.9 |
47 |
80.2 |
69 |
73.1 |
49.7 |
|
Industry (including construction) |
25.2 |
46.9 |
16.9 |
29.6 |
22.3 |
23.9 |
|
|
Agriculture, forestry, and fishing |
1.9 |
6.1 |
2.9 |
1.4 |
4.7 |
26.4 |
|
|
Changes in the employment rate 2022 to 2000 (Percent) |
Services |
-2.3 |
-35.6 |
13.9 |
7.3 |
12.2 |
14.5 |
|
Industry (including construction) |
2.8 |
39.4 |
-9.0 |
0.6 |
-7.0 |
2.5 |
|
|
Agriculture, forestry, and fishing |
-0.5 |
-3.9 |
-5.0 |
-7.9 |
-5.1 |
-17.0 |
Source: Compiled by the authors based on information analysis World Bank (World Bank (2024). Employment in services (% of total employment) (modeled ILO estimate). https://data.worldbank.org/indicator/SL.SRV.EMPL.ZS; World Bank (2024). Employment in industry (% of total employment) (modeled ILO estimate). https://data.worldbank.org/indicator/SL.IND.EMPL.ZS; World Bank (2024). Employment in agriculture (% of total employment). https://data.worldbank.org/indicator/SL.AGR.EMPL.ZS)
Table 4. Key development indicators of leading oil-producing countries in the Arabian Peninsula achieved by 2023 (Separate data are provided for 2019*, 2020**, 2021***, and 2022**** hours)
|
Kuwait |
Oman |
Saudi Arabia |
United Arab Emirates |
|
|
Population |
|
|
|
|
|
Population size (million) |
4.31 |
4.64 |
36.95 |
9.52 |
|
Population growth (annual %) |
1.0 |
1.5 |
1.5 |
0.8 |
|
Urban population (% of total population) |
100.0 |
88.4 |
85.0 |
87.8 |
|
Population ages 15-64 (% of total population) |
74.4 |
70.2 |
71.4 |
82.9 |
|
Labor force |
|
|
|
|
|
Labor force (million) |
2.46 |
2.32 |
16.93 |
6.67 |
|
Labor force, female (% of total labor force) |
25.0 |
16.7 |
22.6 |
20.9 |
|
Unemployment, total (% of total labor force) (modeled ILO estimate) |
2.1 |
1.5 |
4.9 |
2.7 |
|
Proportion of seats held by women in national parliaments (%) |
3.1 |
0.0 |
19.9 |
50.0 |
|
Economic performance |
|
|
|
|
|
Inflation, consumer prices (annual %) |
3.6 |
0.9 |
2.3 |
4.8**** |
|
Level of GDP per capita (% of total OECD members) |
81.1 |
50.3 |
62.4 |
114.5 |
|
GDP growth (annual %) |
-2.2 |
1.3 |
-0.8 |
3.4 |
|
GDP (current US$ billion) |
161.8 |
108.2 |
1067.6 |
504.2 |
|
The share of the economy in the world (% of total) |
0.2 |
0.1 |
1.0 |
0.5 |
|
Services, value added (% of GDP) |
43.6**** |
44.5**** |
44.9 |
47.7**** |
|
ICT service exports (BoP, current US$ billion) |
5.2 |
0.3**** |
1.7 |
n. a. |
|
Insurance and financial services (% of service exports, BoP) |
14.7 |
2.3**** |
4.2 |
n. a. |
|
Renewable energy consumption (% of total final energy consumption) |
0.1*** |
0.1*** |
0.1*** |
1.0*** |
|
Control of Corruption: Percentile Rank |
59 |
58 |
64 |
83 |
|
Gross capital formation (% of GDP) |
24.6* |
22.4*** |
29.3 |
22.8** |
Source: Authors’ calculations based on data from multiple sources World Bank (World Bank (2024). Population, total. https://data.worldbank.org/indicator/SP.DYN.LE00.IN; World Bank (2024). Population growth (annual %). https://data.worldbank.org/indicator/SP.POP.GROW; World Bank (2024). Urban population (% of total population). https://data.worldbank.org/indicator/SP.URB.TOTL.IN.ZS; World Bank (2024). Population ages 15-64 (% of total population). https://data.worldbank.org/indicator/SP.POP.1564.TO.ZS; World Bank (2024). Labor force (million). https://data.worldbank.org/indicator/SL.TLF.TOTL.IN; World Bank (2024). Labor force, female (% of total labor force). https://data.worldbank.org/indicator/SL.TLF.TOTL.FE.ZS; World Bank (2024). Unemployment, total (% of total labor force) (modeled ILO estimate). https://data.worldbank.org/indicator/SL.UEM.TOTL.ZS; World Bank (2024). Inflation, consumer prices (annual %). https://data.worldbank.org/indicator/FP.CPI.TOTL.ZG; World Bank (2024). GDP growth (annual %). https://data.worldbank.org/indicator/NY.GDP.MKTP.KD.ZG; World Bank (2024). Services, value added (% of GDP). https://data.worldbank.org/indicator/NV.SRV.TOTL.ZS; World Bank (2024). ICT service exports (BoP, current US$ billion). https://data.worldbank.org/indicator/BX.GSR.CCIS.CD; World Bank (2024). Insurance and financial services (% of service exports, BoP). https://data.worldbank.org/indicator/BX.GSR.INSF.ZS; World Bank (2024). Renewable energy consumption (% of total final energy consumption). https://data.worldbank.org/indicator/EG.FEC.RNEW.ZS; World Bank (2024). Control of Corruption: Percentile Rank. https://data.worldbank.org/indicator/CC.PER.RNK; World Bank (2024). Gross capital formation (% of GDP). https://data.worldbank.org/indicator/NE.GDI.TOTL.ZS; World Bank (2024). Proportion of seats held by women in national parliaments (%). https://data.worldbank.org/indicator/SG.GEN.PARL.ZS)
The necessity for economic reforms and diversification of the economy in Kuwait, Oman, Saudi Arabia, and the United Arab Emirates is also driven by long-term negative trends in labor productivity relative to the average metrics of OECD member countries. In 1991, Kuwait's labor productivity was 91.7%, which increased to 140.2% by 2000, but declined to 82.7% by 2023. In Oman, the labor productivity was 147.2% in 1991, 140% in 2000, and decreased to 74.2% in 2023 (Figure 2).
At the same time, in Saudi Arabia and the United Arab Emirates, GDP per person employed (constant 2021 PPP\$) in 2023, despite a decrease compared to 1991 and 2000, exceeded the average level of OECD countries. This can largely be attributed to the policies aimed at diversifying the economy and developing high-tech industries that yield significant added value. For instance, the United Arab Emirates inaugurated the Barakah Nuclear Energy Plant in 2022 (Dubai Silicon Oasis (2024). Official web site. https://www.dso.ae/; Emirates Nuclear Energy Corporation (2022). Barakah Nuclear Energy Plant. https://www.enec.gov.ae/barakah-plant/), the first nuclear power plant in the Arab world, and constructed a unique urban ecosystem for a smart city based on artificial intelligence to support the development of innovative businesses and promote technological advancements. In Saudi Arabia, the National Investment Strategy (Saudi Vision 2030 (2024). Vision 2030 Annual Report 2023. https://www.vision2030.gov.sa/en/annual-reports) was adopted to facilitate economic diversification.
At the present stage, the economic policies of the Arabian Peninsula countries primarily focus on the implementation of large-scale programs and projects aimed at diversifying economic activities, as well as promoting the social and cultural development of human capital (Saudi Vision 2030 (2024). Vision 2030 Annual Report 2023. https://www.vision2030.gov.sa/en/annual-reports). This particularly concerns priority areas such as tourism and financial services, as well as the innovative digital sector of information and communication services and education. The highest percentage of employed workers in the economy was observed in the services sector. In Saudi Arabia and Kuwait, this figure was 80.2% and 72.9%, respectively, while the lowest was in Oman, where only 47% were employed in services. In the United Arab Emirates, this figure stands at 69%. These percentages are close to those of OECD countries (Table 3).
The second-largest sector in terms of employment share is Industry (including construction). Among the countries compared, the proportion of employment in this economic sector is highest in Oman, reaching 46.9%. In the United Arab Emirates, this figure stands at 29.6%, while in Kuwait it is 25.2%. In contrast, Saudi Arabia has a significantly lower share at 16.9%. Notably, from 2000 to 2022, the share of employment in the Industry (including construction) sector in Oman increased the most, rising by 39.4%. Meanwhile, in Saudi Arabia and the United Arab Emirates, employment in the Services sector experienced greater increases, at 13.9% and 7.3%, respectively. It is essential to highlight that capital returns in the modern digital economy are higher in the services sector, which generates the majority of added value. For instance, in recent years, the value added by Services as a percentage of GDP has been 43.6% in Kuwait, 44.5% in Oman, 44.9% in Saudi Arabia, and 47.7% in the United Arab Emirates. A weak point remains renewable energy, whose share in overall energy consumption is less than or equal to 1%, despite the announced programs for its development as part of economic diversification efforts (Table 4).
The group of countries under study also possesses significant potential for human capital development. In Kuwait, the urbanization rate is 100%, with the most demanded age category (15-64 years) comprising 74.4% of the population. The total labor force reaches 2.46 million individuals, including 25% women. Furthermore, the unemployment rate is one of the lowest in the region, standing at 2.1%, while inflation is recorded at 3.6%. The export of information and communication services amounts to $5.2 billion, with the share of insurance and financial services accounting for 14.7% of service exports (Balance of Payments).
Another example is Oman, which has an urbanization rate of 88.4%, where the age group of 15-64 years constitutes approximately 70.2% of the total population. The overall labor force reaches nearly 2.32 million individuals, with female employment at 16.7%. The unemployment rate is similarly low at 1.5%, and inflation is reported at 0.9%. However, the export of information and communication services is only $0.9 billion, and the share of insurance and financial services comprises a mere 2.3% of service exports (Balance of Payments).
In Saudi Arabia, the urbanization rate reaches 85%, with the age group of 15-64 years constituting 71.4% of the total population. The total labor force amounts to 16.93 million individuals, including a female employment rate of 22.6%. The unemployment rate stands at 4.9%, while inflation reaches 2.3%. The export volume of information and communication services is $1.7 billion, with the share of insurance and financial services accounting for 4.2% of service exports (Balance of Payments).
In the United Arab Emirates, the urbanization rate is 87.8%, and the age group of 15-64 years comprises approximately 82.9% of the total population. The overall labor force totals 6.67 million individuals, with female employment at 20.9%. The unemployment rate is 2.7%, while the inflation rate stands at 4.8%. Furthermore, gender policies are actively implemented to enhance women's participation in social and economic activities, with women holding 50% of the seats in the national parliament.
The United Arab Emirates has achieved the most diversified economic structure among the countries in the region. Compared to other nations, the export composition of goods and services demonstrates a more balanced approach to the development of various economic sectors and a reduced reliance on oil and its derivatives. The tourism sector plays a significant role in this diversification (Table 5).
Moreover, a significant portion of the country's export structure is occupied by industrial goods, which account for 29%. The tourism industry predominates in the export of services, comprising 39.1%, followed by transportation and logistics, with a share of 26.1%. Over the past two decades, the United Arab Emirates has established itself as a unique tourism and financial oasis in the Middle East region. Other forms of services, including financial and digital services, account for approximately 34.8%. The least diversified economy remains that of Saudi Arabia, where oil and its refined products constitute 74% of exports, and tourism dominates the services sector, accounting for 74.2%, while transportation and logistics represent 13.3%.
The economies of Oman and the United Arab Emirates, unlike other countries in the region, have a positive balance of services exports relative to imports. Additionally, the economic structure of these countries is the most diversified.
Overall, the national economies of the studied countries on the Arabian Peninsula still heavily depend on the global price dynamics of oil. This dependence varies significantly and exhibits predominantly nonlinear characteristics, as confirmed by the results of regression analysis and the derived polynomial equations (Table 6).
Table 5. Modern economic structure by main sectors (2023)
|
Kuwait |
Oman |
Saudi Arabia |
United Arab Emirates |
|
|
Services exports (millions of US$) |
11302.0 |
(e) 3682.0 |
48512.0 |
(e) 166150 |
|
Services imports (millions of US$) |
30402.0 |
(e) 11575.0 |
96011.0 |
(e) 109600 |
|
Export structure by product group in 2023 (% of total) |
||||
|
all food items |
8.0 |
5.0 |
– |
5.0 |
|
ores and metals |
– |
7.0 |
– |
5.0 |
|
fuels |
55.0 |
57.0 |
74.0 |
44.0 |
|
manufactured goods |
36.0 |
31.0 |
21.0 |
29.0 |
|
other |
2.0 |
0.0 |
5.0 |
16.0 |
|
Services exports by main category (as % of total services) |
||||
|
transport |
13.8 |
(e) 32.5 |
13.3 |
(e) 26.1 |
|
travel |
15.4 |
(e) 43.2 |
74.2 |
(e) 39.1 |
|
other services |
70.7 |
(e) 24.3 |
12.5 |
(e) 34.8 |
|
FDI inflows (millions of US$ unless otherwise specified) |
2112.74 |
4745.38 |
(k) 12319.04 |
30687.54 |
Source: Compiled by the authors based on information analysis UNCTAD (UNCTAD (2024). General profile UNCTADstat. https://unctadstat.unctad.org/CountryProfile/GeneralProfile/en-GB/414/index.html); e – Estimated; k – Asset/liability basis.
Table 6. Regression analysis of the dependence of GDP on global oil prices
|
|
The Equation |
R2 |
|
Kuwait |
Y = –15493.6644X4 + 2727569.3807X3 – 135492770.5039X2 + 3369322174.6109X – 12025232104.1423 |
0.7976* |
|
Oman |
Y = 2723035.5871X2 + 785326720.3438X – 8346106378.9186 |
0.6036* |
|
Saudi Arabia |
Y = – 2864733.7013X3 + 430752247.6509X2 – 8568646371.9732X + 99184261965.2251 |
0.6224* |
|
United Arab Emirates |
Y = –1383577.196X3 + 214958307.4883X2 – 4348605064.0201X + 45418608811.611 |
0.6463* |
Significance codes: * 0.1
Source: Authors' calculations.
Table 7. Forecast models for the dependence of GDP volume on potential declines in global oil prices
|
Scenario of Oil Price Decline Impact on GDP (Current US$), billion |
Actual GDP (Current US\$) in 2023 at an Average Global Price of \$70.78/barrel, billion |
|||
|
30.00 $/barrel |
35.00 $/barrel |
40.00 $/barrel |
||
|
Kuwait |
28.2 |
33.6 |
40.9 |
161.8 |
|
Oman |
17.7 |
22.5 |
27.4 |
108.2 |
|
Saudi Arabia |
152.5 |
204.1 |
262.3 |
1067.6 |
|
United Arab Emirates |
71.1 |
97.2 |
126.9 |
504.2 |
Source: Authors’ calculations.
For Kuwait, a nonlinear dependence was established with a coefficient of determination R2 0.7976, indicating that the model was best approximated by a fourth-degree polynomial equation, given the lowest mean squared error (MSE) of the test. This model demonstrates that Kuwait's GDP depends on global oil prices by 79.7%. A similar second-degree polynomial model with a coefficient of determination of 0.6036 was derived for Oman, explaining the dependence of its GDP on global oil prices at 60.3%. For Saudi Arabia and the United Arab Emirates, a third-degree polynomial model was obtained, yielding coefficients of determination of 0.6224 and 0.6463, respectively, which account for 62.2% and 64.6% of the GDP dependence on global oil prices.
Using the derived polynomial equations to assess potential risks, forecast models were constructed to analyze the dependence of GDP on global oil prices for Kuwait, Oman, Saudi Arabia, and the United Arab Emirates. The forecast is based on an approach that considers three possible scenarios for declining oil prices. According to the first realistic scenario, the average global price per barrel of oil is expected to decrease to $40 by 2030, driven by a green transition towards renewable energy sources in many countries and the widespread trend of moving away from internal combustion engine transportation (Table 7).
As a result of these events, the anticipated effect of falling oil prices, in the absence of targeted actions for the diversification of national economies and positive outcomes, will lead to a significant and poorly controlled decline in GDP (current US\$) in Kuwait to \$40.9 billion, in Oman to \$27.4 billion, in Saudi Arabia to \$262.3 billion, and in the United Arab Emirates to \$126.9 billion. This downturn will have a multiplicative effect across all sectors of the local economies and the Middle Eastern region as a whole. Such a decline will substantially reduce the standard of living in these countries and adversely affect the socio-economic prospects for future development.
The pessimistic scenario anticipates a decrease in the average global price of oil per barrel to \$35 due to the convergence of several crisis phenomena, including a global economic downturn, depletion of available oil reserves, and widespread abandonment of oil usage. In this case, a severe contraction of GDP (current US\$) to levels seen in the early 2000s is possible. The crisis scenario foresees a reduction in the average global price of oil per barrel to \$30 or lower. This scenario could arise from a global conflict leading to the disruption of maritime logistics, resulting in a loss of demand, a retreat from globalization, and the internal clustering of regions around the globe.
The countries discussed in these scenarios have already begun to systematically implement SMART diversification strategies for their national economies. These strategies are based on several key directions: renewable energy, artificial intelligence and digital technologies, biotechnology, water management, food production, tourism, the construction of sustainable modern cities, and financial services. Among the most ambitious economic diversification projects are Saudi Vision 2030, the Dubai Future Foundation, Kuwait Projects, and Oman's Net Zero Emissions 2050 initiative.
Alternative economic strategies for selecting the future development trajectory of the countries on the Arabian Peninsula may be linked to the development of solar and hydrogen energy, desalination, and food production based on innovative technologies such as aquaculture, hydroponics, vertical farming, and irrigated agriculture. Moreover, the development of the digital economy and the cryptocurrency market could provide an additional alternative to the existing strategies for diversifying local economies, which have long been based on approaches to developing tourism, finance, and logistics.
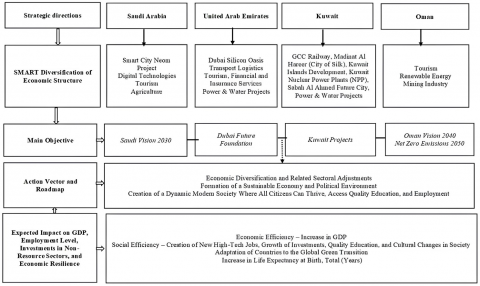
Additionally, since the late 20th century, Saudi Arabia has launched a food program aimed at establishing agricultural farms in the desert. Today, the country actively produces vegetables, fruits, and grains, as well as engages in livestock farming. It is important to note that domestic vegetable production covers nearly 100% of local demand. Following Saudi Arabia's example, Kuwait and the United Arab Emirates have also begun to develop oasis agriculture. However, the most significant transformations are occurring in the fields of social culture, digital technologies, and renewable energy. For instance, the implementation of Vision 2030 aims to create a dynamic modern society in which all citizens can thrive, pursue their passions, and access quality education and high-tech job opportunities (Figure 3).
The author's approach is founded on the idea of creating a high-quality social infrastructure and a modern society that values ecology, cultural traditions, national pride, and amenities while embodying the spirit of contemporary Islam and providing effective, inclusive services. An essential component of this program is the development of tourism infrastructure, education, science, and technology parks alongside the green transition and renewable energy initiatives. The successful implementation of these projects will provide feedback to the action vectors and roadmap, allowing for adjustments or enhancements that account for internal and external trends, thereby ensuring the sustainability of political and economic development in these countries.
The total estimated value of active investment projects aimed at diversifying the economy in Kuwait is approximately $234.4 billion. Five major projects are specifically highlighted: the GCC Railway, Madinat Al Hareer (City of Silk), Kuwait Islands Development, Kuwait Nuclear Power Plants (NPP), and Sabah Al Ahmed Future City. The economic diversification policy of the United Arab Emirates is articulated in the Dubai Future Foundation program, which outlines five key uncertainties for the future and their implications for growth, prosperity, and well-being. Oman has focused its efforts on becoming a regional hub for the development of the green hydrogen industry, taking necessary steps following the establishment of goals within its Net Zero Emissions 2050 national program.
Figure 3. Analysis of the goals, roadmap, and effectiveness of proposed SMART diversification strategies
Source: Author's development based on analysis Dubai Future Foundation (Dubai Future Foundation (2024). Future Opportunities Report: The Global 50. https://www.dubaifuture.ae/wp-content/uploads/2024/03/The-Global-50-2024-Eng.pdf), MEED Projects (MEED Projects (2024). Kuwait Projects. https://www.meedprojects.com/Countries/kuwait-projects-overview/), Ministry of Energy and Minerals (Ministry of Energy and Minerals (2024). Annual Report 2023. Committed to Sustainable Development. https://mem.gov.om/Portals/0/MEM%20Annual%20Report%202023%20-.pdf), and Saudi Vision 2030 (Saudi Vision 2030 (2024). Vision 2030 Annual Report 2023. https://www.vision2030.gov.sa/en/annual-reports)
Overall, the implementation of economic diversification projects is also transforming the social and cultural paradigms of development in the societies of the countries examined in this study, facilitating their greater integration into the contemporary globalized world while preserving national identity through enhanced levels and quality of life, education, and access to innovative technologies. For policymakers, business leaders, and other stakeholders involved in the proposed diversification projects and strategies, it is crucial to consider not only economic benefits. Attention should also be given to the preservation and enhancement of social, cultural, and environmental standards, as well as improving life expectancy at birth as an important indicator of the effectiveness of these programs. Furthermore, emphasis must be placed on food and water security, the development of oasis agriculture, and fresh water production.
Many studies emphasize the significant growth of GDP, including GDP per capita, as a progressive achievement in the development of the countries of the Arabian Peninsula over the past half-century, driven by oil exports. At the same time, there has been an increase in resource dependence. However, the productivity metric has received insufficient attention; this lack of focus has resulted in substantial lagging of the region's countries in comparison to OECD nations due to their continued reliance on raw materials and narrow specialization. Another aspect of this issue is that, despite the high share of the service sector in the economy, the countries of the Arabian Peninsula have yet to establish a sufficiently efficient and more resilient modern diversified economy, one that would not be adversely affected by fluctuations in global oil prices. The underlying reason for this situation is of an institutional nature. A focus solely on tourism and the financial sector, without the development of the digital economy, will not resolve the existing developmental challenges facing the region.
This research has led to the understanding that economic diversification is the best strategy for adapting the countries of the Arabian Peninsula to the global transformations in the world economy associated with the green transition. This notion is also corroborated by other studies. For instance, the current energy transition in these countries is driven by the greater environmental competitiveness of renewable energy sources, ongoing efforts to diversify the economy, and a commitment to sustainability. These three factors constitute a crucial part of the motivation for oil-producing countries in the Gulf to diversify their energy sources through alternative energy projects, reduction of subsidies, and measures to enhance energy efficiency [29].
The primary challenges continue to lie in transforming the rent from natural resources into a driver of growth rather than an inhibitor, focusing on the causal relationships between total natural resource rent and economic development [4]. This is exemplified by the case of Oman. Given the limited oil and gas resources in comparison to its neighbors, energy diversification has been a stated objective of Oman since at least the 1980s. However, due to the structure of electricity production in the country, issues of economic diversification and energy security have become closely intertwined and cannot be separated without a fundamental resolution to this matter [30]. Furthermore, diversification through an increased share of renewable resources in the energy sector will promote inclusive development, positively impacting political stability. Conversely, non-renewable resources exhibit a negative correlation with economic growth, primarily due to their vulnerability to fluctuations in global prices and their tendency to consolidate power and foster corruption [13].
Another example pertains to the challenges facing Oman's tourism industry. Poor infrastructure and services, limited accessibility, and underdeveloped accommodation facilities hinder its growth and prosperity. Addressing these issues requires coordinated efforts from both the government and the private sector, alongside the decentralization of the market for these services. Initiatives aimed at enhancing the significance of the tourism industry and creating job opportunities for Omanis must be implemented [31].
Diversification can also play a crucial role in the political transformation of a conservative political structure into a more modernist one. In the 21st century, Saudi Arabia has begun to adopt a more contemporary and moderate approach in both its domestic and foreign policies, moving away from conservatism and traditionalism. This shift is attributed to the Saudi reform agenda, which has significantly impacted the social, cultural, and religious dimensions of the country. As a result, the authority of the Saudi monarchy has been reinforced. The implementation of Saudi Vision 2030 has led to substantial changes, including a transition towards modernist policies in social, political, and religious matters. Examples of these changes include increased freedoms for women, reduced dependency on oil in economic policy, the development of tourist attractions and entertainment venues, and the provision of greater equality in education and employment opportunities for citizens [32].
The social impact of diversification on the population may manifest in the creation of new jobs, gender changes, and social mobility. This can already be observed in the case of Saudi Arabia, which has undertaken legislative and legal reforms in recent years aimed at empowering women, facilitating their effective participation in the country's affairs, and removing barriers to their involvement in national development initiatives. Additionally, initiatives are being developed to encourage investments in Saudi women and their education, aligning with the objectives of Vision 2030 [33]. A World Bank report highlights a significant increase in women's participation in the labor force in Saudi Arabia, primarily attributed to the government's diversification policy, which also encompasses expanding employment opportunities [34].
This study has revealed the issue of the resource curse for four oil-rich countries on the Arabian Peninsula—Saudi Arabia, Kuwait, the UAE, and Oman—over the period from 1970 to 2023. The findings indicate that, owing to high oil prices, the standard of living in these countries has significantly improved over several decades. However, the persistent high dependence of their economies on revenues generated from the sale of natural resources remains a primary factor that continues to exert a negative influence on the Arabian Peninsula nations and hampers their progress towards achieving the Sustainable Development Goals. This is evidenced by the widening productivity gap between these countries and OECD nations.
Since the 2000s, a decline in labor productivity relative to the average for OECD countries has been observed across all studied nations. In 1991, Kuwait's labor productivity stood at 91.7%, which rose to 140.2% by 2000, yet decreased to 82.7% by 2023. In Oman, labor productivity was 147.2% in 1991, 140% in 2000, and declined to 74.2% in 2023. In Saudi Arabia and the United Arab Emirates, despite a decrease compared to the figures from 1991 and 2000, labor productivity in 2023 still exceeded the average level of OECD countries. If these developmental trends persist in the region's economies without significant structural transformations, the level of economic underperformance may escalate to a critical threshold, making it increasingly difficult to overcome in the medium term.
According to the author’s regression analysis, it has been established that the gross domestic product (GDP) in the studied countries is significantly dependent on oil prices. This analysis facilitated the development of polynomial equations for assessing potential risks associated with declining prices. Forecast models of GDP dependency on global oil prices have been constructed for Kuwait, Oman, Saudi Arabia, and the United Arab Emirates. Kuwait is characterized by a fourth-order polynomial model, indicating that its GDP is 79.7% dependent on global oil prices. A similar second-order polynomial model for Oman explains 60.3% of its GDP dependency on global oil prices. For Saudi Arabia and the United Arab Emirates, a third-order polynomial model accounts for 62.2% and 64.6% of the GDP dependency on global oil prices, respectively.
The forecasting approach is based on three potential scenarios of falling oil prices: realistic, pessimistic, and crisis. In all scenarios, the economies of these countries are anticipated to face economic and social collapse, alongside an increase in political instability. To mitigate these negative phenomena, it is essential to implement a more proactive diversification policy, focusing on increasing the share of renewable energy sources in the energy balance, enhancing food production, and developing digital technologies and tourism.
This study's theoretical implications lie in expanding the discourse regarding the justification of promising directions for diversification development in the region. It is asserted that the advancement of the tourism and financial sectors alone will not resolve all existing issues faced by the countries of the Arabian Peninsula. Priority should be given to SMART diversification strategies grounded in the development of the digital economy.
The implementation limitations of this study were related to the restricted number of questions that could be explored concerning diversification, despite the availability of a vast collected database. Therefore, future research efforts on this topic should focus on analyzing the effectiveness of the proposed diversification strategies through the development of multifactor models. Additionally, forthcoming studies should pay particular attention to evaluating the impact of the proposed models on key economic indicators such as GDP, employment levels, investments in non-extractive sectors, and overall economic resilience.
Appendix Table 1. Dynamics of the development of the oil industry in Kuwait, global prices, economic, and demographic indicators
|
Year |
Oil Production, million tonnes |
World Crude Oil, Average Price ($/barrel) |
Oil Rents (% of GDP) |
Population, Total |
Merchandise Exports (current US$) |
GDP (current US$) |
GDP per Capita (current US$) |
|
1970 |
151.8 |
5.21 |
34.9 |
802,786 |
1693,000,000 |
2873,638,851 |
3,580 |
|
1971 |
162.5 |
6.92 |
36.7 |
858,734 |
2507,000,000 |
3880,392,195 |
4,519 |
|
1972 |
167.3 |
6.83 |
42.0 |
913,785 |
2989,000,000 |
4450,537,925 |
4,870 |
|
1973 |
153.8 |
9.09 |
47.7 |
970,527 |
3815,000,000 |
5408,804,607 |
5,573 |
|
1974 |
129.9 |
29.16 |
70.8 |
1,030,426 |
10963,000,000 |
13006,948,296 |
12,623 |
|
1975 |
106.3 |
24.96 |
62.1 |
1,095,998 |
9184,000,000 |
12022,811,621 |
10,970 |
|
1976 |
109.9 |
27.48 |
63.8 |
1,168,791 |
9846,000,000 |
13132,252,802 |
11,236 |
|
1977 |
100.8 |
27.47 |
58.7 |
1,247,225 |
9754,000,000 |
14137,406,741 |
11,335 |
|
1978 |
108.8 |
24.30 |
59.3 |
1,329,074 |
10427,000,000 |
15503,557,496 |
11,665 |
|
1979 |
129.6 |
52.22 |
n. a. |
1,412,266 |
18404,000,000 |
24749,063,923 |
17,524 |
|
1980 |
86.8 |
56.53 |
67.0 |
1,493,870 |
19663,000,000 |
28638,868,356 |
19,171 |
|
1981 |
58.6 |
54.34 |
46.2 |
1,573,026 |
16044,000,000 |
25058,020,338 |
15,930 |
|
1982 |
42.7 |
51.53 |
32.5 |
1,652,921 |
10864,000,000 |
21577,153,356 |
13,054 |
|
1983 |
55.0 |
48.09 |
42.1 |
1,736,028 |
11504,000,000 |
20871,081,080 |
12,022 |
|
1984 |
60.7 |
47.35 |
43.9 |
1,813,986 |
11623,000,000 |
21700,082,753 |
11,963 |
|
1985 |
55.5 |
45.54 |
34.9 |
1,888,975 |
10597,000,000 |
21445,970,614 |
11,353 |
|
1986 |
59.4 |
20.90 |
26.0 |
1,968,093 |
7383,000,000 |
17903,989,745 |
9,097 |
|
1987 |
52.1 |
24.12 |
23.6 |
2,048,477 |
8264,000,000 |
22368,704,134 |
10,920 |
|
1988 |
63.0 |
18.37 |
26.1 |
2,129,153 |
7661,000,000 |
20690,322,153 |
9,718 |
|
1989 |
68.4 |
22.40 |
33.6 |
2,210,013 |
11476,000,000 |
24313,855,653 |
11,002 |
|
1990 |
46.8 |
27.67 |
38.9 |
1,674,938 |
7042,000,000 |
18427,777,778 |
11,002 |
|
1991 |
9.2 |
23.65 |
13.2 |
1,339,500 |
1088,000,000 |
11009,993,703 |
8,219 |
|
1992 |
54.0 |
22.79 |
28.1 |
1,620,633 |
6571,000,000 |
19858,555,215 |
12,254 |
|
1993 |
96.6 |
19.51 |
39.4 |
1,653,645 |
10248,000,000 |
23941,391,391 |
14,478 |
|
1994 |
103.4 |
18.97 |
36.6 |
1,641,106 |
11260,000,000 |
24848,483,838 |
15,141 |
|
1995 |
104.9 |
18.69 |
36.2 |
1,655,222 |
12785,000,000 |
27186,980,647 |
16,425 |
|
1996 |
105.1 |
22.65 |
40.1 |
1,703,318 |
14889,000,000 |
31492,373,309 |
18,489 |
|
1997 |
105.1 |
22.31 |
38.4 |
1,761,468 |
14224,000,000 |
30350,190,704 |
17,230 |
|
1998 |
110.0 |
15.90 |
27.9 |
1,819,544 |
9554,000,000 |
25943,705,784 |
14,258 |
|
1999 |
102.6 |
22.42 |
33.9 |
1,877,427 |
12164,000,000 |
30122,365,849 |
16,044 |
|
2000 |
109.9 |
35.48 |
50.3 |
1,934,901 |
19436,000,000 |
37718,743,480 |
19,494 |
|
2001 |
106.5 |
31.80 |
42.8 |
1,991,674 |
16203,000,000 |
34889,559,870 |
17,518 |
|
2002 |
98.8 |
32.94 |
37.2 |
2,047,364 |
15369,000,000 |
38135,788,414 |
18,627 |
|
2003 |
115.6 |
36.30 |
39.8 |
2,101,506 |
20678,000,000 |
47874,582,232 |
22,781 |
|
2004 |
123.3 |
44.38 |
46.1 |
2,153,481 |
28599,000,000 |
59439,090,601 |
27,601 |
|
2005 |
130.4 |
60.88 |
53.3 |
2,235,403 |
44869,000,000 |
80798,630,137 |
36,145 |
|
2006 |
133.8 |
71.49 |
51.0 |
2,363,409 |
56016,000,000 |
101557,330,723 |
42,971 |
|
2007 |
130.0 |
74.52 |
48.2 |
2,506,769 |
62691,000,000 |
114634,043,362 |
45,730 |
|
2008 |
136.2 |
94.32 |
52.9 |
2,650,930 |
87457,000,000 |
147379,737,230 |
55,595 |
|
2009 |
121.0 |
64.02 |
38.9 |
2,795,550 |
54008,000,000 |
105968,691,905 |
37,906 |
|
2010 |
123.4 |
79.04 |
48.2 |
2,943,356 |
69978,000,000 |
115416,245,239 |
39,212 |
|
2011 |
140.9 |
93.67 |
58.4 |
3,143,825 |
102103,000,000 |
154039,231,299 |
48,997 |
|
2012 |
154.0 |
95.26 |
57.4 |
3,394,663 |
118912,000,000 |
174047,695,599 |
51,271 |
|
2013 |
151.4 |
94.83 |
55.6 |
3,646,518 |
115104,000,000 |
174168,116,687 |
47,763 |
|
2014 |
150.2 |
88.90 |
53.2 |
3,761,584 |
102111,000,000 |
162650,450,785 |
43,240 |
|
2015 |
148.2 |
51.86 |
36.4 |
3,908,743 |
54122,000,000 |
114585,555,831 |
29,315 |
|
2016 |
152.7 |
45.53 |
31.7 |
4,048,085 |
46273,000,000 |
109406,674,088 |
27,027 |
|
2017 |
145.0 |
54.28 |
36.0 |
4,124,904 |
55015,000,000 |
120687,539,676 |
29,258 |
|
2018 |
146.8 |
67.10 |
44.0 |
4,317,185 |
71938,000,000 |
138202,535,962 |
32,012 |
|
2019 |
143.4 |
61.73 |
38.7 |
4,441,100 |
64483,000,000 |
138696,321,088 |
31,230 |
|
2020 |
131.2 |
42.14 |
27.6 |
4,360,444 |
40116,000,000 |
107512,998,447 |
24,656 |
|
2021 |
129.9 |
63.14 |
n. a. |
4,250,114 |
63128,000,000 |
141777,271,269 |
33,358 |
|
2022 |
145.7 |
82.67 |
n. a. |
4,268,873 |
99985,000,000 |
182809,482,401 |
42,824 |
|
2023 |
138.0 |
70.78 |
n. a. |
4,310,108 |
85409,000,000 |
161772,221,951 |
37,533 |
Source: Compiled by the authors based on information Energy Institute (Energy Institute (2023). Energy Institute Statistical Review of World Energy. https://www.energyinst.org/statistical-review) and World Bank (World Bank (2024). Oil rents (% of GDP). https://data.worldbank.org/indicator/NY.GDP.PETR.RT.ZS?locations=IM; World Bank (2024). Population, total. https://data.worldbank.org/indicator/SP.DYN.LE00.IN; World Bank (2024). Merchandise exports (current US\$). https://data.worldbank.org/indicator/TX.VAL.MRCH.CD.WT; World Bank (2024). GDP (current US\$). https://data.worldbank.org/indicator/NY.GDP.MKTP.CD; World Bank (2024). GDP per capita (current US\$). https://data.worldbank.org/indicator/NY.GDP.PCAP.CD)
Appendix Table 2. Dynamics of the development of the oil industry in Oman, global prices, economic, and demographic indicators
|
Year |
Oil Production, million tonnes |
World Crude Oil, Average Price ($/barrel) |
Oil Rents (% of GDP) |
Population, Total |
Merchandise Exports (current US$) |
GDP (current US$) |
GDP per Capita (current US$) |
|
1970 |
16.4 |
5.21 |
43.4 |
670,693 |
143,000,000 |
256,319,795 |
382 |
|
1971 |
14.6 |
6.92 |
43.5 |
688,803 |
154,000,000 |
301,010,587 |
437 |
|
1972 |
14.0 |
6.83 |
43.8 |
708,045 |
167,000,000 |
366,883,548 |
518 |
|
1973 |
14.5 |
9.09 |
51.8 |
728,597 |
239,000,000 |
483,066,991 |
663 |
|
1974 |
14.4 |
29.16 |
63.7 |
754,676 |
823,000,000 |
1645,917,776 |
2,181 |
|
1975 |
16.9 |
24.96 |
58.3 |
787,194 |
1044,000,000 |
2096,699,189 |
2,664 |
|
1976 |
18.2 |
27.48 |
56.1 |
824,081 |
1134,000,000 |
2560,220,035 |
3,107 |
|
1977 |
16.8 |
27.47 |
52.3 |
866,124 |
1139,000,000 |
2741,169,948 |
3,165 |
|
1978 |
15.6 |
24.30 |
49.4 |
912,750 |
1096,000,000 |
2740,301,390 |
3,002 |
|
1979 |
14.6 |
52.22 |
79.3 |
963,351 |
1570,000,000 |
3733,352,635 |
3,875 |
|
1980 |
14.1 |
56.53 |
55.0 |
1,017,462 |
3748,000,000 |
5981,760,278 |
5,879 |
|
1981 |
16.3 |
54.34 |
46.6 |
1,075,624 |
4696,000,000 |
7259,120,151 |
6,749 |
|
1982 |
16.7 |
51.53 |
37.5 |
1,138,301 |
4421,000,000 |
7554,719,456 |
6,637 |
|
1983 |
19.3 |
48.09 |
41.1 |
1,204,626 |
4248,000,000 |
7932,541,691 |
6,585 |
|
1984 |
20.8 |
47.35 |
38.9 |
1,273,306 |
4422,000,000 |
8821,443,151 |
6,928 |
|
1985 |
24.8 |
45.54 |
40.0 |
1,353,289 |
4972,000,000 |
10005,645,420 |
7,394 |
|
1986 |
27.9 |
20.90 |
30.5 |
1,443,446 |
2842,000,000 |
7324,167,369 |
5,074 |
|
1987 |
29.0 |
24.12 |
40.9 |
1,533,351 |
3776,000,000 |
7811,183,095 |
5,094 |
|
1988 |
30.9 |
18.37 |
33.9 |
1,623,433 |
3268,000,000 |
8386,215,865 |
5,166 |
|
1989 |
32.1 |
22.40 |
44.4 |
1,713,838 |
3933,000,000 |
9372,171,651 |
5,469 |
|
1990 |
34.2 |
27.67 |
49.6 |
1,804,524 |
5508,000,000 |
11685,045,514 |
6,475 |
|
1991 |
35.3 |
23.65 |
31.8 |
1,895,187 |
4871,000,000 |
11341,482,445 |
5,984 |
|
1992 |
37.0 |
22.79 |
31.7 |
1,985,227 |
5428,000,000 |
12452,275,683 |
6,272 |
|
1993 |
38.8 |
19.51 |
31.5 |
2,071,868 |
5299,000,000 |
12493,107,932 |
6,030 |
|
1994 |
40.5 |
18.97 |
28.7 |
2,133,675 |
5545,000,000 |
12918,855,657 |
6,055 |
|
1995 |
42.8 |
18.69 |
30.9 |
2,172,672 |
6068,000,000 |
13802,600,780 |
6,353 |
|
1996 |
44.4 |
22.65 |
36.2 |
2,209,958 |
7346,000,000 |
15277,763,329 |
6,913 |
|
1997 |
44.9 |
22.31 |
32.0 |
2,245,588 |
7630,000,000 |
15837,451,235 |
7,053 |
|
1998 |
44.7 |
15.90 |
22.5 |
2,279,727 |
5508,000,000 |
13996,914,694 |
6,140 |
|
1999 |
44.7 |
22.42 |
31.1 |
2,312,600 |
7238,000,000 |
15593,456,177 |
6,743 |
|
2000 |
47.0 |
35.48 |
44.5 |
2,344,253 |
11319,000,000 |
19507,452,536 |
8,321 |
|
2001 |
46.9 |
31.80 |
36.3 |
2,374,653 |
11074,000,000 |
19452,000,520 |
8,192 |
|
2002 |
44.0 |
32.94 |
33.5 |
2,403,659 |
11172,000,000 |
20142,756,047 |
8,380 |
|
2003 |
40.2 |
36.30 |
33.3 |
2,431,600 |
11669,000,000 |
21633,708,192 |
8,897 |
|
2004 |
38.4 |
44.38 |
36.8 |
2,468,855 |
13342,000,000 |
24763,712,874 |
10,030 |
|
2005 |
38.0 |
60.88 |
42.8 |
2,515,192 |
18692,000,000 |
31081,991,678 |
12,358 |
|
2006 |
36.2 |
71.49 |
40.8 |
2,560,649 |
21585,000,000 |
37215,779,714 |
14,534 |
|
2007 |
34.8 |
74.52 |
37.8 |
2,605,700 |
24692,000,000 |
42085,379,454 |
16,151 |
|
2008 |
37.1 |
94.32 |
37.9 |
2,651,028 |
37719,000,000 |
60905,452,536 |
22,974 |
|
2009 |
39.7 |
64.02 |
30.5 |
2,697,537 |
27651,000,000 |
48388,363,589 |
17,938 |
|
2010 |
42.2 |
79.04 |
32.6 |
2,881,914 |
36601,000,000 |
64993,498,049 |
22,552 |
|
2011 |
43.2 |
93.67 |
40.4 |
3,206,870 |
47092,000,000 |
77497,529,259 |
24,166 |
|
2012 |
45.0 |
95.26 |
37.5 |
3,535,579 |
52138,000,000 |
87408,842,653 |
24,723 |
|
2013 |
46.1 |
94.83 |
36.0 |
3,816,680 |
55497,000,000 |
89936,020,806 |
23,564 |
|
2014 |
46.2 |
88.90 |
31.7 |
4,009,267 |
50718,000,000 |
92699,089,727 |
23,121 |
|
2015 |
48.0 |
51.86 |
18.9 |
4,191,776 |
31927,000,000 |
78710,793,238 |
18,777 |
|
2016 |
49.3 |
45.53 |
16.3 |
4,398,070 |
30014,000,000 |
75128,738,622 |
17,082 |
|
2017 |
47.6 |
54.28 |
19.3 |
4,541,854 |
32904,000,000 |
80856,697,009 |
17,803 |
|
2018 |
47.8 |
67.10 |
23.7 |
4,601,157 |
41761,000,000 |
91505,851,756 |
19,888 |
|
2019 |
47.3 |
61.73 |
21.6 |
4,602,768 |
38724,000,000 |
88060,858,257 |
19,132 |
|
2020 |
46.1 |
42.14 |
15.0 |
4,543,399 |
33479,000,000 |
75909,397,659 |
16,708 |
|
2021 |
46.8 |
63.14 |
23.5 |
4,520,471 |
44591,000,000 |
88191,977,373 |
19,509 |
|
2022 |
51.4 |
82.67 |
n. a. |
4,576,298 |
66063,000,000 |
114667,360,208 |
25,057 |
|
2023 |
50.3 |
70.78 |
n. a. |
4,644,384 |
62736,000,000 |
108192,457,737 |
23,295 |
Source: Compiled by the authors based on information Energy Institute (Energy Institute (2023). Energy Institute Statistical Review of World Energy. https://www.energyinst.org/statistical-review) and World Bank (World Bank (2024). Oil rents (% of GDP). https://data.worldbank.org/indicator/NY.GDP.PETR.RT.ZS?locations=IM; World Bank (2024). Population, total. https://data.worldbank.org/indicator/SP.DYN.LE00.IN; World Bank (2024). Merchandise exports (current US\$). https://data.worldbank.org/indicator/TX.VAL.MRCH.CD.WT; World Bank (2024). GDP (current US\$). https://data.worldbank.org/indicator/NY.GDP.MKTP.CD; World Bank (2024). GDP per capita (current US\$). https://data.worldbank.org/indicator/NY.GDP.PCAP.CD)
Appendix Table 3. Dynamics of the development of the oil industry in Saudi Arabia, global prices, economic, and demographic indicators
|
Year |
Oil Production, million tonnes |
World Crude Oil, Average Price ($/barrel) |
Oil Rents (% of GDP) |
Population, Total |
Merchandise Exports (current US$) |
GDP (current US$) |
GDP per Capita (current US$) |
|
1970 |
192.2 |
5.21 |
25.4 |
6,106,191 |
2371,000,000 |
5377,333,333 |
881 |
|
1971 |
240.8 |
6.92 |
29.6 |
6,396,658 |
3850,000,000 |
7184,806,909 |
1,123 |
|
1972 |
304.2 |
6.83 |
36.4 |
6,724,260 |
5491,000,000 |
9664,267,087 |
1,437 |
|
1973 |
384.0 |
9.09 |
43.2 |
7,088,758 |
8988,000,000 |
14947,435,499 |
2,109 |
|
1974 |
429.6 |
29.16 |
67.5 |
7,483,506 |
35555,000,000 |
45412,957,747 |
6,068 |
|
1975 |
359.3 |
24.96 |
54.3 |
7,897,544 |
29673,000,000 |
46773,208,643 |
5,923 |
|
1976 |
437.3 |
27.48 |
53.0 |
8,319,556 |
38286,000,000 |
64005,665,722 |
7,693 |
|
1977 |
468.4 |
27.47 |
51.8 |
8,755,219 |
43466,000,000 |
74188,986,586 |
8,474 |
|
1978 |
424.4 |
24.30 |
44.8 |
9,210,564 |
40735,000,000 |
80266,516,687 |
8,715 |
|
1979 |
488.0 |
52.22 |
87.1 |
9,682,002 |
63427,000,000 |
111858,444,786 |
11,553 |
|
1980 |
509.8 |
56.53 |
70.3 |
10,171,710 |
109083,000,000 |
164539,660,725 |
16,176 |
|
1981 |
506.3 |
54.34 |
55.6 |
10,678,211 |
119876,000,000 |
184291,360,139 |
17,259 |
|
1982 |
340.2 |
51.53 |
36.8 |
11,201,154 |
79077,000,000 |
153240,313,858 |
13,681 |
|
1983 |
240.3 |
48.09 |
34.7 |
11,746,020 |
45861,000,000 |
129171,635,311 |
10,997 |
|
1984 |
219.0 |
47.35 |
33.7 |
12,310,361 |
37545,000,000 |
119624,858,116 |
9,717 |
|
1985 |
172.1 |
45.54 |
27.6 |
12,890,245 |
27481,000,000 |
103897,846,494 |
8,060 |
|
1986 |
252.6 |
20.90 |
23.1 |
13,483,349 |
20185,000,000 |
86961,922,765 |
6,450 |
|
1987 |
213.6 |
24.12 |
27.3 |
14,089,798 |
23199,000,000 |
85695,861,148 |
6,082 |
|
1988 |
273.3 |
18.37 |
26.2 |
14,713,715 |
24377,000,000 |
88256,074,766 |
5,998 |
|
1989 |
271.2 |
22.40 |
34.2 |
15,353,227 |
28382,000,000 |
95344,459,279 |
6,210 |
|
1990 |
342.6 |
27.67 |
46.4 |
16,004,763 |
44417,000,000 |
117630,173,565 |
7,350 |
|
1991 |
428.3 |
23.65 |
29.9 |
16,654,276 |
47797,000,000 |
132223,230,975 |
7,939 |
|
1992 |
442.1 |
22.79 |
30.8 |
17,281,350 |
50280,000,000 |
137087,850,467 |
7,933 |
|
1993 |
429.3 |
19.51 |
29.7 |
17,846,461 |
42395,000,000 |
132967,957,276 |
7,451 |
|
1994 |
432.2 |
18.97 |
26.5 |
18,367,528 |
42614,000,000 |
135174,899,867 |
7,359 |
|
1995 |
431.3 |
18.69 |
28.1 |
18,888,857 |
50040,000,000 |
143343,124,166 |
7,589 |
|
1996 |
437.4 |
22.65 |
33.5 |
19,410,280 |
60729,000,000 |
158662,483,311 |
8,174 |
|
1997 |
432.0 |
22.31 |
29.3 |
19,938,377 |
60732,000,000 |
165963,684,913 |
8,324 |
|
1998 |
445.3 |
15.90 |
21.3 |
20,472,580 |
38822,000,000 |
146775,466,667 |
7,169 |
|
1999 |
408.5 |
22.42 |
27.1 |
21,009,660 |
50761,000,000 |
161717,066,667 |
7,697 |
|
2000 |
438.5 |
35.48 |
41.7 |
21,547,390 |
77583,000,000 |
189514,933,333 |
8,795 |
|
2001 |
427.7 |
31.80 |
33.4 |
22,085,929 |
68064,000,000 |
184137,60,000 |
8,337 |
|
2002 |
390.1 |
32.94 |
31.3 |
22,623,415 |
72453,000,000 |
189605,866,667 |
8,381 |
|
2003 |
460.5 |
36.30 |
37.0 |
23,150,847 |
93245,000,000 |
215807,733,333 |
9,322 |
|
2004 |
492.8 |
44.38 |
42.6 |
23,661,808 |
125997,000,000 |
258742,133,333 |
10,935 |
|
2005 |
516.6 |
60.88 |
48.9 |
24,397,644 |
180711,000,000 |
328459,608,764 |
13,463 |
|
2006 |
508.9 |
71.49 |
49.7 |
25,382,870 |
211305,000,000 |
376900,133,511 |
14,849 |
|
2007 |
488.9 |
74.52 |
47.4 |
26,400,068 |
233329,000,000 |
415964,509,673 |
15,756 |
|
2008 |
510.0 |
94.32 |
54.1 |
27,437,353 |
313462,000,000 |
519796,80,000 |
18,945 |
|
2009 |
459.0 |
64.02 |
34.6 |
28,483,797 |
192314,000,000 |
429097,866,667 |
15,065 |
|
2010 |
463.3 |
79.04 |
37.9 |
29,411,929 |
251143,000,000 |
528207,20,000 |
17,959 |
|
2011 |
522.7 |
93.67 |
49.2 |
30,150,945 |
364699,000,000 |
676634,666,667 |
22,442 |
|
2012 |
549.2 |
95.26 |
47.4 |
30,821,543 |
388401,000,000 |
741849,866,667 |
24,069 |
|
2013 |
538.4 |
94.83 |
44.5 |
31,482,498 |
375872,000,000 |
753864,533,333 |
23,946 |
|
2014 |
543.8 |
88.90 |
40.3 |
32,125,564 |
342433,000,000 |
766605,866,667 |
23,863 |
|
2015 |
568.0 |
51.86 |
24.0 |
32,749,848 |
203550,000,000 |
669484,266,667 |
20,442 |
|
2016 |
586.7 |
45.53 |
20.0 |
33,416,270 |
183579,000,000 |
666000,0,000 |
19,930 |
|
2017 |
559.3 |
54.28 |
23.6 |
34,193,122 |
221835,000,000 |
714994,666,667 |
20,910 |
|
2018 |
576.8 |
67.10 |
28.1 |
35,018,133 |
294373,000,000 |
846583,733,333 |
24,176 |
|
2019 |
556.6 |
61.73 |
24.3 |
35,827,362 |
261603,000,000 |
838564,80,000 |
23,406 |
|
2020 |
519.6 |
42.14 |
16.0 |
35,997,107 |
173854,000,000 |
734271,20,000 |
20,398 |
|
2021 |
515.0 |
63.14 |
23.7 |
35,950,396 |
276179,000,000 |
874156,0,000 |
24,316 |
|
2022 |
573.1 |
82.67 |
n. a. |
36,408,820 |
411184,000,000 |
1108571,466,667 |
30,448 |
|
2023 |
542.0 |
70.78 |
n. a. |
36,947,025 |
322256,000,000 |
1067582,933,333 |
28,895 |
Source: Compiled by the authors based on information Energy Institute (Energy Institute (2023). Energy Institute Statistical Review of World Energy. https://www.energyinst.org/statistical-review) and World Bank (World Bank (2024). Oil rents (% of GDP). https://data.worldbank.org/indicator/NY.GDP.PETR.RT.ZS?locations=IM; World Bank (2024). Population, total. https://data.worldbank.org/indicator/SP.DYN.LE00.IN; World Bank (2024). Merchandise exports (current US\$). https://data.worldbank.org/indicator/TX.VAL.MRCH.CD.WT; World Bank (2024). GDP (current US\$). https://data.worldbank.org/indicator/NY.GDP.MKTP.CD; World Bank (2024). GDP per capita (current US\$). https://data.worldbank.org/indicator/NY.GDP.PCAP.CD)
Appendix Table 4. Dynamics of the development of the oil industry in the United Arab Emirates, global prices, economic, and demographic indicators
|
Year |
Oil Production, million tonnes |
World Crude Oil, Average Price ($/barrel) |
Oil Rents (% of GDP) |
Population, Total |
Merchandise Exports (current US$) |
GDP (current US$) |
GDP per Capita (current US$) |
|
1970 |
37.8 |
5.21 |
n. a. |
298,084 |
523,000,000 |
685,986,701 |
2,301 |
|
1971 |
51.3 |
6.92 |
n. a. |
344,513 |
871,000,000 |
939,893,600 |
2,728 |
|
1972 |
58.4 |
6.83 |
n. a. |
392,368 |
1157,000,000 |
1415,086,929 |
3,607 |
|
1973 |
74.2 |
9.09 |
n. a. |
441,546 |
1807,000,000 |
4231,243,616 |
9,583 |
|
1974 |
81.3 |
29.16 |
n. a. |
491,955 |
6414,000,000 |
11651,505,690 |
23,684 |
|
1975 |
80.6 |
24.96 |
37.4 |
543,394 |
7262,000,000 |
14720,728,249 |
27,090 |
|
1976 |
94.0 |
27.48 |
36.9 |
614,177 |
9535,000,000 |
19213,158,779 |
31,283 |
|
1977 |
96.8 |
27.47 |
30.9 |
706,861 |
9636,000,000 |
24871,775,165 |
35,186 |
|
1978 |
88.6 |
24.30 |
31.5 |
805,231 |
9126,000,000 |
23775,764,225 |
29,527 |
|
1979 |
88.7 |
52.22 |
56.0 |
908,452 |
13652,000,000 |
31225,659,621 |
34,372 |
|
1980 |
83.8 |
56.53 |
41.9 |
1,014,048 |
21970,000,000 |
43599,160,050 |
42,995 |
|
1981 |
74.1 |
54.34 |
33.0 |
1,100,180 |
22380,000,000 |
49333,424,135 |
44,841 |
|
1982 |
64.4 |
51.53 |
22.9 |
1,167,856 |
18780,000,000 |
46622,718,605 |
39,922 |
|
1983 |
60.7 |
48.09 |
23.7 |
1,237,572 |
16900,000,000 |
42803,323,345 |
34,587 |
|
1984 |
58.1 |
47.35 |
25.8 |
1,308,331 |
16500,000,000 |
41807,954,236 |
31,955 |
|
1985 |
56.0 |
45.54 |
23.7 |
1,379,536 |
16780,000,000 |
40603,650,232 |
29,433 |
|
1986 |
64.6 |
20.90 |
17.0 |
1,468,697 |
10640,000,000 |
33943,612,095 |
23,111 |
|
1987 |
68.2 |
24.12 |
22.9 |
1,575,909 |
12380,000,000 |
36384,908,744 |
23,088 |
|
1988 |
72.0 |
18.37 |
20.4 |
1,683,681 |
12040,000,000 |
36275,674,203 |
21,545 |
|
1989 |
85.1 |
22.40 |
28.6 |
1,791,840 |
17596,000,000 |
41464,995,914 |
23,141 |
|
1990 |
93.2 |
27.67 |
35.3 |
1,900,151 |
23544,000,000 |
50701,443,748 |
26,683 |
|
1991 |
106.9 |
23.65 |
23.5 |
2,008,383 |
24436,000,000 |
51552,165,622 |
25,668 |
|
1992 |
117.7 |
22.79 |
23.3 |
2,116,231 |
24756,000,000 |
54239,171,888 |
25,630 |
|
1993 |
114.4 |
19.51 |
20.8 |
2,223,284 |
25620,000,000 |
55625,170,253 |
25,019 |
|
1994 |
115.3 |
18.97 |
17.0 |
2,329,024 |
26403,000,000 |
59305,093,980 |
25,463 |
|
1995 |
114.4 |
18.69 |
16.3 |
2,433,988 |
28364,000,000 |
65743,666,576 |
27,011 |
|
1996 |
116.9 |
22.65 |
19.1 |
2,572,735 |
37334,000,000 |
73571,233,996 |
28,597 |
|
1997 |
117.3 |
22.31 |
17.0 |
2,746,119 |
40423,000,000 |
78839,008,445 |
28,709 |
|
1998 |
121.5 |
15.90 |
10.8 |
2,921,130 |
33837,000,000 |
75674,336,283 |
25,906 |
|
1999 |
112.0 |
22.42 |
13.4 |
3,097,563 |
36474,000,000 |
84445,473,111 |
27,262 |
|
2000 |
121.5 |
35.48 |
20.8 |
3,275,333 |
49835,000,000 |
104337,372,362 |
31,856 |
|
2001 |
118.4 |
31.80 |
15.8 |
3,454,198 |
48414,000,000 |
103311,640,572 |
29,909 |
|
2002 |
109.0 |
32.94 |
14.6 |
3,633,655 |
52163,000,000 |
109816,201,498 |
30,222 |
|
2003 |
126.2 |
36.30 |
17.8 |
3,813,443 |
67135,000,000 |
124346,358,067 |
32,607 |
|
2004 |
131.3 |
44.38 |
20.9 |
3,993,339 |
90997,000,000 |
147824,370,320 |
37,018 |
|
2005 |
136.6 |
60.88 |
23.9 |
4,280,993 |
117287,000,000 |
180617,467,965 |
42,191 |
|
2006 |
145.7 |
71.49 |
25.9 |
4,898,954 |
145587,000,000 |
222116,541,865 |
45,340 |
|
2007 |
143.6 |
74.52 |
23.7 |
5,872,624 |
178630,000,000 |
257916,133,424 |
43,918 |
|
2008 |
145.2 |
94.32 |
26.7 |
6,988,685 |
239213,000,000 |
315474,615,739 |
45,141 |
|
2009 |
128.8 |
64.02 |
18.4 |
7,992,644 |
191802,000,000 |
253547,358,747 |
31,723 |
|
2010 |
134.2 |
79.04 |
22.7 |
8,481,771 |
213539,000,000 |
300189,052,689 |
35,392 |
|
2011 |
149.4 |
93.67 |
28.6 |
8,575,205 |
302037,000,000 |
360832,739,551 |
42,079 |
|
2012 |
154.9 |
95.26 |
27.1 |
8,664,969 |
359728,000,000 |
384610,125,391 |
44,387 |
|
2013 |
161.6 |
94.83 |
26.2 |
8,751,847 |
374214,000,000 |
400218,529,748 |
45,730 |
|
2014 |
162.9 |
88.90 |
22.9 |
8,835,951 |
343036,000,000 |
414105,366,753 |
46,866 |
|
2015 |
175.1 |
51.86 |
13.1 |
8,916,899 |
300477,000,000 |
370275,469,571 |
41,525 |
|
2016 |
181.6 |
45.53 |
11.1 |
8,994,263 |
295031,000,000 |
369255,326,236 |
41,055 |
|
2017 |
174.9 |
54.28 |
13.5 |
9,068,296 |
313603,000,000 |
390516,804,030 |
43,064 |
|
2018 |
176.0 |
67.10 |
17.1 |
9,140,169 |
387964,000,000 |
427049,432,158 |
46,722 |
|
2019 |
179.9 |
61.73 |
15.7 |
9,211,657 |
389428,000,000 |
417989,721,743 |
45,376 |
|
2020 |
165.9 |
42.14 |
10.5 |
9,287,289 |
335297,000,000 |
349473,015,330 |
37,629 |
|
2021 |
163.4 |
63.14 |
15.7 |
9,365,145 |
425160,000,000 |
415178,792,757 |
44,332 |
|
2022 |
181.1 |
82.67 |
n. a. |
9,441,129 |
515621,000,000 |
507063,968,278 |
53,708 |
|
2023 |
192.0 |
70.78 |
n. a. |
9,516,871 |
487778,000,000 |
504173,451,327 |
52,977 |
Source: Compiled by the authors based on information Energy Institute (Energy Institute (2023). Energy Institute Statistical Review of World Energy. https://www.energyinst.org/statistical-review) and World Bank (World Bank (2024). Oil rents (% of GDP). https://data.worldbank.org/indicator/NY.GDP.PETR.RT.ZS?locations=IM; World Bank (2024). Population, total. https://data.worldbank.org/indicator/SP.DYN.LE00.IN; World Bank (2024). Merchandise exports (current US\$). https://data.worldbank.org/indicator/TX.VAL.MRCH.CD.WT; World Bank (2024). GDP (current US\$). https://data.worldbank.org/indicator/NY.GDP.MKTP.CD; World Bank (2024). GDP per capita (current US\$). https://data.worldbank.org/indicator/NY.GDP.PCAP.CD)
[1] Al Naimi, S.M. (2022). Economic diversification trends in the Gulf: The case of Saudi Arabia. Circular Economy and Sustainability, 2: 221-230. https://doi.org/10.1007/s43615-021-00106-0
[2] Adabor, O., Mishra, A. (2023). The resource curse paradox: The role of financial inclusion in mitigating the adverse effect of natural resource rent on economic growth in Ghana. Resources Policy, 85(A): 103810. https://doi.org/10.1016/j.resourpol.2023.103810
[3] Haseeb, M., Kot, S., Hussain, H.I., Kamarudin, F. (2021). The natural resources curse-economic growth hypotheses: Quantile–on–Quantile evidence from top Asian economies. Journal of Cleaner Production, 279: 123596. https://doi.org/10.1016/j.jclepro.2020.123596
[4] Yu, Y. (2023). Role of natural resources rent on economic growth: Fresh empirical insight from selected developing economies. Resources Policy, 81: 103326. https://doi.org/10.1016/j.resourpol.2023.103326
[5] Mir, R.N., Kulibi, T.A. (2023). Tourism as an engine for economic diversification: An exploratory study of Saudi Arabia’s tourism strategy and marketing initiatives. Saudi Journal of Business and Management Studies, 8(8): 186-201. https://doi.org/10.36348/sjbms.2023.v08i08.003
[6] Lashitew, A.A., Ross, M.L., Werker, E. (2020). What drives successful economic diversification in resource-rich countries? The World Bank Research Observer. https://doi.org/10.1093/wbro/lkaa001
[7] Fattouh, B., Sen, A. (2021). Economic diversification in Arab oil-exporting countries in the context of peak oil and the energy transition. In When Can Oil Economies Be Deemed Sustainable? The Political Economy of the Middle East. Palgrave Macmillan, Singapore. https://doi.org/10.1007/978-981-15-5728-6_5
[8] Mano, H. (2024). Natural resources and economic growth in WAEMU: The role of export diversification. Mineral Economics, 37: 863-876. https://doi.org/10.1007/s13563-024-00439-w
[9] Can, M., Ahmed, Z., Ahmad, M., Oluc, I. (2024). Economic progress in emerging countries: The roles of diversification of import and export products and energy consumption. Environment, Development and Sustainability, 26(7): 18207-18229. https://doi.org/10.1007/s10668-023-03386-8
[10] Nibedita, B., Irfan, M. (2024). Energy mix diversification in emerging economies: An econometric analysis of determinants. Renewable and Sustainable Energy Reviews, 189: 114043. https://doi.org/10.1016/j.rser.2023.114043
[11] Prasad, A., Refass, S., Saidi, N., Salem, F., Shepherd, B. (2024). Global Economic Diversification Index 2023. Global Economic Diversification Index Series. https://ssrn.com/abstract=4682950, accessed on Oct. 17, 2024.
[12] Euchi, J., Omri, A., Al-Tit, A. (2018). The pillars of economic diversification in Saudi Arabia. World Review of Science, Technology and Sustainable Development, 14(4): 330-343. https://doi.org/10.1504/WRSTSD.2018.095719
[13] Cai, H.H., Lee, H.F., Khan, N.U., Yuan, Q. (2024). Are natural resources a curse, a blessing, or a double-edged sword? Implications for environmental sustainability. Journal of Environmental Management, 367: 122008. https://doi.org/10.1016/j.jenvman.2024.122008
[14] Hayat, A., Tahir, M. (2021). Natural resources volatility and economic growth: Evidence from the resource-rich region. Journal of Risk and Financial Management, 14(2): 84. https://doi.org/10.3390/jrfm14020084
[15] Sharma, C., Mishra, R.K. (2022). On the good and bad of natural resource, corruption, and economic growth nexus. Environmental and Resource Economics, 82(4): 889-922. https://doi.org/10.1007/s10640-022-00694-x
[16] Hassan, O., Algburi, S., Sameen, A.Z., Jaszczur, M., Salman, H.M., Mahmoud, H.A., Awwad, E.M. (2024). Saudi Arabia energy transition: Assessing the future of green hydrogen in climate change mitigation. International Journal of Hydrogen Energy, 55: 124-140. https://doi.org/10.1016/j.ijhydene.2023.11.117
[17] Tagliapietra, S. (2019). The impact of the global energy transition on MENA oil and gas producers. Energy Strategy Reviews, 26: 100397. https://doi.org/10.1016/j.esr.2019.100397
[18] Sanfilippo, A., Vermeersch, M., Benito, V.B. (2024). Energy transition strategies in the Gulf cooperation council countries. Energy Strategy Reviews, 55: 101512. https://doi.org/10.1016/j.esr.2024.101512
[19] Hilmi, N., Farahmand, S., Belaid, F. (2020). Why should Saudi Arabia diversify its economy? In Economic Development in the Gulf Cooperation Council Countries. Gulf Studies. Springer, Singapore. https://doi.org/10.1007/978-981-15-6058-3_5
[20] Hassan, O. (2020). Artificial intelligence, Neom and Saudi Arabia’s economic diversification from oil and gas. The Political Quarterly, 91(1): 222-227. https://doi.org/10.1111/1467-923x.12794
[21] Sweidan, O.D., Elbargathi, K. (2023). Economic diversification in Saudi Arabia: Comparing the impact of oil prices, geopolitical risk, and government expenditures. International Economics, 175: 13-24. https://doi.org/10.1016/j.inteco.2023.05.003
[22] Mohammed, N.A.A., Xianhui, G., Shah, S.A.A. (2021). Non-oil economic transition for economic and environmental sustainability in Saudi Arabia: A multi-factor analysis under fuzzy environment. Environmental Science and Pollution Research, 28(40): 56219-56233. https://doi.org/10.1007/s11356-021-14304-8
[23] Derouez, F., Ifa, A. (2024). Sustainable food security: Balancing desalination, climate change, and population growth in five Arab countries using ARDL and VECM. Sustainability, 16(6): 2302. https://doi.org/10.3390/su16062302
[24] Shadab, S. (2023). The new Arab Gulf: Evaluating the success of economic diversification in the UAE. In Social Change in the Gulf Region. Gulf Studies. Springer, Singapore. https://doi.org/10.1007/978-981-19-7796-1_25
[25] Tyler, T.R. (2021). Legal socialization: Back to the future. Journal of Social Issues, 77(2): 663-676. https://doi.org/10.1111/josi.12456
[26] Kumar, S. (2024). Polynomial regression. In Python for Accounting and Finance. Palgrave Macmillan, Cham. https://doi.org/10.1007/978-3-031-54680-8_21
[27] Nguyen, M. (2020). A guide on data analysis. Bookdown. https://bookdown.org/mike/data_analysis/, accessed on Oct. 17, 2024.
[28] O’Brien, T.E., Silcox, J.W. (2024). Nonlinear regression modelling: A primer with applications and caveats. Bulletin of Mathematical Biology, 86(4): 40. https://doi.org/10.1007/s11538-024-01274-4
[29] Al-Saidi, M. (2020). From economic to extrinsic values of sustainable energy: Prestige, neo-rentierism, and geopolitics of the energy transition in the Arabian Peninsula. Energies, 13: 5545. https://doi.org/10.3390/en13215545
[30] Valeri, M. (2020). Economic diversification and energy security in Oman: Natural gas, the X factor? Journal of Arabian Studies, 10(1): 159-174. https://doi.org/10.1080/21534764.2020.17942
[31] Baig, S. (2024). Trade routes to tourist routes: Assessing Sino-Omani cooperation in tourism development under the Belt and Road Initiative. Journal of Infrastructure, Policy and Development, 8(9): 7016. https://doi.org/10.24294/jipd.v8i9.7016
[32] Fatikhin, R., Qalyubi, S., Subaidi, S. (2024). The authority of policy: Transitioning from traditionalist to modernist moderate in Saudi Arabia. Fikri: Jurnal Kajian Agama, Sosial Dan Budaya, 9(1): 122-135. https://doi.org/10.25217/jf.v9i1.4778
[33] Abobaker, M.Y. (2024). Analytical study on the impact of legal and legislative reforms in Saudi Arabia laws on women’s empowerment and economic growth. Journal of Infrastructure, Policy and Development, 8(7): 7434. https://doi.org/10.24294/jipd.v8i7.7434
[34] Alhmoud, K.B.R., Ftomova, O.S., Wang, X., Koettl-Brodmann, J., Alrayess, D.J., Gomez Tamayo, S., Fostier de Moraes, G., Chartouni, C., Pankratova, E., Rivera Guivas, N., Zeitoun, N.A.M.S. (2023). Gulf economic update: Structural reforms and shifting social norms to increase women's labor force participation (English). World Bank Group, Washington, D.C. http://documents.worldbank.org/curated/en/099145011172340921/IDU0cb6824e50d4ed046900abd2055b4af395b3c, accessed on Oct. 17, 2024.