Naman Mishra![]() | Simon Grima*
| Simon Grima*![]()
© 2025 The authors. This article is published by IIETA and is licensed under the CC BY 4.0 license (http://creativecommons.org/licenses/by/4.0/).
OPEN ACCESS
Global climate change has become an evident threat to the economy and is affecting the day-to-day operations of humans in every way alike. This issue of climate change has also impacted the traditional banking system. It has made way for Green Banking (GB), which ensures the balance of sustainability and growth in the final sector. The study's main aim is to quantify the effect that the various practices that relate to GB are having on the environmental performance of banks while also understanding the mediating impact of green finance. This study uses a survey-based approach to sample the data of 274 bank employees in India's Northern Capital Region (NCR). To quantify the relation between the various variables and highlight the statistical significance of the relationship, the study uses structural equation modelling (SEM) to quantify the measurement and the structural model. The study's findings reveal that the various factors of operations, consumer focus, employee training, and policy practices in the aspect of GB affect the environmental performance of a bank in some manner or another. It discusses the empirical and policy implications for future research directions in the concerned area.
Green Banking (GB), green financing (GF), GB in India, banking and environment
The pursuit of economic excellence and wealth maximisation has put humans on a track to being relentless towards the sole goal of prosperity while imagining activities that are detrimental to society and the environment. While focusing on achieving growth, the role and significance of the environment have been undermined significantly, and this has been surmounted to a greater extent, with newer challenges posing a threat to the global community. These challenges include but are not limited to erratic climate changes leading to flash floods, heat waves, global warming and global boiling in the long run. These adverse effects of climate change are driven by the human activities of rapid urbanisation, deforestation, and over-reliance on fossil fuels, which have been disturbing the natural balance of the environment and pose a threat to humanity. These activities are concerned with releasing high amounts of greenhouse gases, which lead to global warming; this effect of human activities alters the weather patterns over the long term. Such severe implications lead to floods and heat waves, the primary issues that pose significant health and financial risks to the vulnerable population. Understanding the importance of the environment and mitigating such worst-case scenarios, global action has been spurred against it, primarily furthered by the government, enterprises and institutions focusing on being more sustainable [1]. This shift towards sustainability in the development industry, especially the financial sector, has been furthered with the development of indexes like the Global Green Economy Index (GGEI). This index measures and ranks the countries based on their environmental performance, including energy efficiency, renewable energy adoption, carbon emissions and policy development, among other things. These indexes allow the leaders to work progressively towards bolstering the fight towards climate change and fostering sustainable development.
However, the shocks of the climate-induced risks are not felt equally by all economies, and the vulnerability of developing nations like India is different, owing to the absence of adequate measures for climate change and effective institutions to handle such drastic changes. India has a huge potential for economic growth and a similar magnitude of threat from climate change. According to the World Bank, the country has lost around 2.8% of its Gross Domestic Product (GDP) by the year 2050 due to the shifting patterns of precipitation and rising temperatures. The sudden sea level rise attributed to climate change and global warming threatens the country’s vast coastline, which spans over 7500 kilometres. The projections state that the coastline areas and cities of Chennai, Kolkata, and Mumbai are poised to see a rise of 30-80 cm in sea level by the end of the century. This calamity would displace millions of people and thus cause a chain reaction of severe economic losses. Another aspect of the country's vulnerability arises from the dependence on agriculture. India is an agrarian land; thus, this sector employs 58% of the total population while contributing 15% of the GDP. However, the rising issues of climate change, erratic monsoons, increased droughts, and unprecedented weather events are leading to a decline in productivity. According to the economic survey of India 2017-2018, the adverse effects of climate change can impact the sector in a significant manner by reducing income by the range of 15-18%, furthering the economic divide among the masses. India is also touted to be the third largest carbon emitter among its counterparts and heavily relies on fossil fuels to energise 75% of its operations. This leads to the banking sector being heavily invested and sensitised to carbon-intensive industries, which has been highlighted to increase a 5% addition to loan default. Considering all these adverse issues, India has embraced various policies like GB and financing to establish sustainable growth while maintaining economic integrity [2, 3]. GB is defined as those financial activities which promote environmental stability while reducing carbon footprints and supporting eco-friendly initiatives. To further this, the country's central bank, the Reserve Bank of India, has encouraged banks to be more adaptive towards green practices. Even with the help of its Priority Sector Lending (PSL) guidelines, it has mandated that the banks allocate a portion of their lending to renewable energy and sustainability. In addition, specific empirical evidence shows that a change in the country's climate relates directly to credit risk owing to the interdependency of the economic variables. Even the Financial Stability Report by the central bank flags climate risks as potential threats to financial institutions, with the World Bank supporting the numbers by estimating a loss of 2.8% GDP by 2050 due to climatic disruptions. The aspect of climatic disclosure and requirements is still grey in implementations, unlike the EU, which has stringent regulatory requirements. There is an absence of the Green Deposits Framework or any specific guideline which clarifies and mandates the implementation of green credit among the country’s financial institutions. Thus, it is seen that a vast country like India, which is characterised by its vast ecological landscape, needs the support of GB to help fight the adverse effects of climate change.
In simpler terms, GB is a financial system that amalgamates economic, social, and ecological considerations into banks' operations and policies. This approach towards banking operations prioritises sustainability and minimises environmental degradation while catering to boosted economic growth. GB, on the whole, is aimed towards directing the capital flow into projects and initiatives that are more environmentally focused, like renewable energy, sustainable agriculture, and waste management. GB emphasises climate protection by encouraging banks to reduce their carbon footprint while adopting more efficient technologies, using paperless banking, and financing green projects [4]. Therefore, the goal is to merge and align financial activities with the environment while maintaining the ecological balance. GB is crucial for economic growth as it ensures that the banks' resources are allocated to projects that help the environment and make the economy more resilient and reliable [5-7]. GB plays a significant role in furthering the Sustainable Development Goals (SDGs) laid by the United Nations. GB is directly aligned with the goals of clean and affordable energy (SDG 7), climate action (SDG 13), sustainable cities and communities (SDG 11), and responsible consumption and production (SDG 12). With a focus on investments in these areas, GB allows the banks to drive economic progress towards a more balanced society, and thus, its importance cannot be overstated.
Various studies have been conducted to understand the area of GB regarding its development, goals, and specific scenarios for its implementation. The areas of its adoption and its performance in terms of sustainability and stability have been extensively researched. Still, most were based on scenarios that were different from the Indian perspective and problems. In India's context, few studies related to banking performances, GB practices, and financial growth have been accommodated in this area.
The secondary data of banks in the element of GB is unavailable while looking at the case of India. As such, the study aims to fill these gaps by identifying the current prevailing practices of GB in India and gauging its empirical impact on the financial aspect as well as the performance of banks environmentally. The study's primary objective includes the analysis of how GB practices are helping the environmental performance of banks in India while also understanding the linkages of green finance in this relationship. The study is comprehensive in studying the relationship between both consumer-related policies and employee-related policies in green finance and GB. To make the study feasible, it draws from the literature to understand the prevalent GB practices. It uses a semi-structured survey-based SEM to determine the empirical nature of the relation. The link between the various GB practices and financial and environmental performance are all captured and discussed.
The study has been structured as follows: Section 2 delves into understanding the topic of GB with relevant literature and the various GB practices currently undertaken by the Indian banking sector. Section 3 covers the tools and methods supporting the study, such as the SEM, data collection, and sampling. Sections 4 provides an analysis of the results and Sections 4 provides discussions on them. The last section covers the policy implications for the country and ends the talks with a presentation of future directions and limitations.
2.1 Green Banking
To better understand the adoption of GB practices in India, this study draws upon two foundational theories: stakeholder theory and institutional theory. Stakeholder theory posits that an organisation’s success depends on how effectively it manages its relationships with various stakeholders, including regulators, customers, employees, and environmental advocacy groups. In the banking context, this theory explains how financial institutions adopt GB practices to fulfil stakeholder expectations around environmental and social responsibility. The institutional theory offers complementary insights by emphasising the role of external pressures—coercive (e.g., RBI directives), mimetic (peer imitation), and normative (industry norms)—in shaping organisational behaviour. Indian banks are increasingly subject to these forces, encouraging convergence toward GF practices even when explicit regulations are lacking. Together, these theories provide a compelling explanation for why banks adopt green policies to improve environmental performance and respond to the broader institutional environment. GB is a concept that plays a vital role in the amalgamation of various environmental policies, banking operations, and socio-economic growth. The ideation of GB as a concept was conceptualised in the early 1980s by the Bank of Triodos Bank in the Dutch provinces [8]. The bank developed the “Green Fund” to support various environment-related projects. It was the guiding light for further policy development and implementation of GB [5]. With time, this topic has gained traction among people in the banking sector due to the rising urgency to battle climate change and adopt sustainable practices concerning climate-induced risks. Banks recognising the need for sustainable development and their role in stabilising the economy and the environment have increased practices towards the same. They promote these initiatives while catering to the masses regarding meaningful carbon reduction practices.
2.2 Green Banking in India
The aspect of GB in India is still in its nascent stage, but the various agencies and banks are proactively working towards its acceptance and adoption. Taking cognisance of the issue and the need for action, the RBI has issued guidelines that work as a step towards GB practices. They have designated the banks to accept newer forms of deposits termed “Green deposits”, in which funds must be used explicitly for green projects. As directed by RBI, these funds must be used for projects like renewable energy, clean transportation and sustainable agriculture. Although these guidelines were not mandatory, many Indian banks have based their operations along the same lines. An evident example is the State Bank of India (SBI), the largest public sector bank, which is a leader in this aspect with various projects like solar-powered ATMs, paperless banking and rainwater harvesting in their branches, to name a few. The bank has been working towards adopting GB practices and has established 18 green buildings and more than 3000 solar-powered ATMs nationwide [9]. Similarly, on the same lines, the largest public sector bank of the country, the HDFC bank, has also implemented various measures towards GB practices, as evident from the fact that the Carbon Reduction as reported by the bank for the year 2023 was 174.19 metric tonnes as compared to 108.12 for the year 2022. The bank also contributed to reducing carbon emissions per rupee crores of their turnover, showing a positive rent of 0.264 in FY23 and 0.309 in FY22 [10]. Similarly, other banks have also incorporated the aspects of green loans, paperless banking, and green buildings to pledge their support for sustainability. Still, the Indian sector requires more proactive work and guidelines. The absence of proper and well-set guidelines, as well as the non-mandating nature of the same, still leaves a gap in terms of implementation and adoption.
2.3 Green Banking practices and Green Finance
GF is a popular term that is widely used to denote the amalgamation of social and economic gains concerning environmental stability. Green finance is where banks allocate financial resources towards projects that promote ecological stability and reduce carbon emissions, thus catering to the more significant aspect of GB. GF helps banks reduce their carbon footprint and become more sustainable. It has been observed by Biswas [6] that the emergence of GB practices in the banking infrastructure has led to better sustainable economic growth within the various economies. The same is corroborated by Desalegn and Tangl [11], who advocated that green finance, a subset of GB, is also an essential tool for banks to reduce their carbon footprint and foster economic development. The banks have been using these GF options to finance various projects like renewable energy, green vehicle loans, the setup of alternative energy companies, and developing green homes. These projects and initiatives by the bank help them to reduce their carbon impact externally and thus move towards better GB in practice.
The role of GF with green bonds has been studied by Prakash and Sethi [12], and they show that these bonds are a viable option for green projects and sustainable development of the country. They highlighted the role of green bonds as a feasible alternative to financing green projects in India and their popularity in helping banks overcome their carbon-intensive externalities and promote GB. While studying GB in detail, as well as the various strategies, Bhardwaj and Malhotra [13] highlighted that the various sources of GB and GF have been helping the banks to perform better in terms of environmental stability. The various practices of banks to move towards solar energy, cutting paper usage, and rainwater harvesting have been shown to improve environmental performance while adhering to the highest standards of GB practices [14]. The internal operations' role in employee-related training, staff awareness, and development of green infrastructure shows support for the bank using GF, which in turn helps their performance in terms of environmental stability [15-18]. Overall, it can be stated that GF is another aspect of the various GB practices adopted by banks, and it plays an essential role in attaining sustainable economic development in a country. It helps the banks to negate their impact on the environment and the various negative externalities while also helping them perform better in terms of environmental performance and sustainability standards. These arguments allow the formation of the following hypothesis, which is central to the theme of the study, to understand the aspect of green finance concerning the various GB practices adopted by banks.
Hypothesis 1: GB practices related to bank employees significantly impact GF.
Hypothesis 2: GB practices incorporated into banking operations significantly impact GF.
Hypothesis 3: GB practices that cater to customers significantly impact GF.
Hypothesis 4: GB policies (GBP) have developed significantly, impacting GF.
The following hypothesis can also be structured based on these hypotheses and the relation between GF and environmental performance.
Hypothesis 5: GF significantly impacts a bank’s environmental performance.
2.4 The relation between Green Banking practices and the environmental performance of banks
GB practices have been the central focus for banks to ensure environmental and economic stability while reducing their carbon footprints. Banks are the frontrunners in the financial chain of a country. While heavily invested in the industries, they become a liability to the environment if they cannot uphold the strictest environmental protection measures and policies before finding any industry [19, 20]. This aspect has created a divide in the perception of banks as both producers of climate instability and the safeguard of the same. The perception of the producers of climate instability has led the banks to introduce GB practices and thus evolve more sustainably. On the other hand, banks being more eco-friendly than other industries creates an important phenomenon where the banks must uphold the highest climate protection standards [21-24]. It obliges them to control the country's economic stability and thus invest more in sustainable technology. Management of resources contributes to people's overall quality of life. Although it must be mentioned that climate perspective has not been the driving factor of banks and their performance with the changing times and needs, these have become equally important.
A study by Rajput et al. [25] highlighted the relationship between banks' environmental performance and financial performance. They undertook the cognisance of variables like net income and profitability and used panel data modelling to highlight the relationship between them. The study showed a significant relationship between banks' GB practices and financial performance. The emphasis on the profitability of banks and the relation it shares with GB practices affirms that banks that are more concerned about environmental issues are enjoying better performance. Moving on Rehman’s [26] study, which delved into the understanding of the impact of GB practices on the environmental performance of a bank. They used the socially responsible investment theory to highlight the strong positive relationship between the two. The study also highlighted the various intricacies of the relations of policy, daily operations, and GF in terms of environmental performance [27]. A similar study was conducted by Zhang et al. [17], which showed the impact of GB on environmental performance by using SEM with primary survey data. The importance of banking operations, such as the efficiency of employees, their training, and energy-efficient practices in furthering the environmental performance of banks, has been highlighted by Vidyakala [28]. Similar studies have taken place in the regions of Bangladesh and Nepal, showing the powers of banking operations, its employees, and the consumers on the aspect of environmental performance [16, 29]. Based on these assumptions from the various studies, the following hypothesis on the nature of GB practices and environmental performance can be stated:
Hypothesis 6: GB practices related to bank employees significantly impact the environmental performance of a bank.
Hypothesis 7: GB practices incorporated into banking operations significantly impact the environmental performance of a bank.
Hypothesis 8: GB practices that cater to customers significantly impact the environmental performance of a bank.
Hypothesis 9: GBP has developed significantly, impacting the environmental performance of a bank.
This section explores the development of the empirical study and the various processes of data collection, sampling, and analysis techniques used. The section highlights the survey design, the constructs of structural modelling, and the empirical relation between the various variables.
3.1 Survey design
The study uses an elaborate survey design to model the relationship between GB practices, green finance and the environmental progress of banks. The survey has been designed to maintain the highest standards of anonymity and ethical standards with the people and to obtain informed consent from the participants. To ensure the anonymity and integrity of the participants, their information does not in any particular manner highlight their name but includes information like age, gender, qualifications, and job title to profile the sustainability of the responses. The survey was meticulously designed in sections, each denoting a particular hypothetical substance derived from the literature review. The sections are Green Banking Employees (GBE), Green Banking Operations (GBO), Green Banking Customers (GBC), GBP, and GF as well as Environmental Performance (EP). These subsections were gauged based on three sub-questions, which comprehensively described the bank's perspective. To make the answers unbiased and unadulterated, the survey was based on a Likert scale with the answers ranging from “Strongly Agree” and moving down to “Strongly Disagree.” All these were on a relative 5-pointer scale. Detailed information about the survey design regarding the various sub-questions can be found in Table 1.
Table 1. Survey design
|
Section |
Code |
Description |
|
GB practices related to employees |
GBE1 |
Availability of training concerning environmental education |
|
GBE2 |
Presence of sustainability metrics |
|
|
GBE3 |
Rewards based on green performance |
|
|
GB practices related to operations |
GBO1 |
Transition to paperless working |
|
GBO2 |
Presence of energy efficiency and sustainable practices like rainwater harvesting |
|
|
GBO3 |
Presence of online banking facilities and digital transformation |
|
|
GB practices related to consumers |
GBC1 |
Presence of green loans and related attributes |
|
GBC2 |
Reliance on online banking to decrease footfall |
|
|
GBC3 |
Inclusion of climate risk factor in customer assessment |
|
|
GB practices related to policy |
GBP1 |
Shifts towards green branches |
|
GBP2 |
Structured policy for green accessibility |
|
|
GBP3 |
Green bonds policy and potential investments |
|
|
GF |
GF1 |
Proactiveness towards green investment |
|
GF2 |
Investment in the solarisation of ATMs and branches |
|
|
GF3 |
Investment in the green infrastructure of the branch |
|
|
Environmental performance |
EP1 |
Potential decrease in energy consumption |
|
EP2 |
Decrease in carbon emissions from the branch |
|
|
EP3 |
Effective compliance with regulations related to the environment |
3.2 Sampling and data collection
The data for the study was collected by amalgamating various public and private sector banks in the region, concentrated around the NCR of India. The region comprises the cities of Noida, Delhi, Gurugram, and Greater Noida, as the region is the central zone of India, consisting of the country’s capital and an established image of the economic hub. The number of banks included in the survey was close to 35, and various branches of banks were covered. Prominent names of these banks include the SBI, the ICICI Bank, Yes Bank, IndusInd Bank, Citi Bank, and Union Bank of India, among others. To ensure that the survey was anonymised, the names of the banks have not been included in the survey information and have not been taken into cognisance for evaluation. These banks have been the pioneers of economic growth and have contributed substantially to the various aspects of GB. As such, these were chosen to determine the effects of these on GF and the environmental performance of banks. The sampling method employed in the study was a purposive sampling technique to eliminate data redundancy and make it more reliable. To ensure that the sample size was adequate to achieve a 95% condolence level and adhere to the minimum limit of 385 responses, the study chose to circulate 450 samples across the region. The survey was conducted in February and March 2024. Out of the total circulation, the response rate was 91%, with 411 responses recovered. The survey was based on a five-point Likert Scale, making it easier to record the employees' responses.
3.3 Rationale for SEM
The study uses SEM as the primary method because it allows for modelling complex relationships between variables. It caters to unobserved variables with the help of latent constructs and helps better understand the underlying mediating effects of the various defined variables. Compared to traditional methods, it was chosen because it estimates both the direct and indirect relationships between the variables, helping to understand the variable interactions better. In this study, other approaches, such as panel analysis, were discarded as the data under consideration is primarily involved in a cross-sectional fashion and not a time series fashion. Thus, adhering to every aspect of the data and the need of the study, it was highlighted that SEM is the best-suited method for the same.
3.4 Data analysis strategy
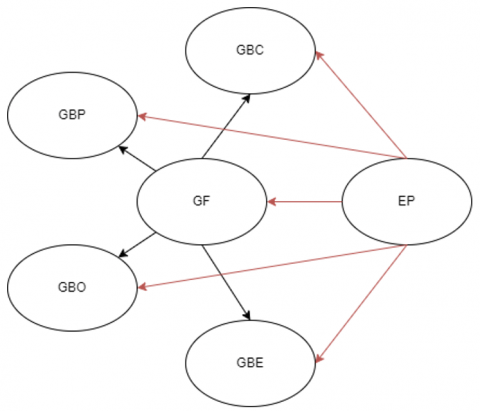
The data analysis of the survey was based on three paradigms, one being the exploratory factor analysis (EFA), which provided the descriptive statistics of the model, the discriminant analysis and the confirmatory factor analysis (CFA), where the various strategies like the Cronbach alpha as well as fit indices of the modelling were tested and finally the SEM. The role played by the EFA includes preprocessing the data and providing insights into the reliability of the survey stats to screen and ensure that the data is fit for further processing; the EFA also includes reliability tests like factor loadings. The study followed this by exploring the discriminant validity analysis of the various constructs. The next step, which was followed by the study, was the CFA, mainly with respect to the various indices to compare the reliability of the findings. The primary analysis is then done with SEM modelling, which includes the definition of the latent constructs of the various inputs, such as GBP, GBO, GBC, and GBE, as well as the mathematical relation between the variables. A structural model of the various hypotheses and the variables can be found in Figure 1, which denotes the conceptual model.
This section delves into the various data exploration strategies discussed. It will use the respondents' descriptive statistics to build a population profile and various confirmation tests to ensure the survey is suitable and effective. Later, it delves deeper into the understanding of structural modelling and the multiple indices that define the nature and reliability of the hypothesis.
4.1 EFA
In this, the respondents' demographic information has been explored, which helps to get a better idea of the population associated with the banking sector as well as the various decision-making aspects of it. From Table 2, we can see that out of the total number of 411 participants, the male category was predominantly represented by around 63.50%, while the females represented around 36.50% of the whole population. On the other hand, the middle-aged workforce is prevalent in the banking sector, with the 25-34-year bracket taking about 25.91% and the 35-44-year bracket taking 22.99% of the population. It must also be noted that the respondents comprised the older population of the bracket of 44-54, denoting an equal likability of 20.80%. While delving into the personnel's qualifications, we see that about 53.28% had an undergraduate degree followed by a postgraduate or high school diploma in the specific order. This showed that most of the populace is aware of the environmental shifts and pertains the necessary educational skills to be relevant to the sector and GB as a whole. The survey also revealed the populace of the survey respondents were people who had been working in the industry for more than 4 years, representing 44.16%, while others with about 1 to 4 years of experience participated 35.04%, followed by freshers 20.80% of the representation. This shows that the populace is adept in terms of experience and education, while there are staggering figures in the presence of the male populace compared to their female counterparts.
Table 2. Descriptive statistics
|
Variable |
Indicators |
Frequency |
Percentage |
|
Gender |
Male |
261 |
63.50% |
|
female |
150 |
36.50% |
|
|
Age |
18 - 24 |
51 |
12.41% |
|
25 - 34 |
106 |
25.91% |
|
|
35 - 44 |
94 |
22.99% |
|
|
44 - 54 |
85 |
20.80% |
|
|
55 and above |
73 |
17.88% |
|
|
Educational qualifications |
Less than high school |
31 |
7.66% |
|
High School Diploma |
49 |
12.04% |
|
|
Undergraduate |
219 |
53.28% |
|
|
Postgraduate or higher |
111 |
27.01% |
|
|
Position |
Officer |
153 |
37.23% |
|
Junior officer |
142 |
34.67% |
|
|
Trainee |
91 |
22.26% |
|
|
Manager |
24 |
5.84% |
|
|
Experience |
Fresher |
85 |
20.80% |
|
1 - 4 years |
144 |
35.04% |
|
|
More than 4 years |
181 |
44.16% |
To ensure that various indicators were reliable, the study used principal component analysis (PCA) to understand the model estimates and factor extractions (Table 3). The EFA was done on the various latent constructs concerning the analysis of the energy values associated with each factor. It included the test of Cronbach’s alpha to understand the internal reliability of the constructs while also specifying how well the items measure the latent construct. Generally, a high Cronbach alpha value greater than 0.8 is considered right for a survey. At the same time, the results yielded a high value of 0.93 for the whole. The individual values for the various latent constructs lay in the range of 0.82 to 0.91, showing reliability in the various constructs and thus instilling confidence in the various measures [30, 31]. To understand and test for factor loadings, the preliminary tests of the Kaiser-Meyer-Olkin Measure revealed a value of 0.96, representing the variables that are sufficient for factor analysis [32]. This result was also personified by Bartlett’s Sphericity Test, which denoted the p-value of p<0.005, showing a high significance level for factor analysis [33]. Subsequent aspects of the EFA indicated that the various latent constructs and the corresponding items are innately important. Thus, all were kept in the study owing to their factor loadings. The factor analysis revealed that the factor loadings of the different measures were somewhere in the range of 0.778 and 0.831, which confirms the measure of the survey design and vouches for the reliability of the same.
4.2 Discriminant validity
To examine the aspect of how the constructs are in terms of discriminant validity, the average variance extracted (AVE) square root value, as well as the correlation coefficient factors among them, were calculated (Table 4). The AVE value was in the range of 0.58 to 0.66, which is a good value of inter-construct reliability, ensuring that these have good convergent validity. The internal consistency and reliability were further established, with the composite reliability of each factor being greater than 0.70. The diagonal bold values confirm discriminant validity, with the square root of AVE being higher than the correlation between constructs.
To ensure that the model and the whole study were robust, the HTMT value was also calculated with respect to various constructs because it was more reliable. The HTMT results are shown in Table 5, with each value for the various factors being less than the 0.85/0.90 threshold, showing no discriminant validity issue. From the various results, it could be concluded that the constructs have discriminant validity under conservative criteria and measure distinct concepts.
Table 3. EFA and factor loadings
|
Variables |
Items |
1 |
2 |
3 |
4 |
5 |
6 |
|
GBE |
GBE1 |
0.812 |
|
|
|
|
|
|
GBE2 |
0.824 |
|
|
|
|
|
|
|
GBE3 |
0.778 |
|
|
|
|
|
|
|
GBO |
GBO1 |
|
0.801 |
|
|
|
|
|
GBO2 |
|
0.813 |
|
|
|
|
|
|
GBO3 |
|
0.787 |
|
|
|
|
|
|
GBC |
GBC1 |
|
|
0.829 |
|
|
|
|
GBC2 |
|
|
0.831 |
|
|
|
|
|
GBC3 |
|
|
0.799 |
|
|
|
|
|
GBP |
GBP1 |
|
|
|
0.795 |
|
|
|
GBP2 |
|
|
|
0.822 |
|
|
|
|
GBP3 |
|
|
|
0.778 |
|
|
|
|
GF |
GF1 |
|
|
|
|
0.808 |
|
|
GF2 |
|
|
|
|
0.821 |
|
|
|
GF3 |
|
|
|
|
0.783 |
|
|
|
EP |
EP1 |
|
|
|
|
|
0.827 |
|
EP2 |
|
|
|
|
|
0.831 |
|
|
EP3 |
|
|
|
|
|
0.810 |
|
|
Eigenvalues |
|
5.482 |
4.931 |
4.512 |
3.891 |
3.412 |
3.021 |
|
KMO = 0.96 and Bartlett’s test of sphericity = p<0.005 |
|||||||
Table 4. Discriminant validity (Fornell-Larcker method)
|
Constructs |
GBE |
GBO |
GBC |
GBP |
GF |
EP |
AVE |
CR |
CA |
|
GBE |
0.79 |
0.63 |
0.85 |
0.80 |
|||||
|
GBO |
0.65 |
0.76 |
0.58 |
0.83 |
0.77 |
||||
|
GBC |
0.60 |
0.67 |
0.78 |
0.61 |
0.84 |
0.79 |
|||
|
GBP |
0.55 |
0.61 |
0.63 |
0.77 |
0.59 |
0.82 |
0.76 |
||
|
GF |
0.52 |
0.58 |
0.60 |
0.64 |
0.80 |
0.65 |
0.86 |
0.81 |
|
|
EP |
0.50 |
0.54 |
0.57 |
0.62 |
0.72 |
0.81 |
0.66 |
0.87 |
0.82 |
Table 5. Discriminant validity using Heterotrait-Monotrait Ratio (HTMT)
|
Constructs |
GBE |
GBO |
GBC |
GBP |
GF |
EP |
|
GBE |
||||||
|
GBO |
0.72 |
|||||
|
GBC |
0.68 |
0.74 |
||||
|
GBP |
0.61 |
0.66 |
0.70 |
|||
|
GF |
0.58 |
0.63 |
0.65 |
0.69 |
|
|
|
EP |
0.54 |
0.60 |
0.62 |
0.67 |
0.75 |
|
4.3 CFA
With EFA and discriminant validity being successfully performed on the data, the whole was then attributed to empirical testing with the help of SEM and CFA analysis of the measurement model. The modelling aspect combined the measurement model, which calculated the combination of the various parameters with respect to the Latent variables, while the structural model adhered to the aspect of the interaction of the various latent constructs with respect to the predictions of GF and EP. Table 6 shows the relations of the measurement model with the p-value, the standardised estimate, and the standard error for each construct, denoting the significance of the relationship. The table shows that the estimators of the various constructs are all significant in terms of the p-value statistic and are reliable in calculating the effects of the different individual indicators and their interdependency. While looking at the various indicators, it is noticeable that all have similar estimates regarding the defining relation. In contrast, some show prominence over others, but there is still uniformity in the assumption and the statistical inference. The table further demonstrates that the measurement model is fit, and thus, moving on, the structural model and its estimates are studied.
The model's performance was gauged with the help of various indices, which provide an idea of how the model faired compared to the baseline models, with no significant relationship between them. A summary of the same can be seen in Table 7. The various indicators include the Chi-squared P-value, which signifies that the model is fairer and that the hypothesis can be accepted. While the other indices include the comparative fit index, the goodness of fit index, the normed fit index and the Tucker-Lewis index, all these indexes must have a value closer to 1 for the model to be deemed a good observational fit. Since the table denotes that all the indices are closer to one, it can be said that the model faired well in terms of the unknown data and made correct assumptions. To make this more evident, the value of RMSEA, which must be less than 0.08 for good models, denotes that our model performed fairly well and the estimates are all reliable [34].
Table 6. Measurement model and CFA
|
Construct |
|
Operator |
Item |
Estimate |
Std Error |
p-value |
CR |
CA |
|
GBE |
GBE |
~ |
GBE1 |
0.8089 |
0.0143 |
0.02421 |
12.2456 |
0.80 |
|
GBE |
~ |
GBE2 |
0.8252 |
0.0063 |
0.03843 |
16.0635 |
||
|
GBE |
~ |
GBE3 |
0.5248 |
0.0054 |
0.04252 |
9.7037 |
||
|
GBO |
GBO |
~ |
GBO1 |
0.6735 |
0.0051 |
0.02897 |
13.206 |
0.77 |
|
GBO |
~ |
GBO2 |
0.6832 |
0.0096 |
0.02534 |
10.6458 |
||
|
GBO |
~ |
GBO3 |
0.6793 |
0.0092 |
0.03273 |
11.2609 |
||
|
GBC |
GBC |
~ |
GBC1 |
0.7136 |
0.0079 |
0.04612 |
12.2785 |
0.79 |
|
GBC |
~ |
GBC2 |
0.7415 |
0.0093 |
0.03791 |
11.8075 |
||
|
GBC |
~ |
GBC3 |
0.6643 |
0.0077 |
0.01979 |
12.3526 |
||
|
GBP |
GBP |
~ |
GBP1 |
0.6918 |
0.0081 |
0.04340 |
10.1913 |
0.76 |
|
GBP |
~ |
GBP2 |
0.7488 |
0.0089 |
0.01369 |
13.0787 |
||
|
GBP |
~ |
GBP3 |
0.6907 |
0.0085 |
0.03263 |
11.2494 |
||
|
GF |
GF |
~ |
GF1 |
0.6789 |
0.0062 |
0.03566 |
10.9484 |
0.81 |
|
GF |
~ |
GF2 |
0.7501 |
0.0120 |
0.01231 |
11.5684 |
||
|
GF |
~ |
GF3 |
0.6733 |
0.0010 |
0.03251 |
15.689 |
||
|
EP |
EP |
~ |
EP1 |
0.9442 |
0.0082 |
0.01182 |
17.1463 |
0.82 |
|
EP |
~ |
EP2 |
0.9452 |
0.0031 |
0.03468 |
18.339 |
||
|
EP |
~ |
EP3 |
0.9402 |
0.0034 |
0.02488 |
17.1928 |
Table 7. Model metrics
|
Indicator |
Value |
Cutoff Criteria |
|
Chi-squared P-value |
0.00311 |
<0.05 |
|
Comparative Fit Index (CFI) |
0.98221 |
>0.900 |
|
Goodness of Fit Index (GFI) |
0.94911 |
>0.900 |
|
Normed Fit Index (NFI) |
0.93510 |
>0.900 |
|
Tucker-Lewis Index (TLI) |
0.97732 |
>0.900 |
|
Root Mean Square Error of Approximation (RMSEA) |
0.04320 |
<0.800 |
4.4 SEM
The structural model, as shown in Figure 2, and its estimates with respect to the various statistical inferences are highlighted in Table 8. From the table, it can be an inference that the various practices which the banks are following with respect to GB in terms of their operations, their employee training, as well as their consumer services and policy implications all are contributing positively to GF as well as to the banks’ environmental performance as a whole.
The table shows that the relationship between GF and the various aspects of GB practices that banks have adopted plays a significant and positive role. The highest estimate of the GBP and GF shows a major role played by policy implications of a banking operation to change how its green finances are managed. On the other hand, it must be highlighted that all the various parameters are statistically significant at a 95% level of confidence, which shows that the various hypotheses which are H1 denoting the relation between employee practices and GF is significant, H2 the relation between operations management and GF is significantly impactful. Hypothesis H3, which signifies the relationship between consumer and GF, is also significant, and most importantly, the relationship between policy and GB, as denoted by H4, is also significant with the highest estimated standard. This shows the major role of policy implications which govern the financing actions of a bank, albeit not only in terms of GF but also their daily processing. The other hypothesis, H5, which relates the aspect of GF and environmental performance, is also significant. It corroborates the economic theory that with increased banks' pledges towards GF, their overall performance will increase environmentally. The other hypotheses of H6, H7 and H9 are all significant in terms of the 95% confidence level, while H8 is significant with a 99% confidence level. This shows the importance of consumer-related practices and the promotion of the same, which leads to better environmental performance for banks. With a focus on consumers, the banks change their internal processes to include paperless work, reduce footfalls, and thus increase their base digitally. These allow the various banks to perform better in terms of battling climate change and embracing the aspects of GB. The following section delves into the performance of the SEM analysis using various indices and statistics, which show the goodness of fit for the model.
Table 8. Structural model and hypothesis testing
|
Hypothesis |
lval |
op |
rval |
Est. Std |
Std. Err |
p-value |
|
H1 |
GF |
~ |
GBE |
0.0583 |
0.0045 |
0.04873 |
|
H2 |
GF |
~ |
GBO |
0.3528 |
0.0074 |
0.02601 |
|
H3 |
GF |
~ |
GBC |
0.1218 |
0.0073 |
0.01991 |
|
H4 |
GF |
~ |
GBP |
1.2835 |
0.0097 |
0.04899 |
|
H5 |
EP |
~ |
GF |
0.3049 |
0.0118 |
0.01453 |
|
H6 |
EP |
~ |
GBE |
0.5120 |
0.0045 |
0.01001 |
|
H7 |
EP |
~ |
GBO |
0.6715 |
0.0036 |
0.04557 |
|
H8 |
EP |
~ |
GBC |
0.1557 |
0.0012 |
0.00445* |
|
H9 |
EP |
~ |
GBP |
0.3118 |
0.0123 |
0.04607 |
4.5 Experimental setup
The modelling process was carried out with the help of the Python 3.12.8 setup to facilitate reproducibility. Various known libraries were used in the process, including the memory library, which supports Structural Modelling, and the matplotlib library, to visualise results. The choice of Semopy is attributed to its user-friendly syntax, which allows for better optimisation, and it consists of better statistical evaluation metrics like the RMSEA, CFI, and TLI, which are important for SEM analysis. The library's ability to handle the CFA seamlessly and visualise the path diagrams made it suitable for the work. The usage of Python as a whole for this study ensures that all the steps are codified. This allows the scripts to be replicated and executed in any environment that supports Python with the given input data and specified model. This provides for the methodology to be independently validated and reliably reproduced.
The various hypotheses that have been the basis of the study show particular significance in India's banking sector. The relationship between GF and GB practices related to employees suggests that the workforce is increasingly important regarding environmental consciousness. The employee training initiatives focused on sustainability help to collaborate with hypothesis H1 while aligning it with the various literature studies. In terms of the role played by operational initiatives of the bank with respect to green finance, it is seen that Indian banks are more focused on adopting practices like paperless working and energy-efficient technologies, thus improving their continuation of GF. Overall, the banks promote a culture of sustainability and environmental consciousness while catering to their operations more effectively. These prove that the hypothesis H2 is significant and in line with previous studies. The other pillar of GF is policy-related regulations and practices. Implementing and formulating such green practices-related policies contribute not only to banks pledging more towards sustainability but also their effectiveness in promoting green tracks. The various policy shifts, such as green loans, attract more companies investing in sustainability, thus increasing green finance for banks. This shows that Hypothesis H3 is in line with the studies. In terms of the consumer aspect, the study highlights the significance of the relationship where consumer products like online and digital banking, green loans, and products attract more consumers, thus compelling banks to participate more in green finance. Showing that hypothesis H4 is significant and corroborates theoretical evidence. While all the relations to green finance have a mediation effect on the larger environmental performance of a bank, it must be noted that hypothesis H5 shows how the positive impact of GF promotes the performance of banks. The various other factors, like employees, denoted by H6; operations, denoted by H7; policy, denoted by H8; and consumers, denoted by H9, are all significant in terms of a bank's performance. This can be understood by the fact that when employees are more adept in terms of environmental sensitisation training, they enhance the working of the banks in a sustainable manner, thus contributing to their environmental goals. The presence of environment-friendly operations, like rainwater harvesting, energy efficiency, and solar panels, shows how the operational effectiveness of banks produces better outcomes in terms of the environment and the performance of the banks as a whole. These operational and employee-related changes are only driven by policy changes and thus support the presence of green policy changes that enhance the environmental performance of the banks. With many Indian banks, it has been seen that they provide incentives to consumers around green loans and deposits, thus increasing consumer engagement in that sector and driving the overall environmental performance of the banks. Comparing practices across emerging economies is helpful in contextualising India’s GB evolution. For instance, Bangladesh Bank mandates a minimum quota for green finance, showing a more coercive institutional approach [35]. In contrast, the Reserve Bank of India (RBI) promotes green lending through incentive-based mechanisms such as PSL but does not mandate it. Similarly, Indonesia’s OJK has developed ESG regulatory frameworks and launched green bond guidelines to mobilise sustainable finance [36]. These comparisons highlight the spectrum of regulatory engagement in promoting GB and underscore India’s opportunity to adopt hybrid strategies that combine soft incentives with enforceable standards. However, it must be highlighted that the study's findings have several implications for India, including the integration of better green practices in Indian banks on a larger scale, which provides a significant focus for their employee training. The formulation of policies that are more centric towards a green economy and green development would help banks improve their infrastructure. There is also a need to create awareness of green building and energy-efficient methods to be induced in the banking system's workings. All this requires the firm hand of the RBI to support it with the help of proper regulations and policies. These could include providing incentives for GF, laying down proper guidelines, and promoting public awareness among the masses. These steps would allow the banking infrastructure to align with GB and position India as the leader in sustainable change while providing long-term economic growth.
The study aimed to provide empirical evidence in the relation of GB practices and the various aspects of environmental performance and GF in the region of India. To further this goal, the study used primary data, which was collected through the NCR region of the country and was thus subjected to rigorous analysis. The varied testing and modelling techniques were used to define the relation between the variables based on the varied literary works surveyed. The empirical analysis revealed the significance of the relationship between the practices of GB in the Indian sector and the relation that it plays to both GF and environmental performance as a whole. The prevalence of consumer-related practices, which greatly affected ecological performance, suggests that with better practices related to consumers, like online banking, reducing footfalls leads to better performance as much fewer resources are used up in the process. The study also highlights major policy implications: covering all employees, consumers and operations to make the banks more sustainable and suitable for the future. The study significantly contributes to GB in India but suffers from certain limitations. These include the fact that the survey was only focused on the bank’s perspectives and did not take into account the aspects of the people; the reliance on potential bank employees could lead to biases in terms of the banks’ image, thus needing more generalised sampling to further the study. Overall, this study provides a landscape for the prospect of the GB future in India as well as the banks' contribution in adopting the same.
[1] Thaker, J., Leiserowitz, A. (2014). Shifting discourses of climate change in India. Climatic Change, 123(2): 107-119. http://doi.org/10.1007/s10584-014-1059-6
[2] Sathaye, J., Shukla, P.R., Ravindranath, N.H. (2006). Climate change, sustainable development and India: Global and national concerns. Current Science, 90(3): 314-325.
[3] Bhatnagar, S., Kaveri, V.S. (2023). Green deposits acceptance framework: Fostering a green finance eco-system. Vinimaya, 44(1): 35-44.
[4] Rajput, N., Marwah, N. (2019). RRBs in India: Strategies for sustainable development. Global Journal of Enterprise Information System, 11(4): 40-48.
[5] Lalon, R.M. (2015). Green banking: Going green. International Journal of Economics, Finance and Management Sciences, 3(1): 34-42. http://doi.org/10.11648/j.ijefm.20150301.15
[6] Biswas, N. (2011). Sustainable green banking approach: The need of the hour. Business Spectrum, 1(1): 32-38.
[7] Ahuja, N. (2015). Green banking in India: A review of literature. International Journal for Research in Management and Pharmacy, 4(1): 11-16.
[8] Yadav, R., Pathak, G. (2013). Environmental sustainability through green banking: A study on private and public sector banks in India. OIDA International Journal of Sustainable Development, 6(8): 37-48.
[9] State Bank of India. (2024). SBI green initiatives: ESG and sustainability. https://sbi.co.in/web/sbi-green/esg/sustainability.
[10] HDFC Bank. Sustainability at HDFC. https://www.hdfc.com/blog/sustainability-at-hdfc, accessed on Feb. 3, 2025.
[11] Desalegn, G., Tangl, A. (2022). Enhancing green finance for inclusive green growth: A systematic approach. Sustainability, 14(12): 7416. https://doi.org/10.3390/su14127416
[12] Prakash, N., Sethi, M. (2021). Green bonds driving sustainable transition in Asian economies: The case of India. Journal of Asian Finance, Economics and Business, 8(1): 723-732.
[13] Bhardwaj, B.R., Malhotra, A. (2013). Green banking strategies: Sustainability through corporate entrepreneurship. Greener Journal of Business and Management Studies, 3(4): 180-193. http://doi.org/10.15580/GJBMS.2013.4.122412343
[14] Sudhalakshmi, K., Chinnadorai, K. (2014). Green banking practices in Indian banks. International Journal of Management and Commerce Innovations, 2(1): 232-235.
[15] Taneja, S., Özen, E. (2023). To analyse the relationship between bank’s green financing and environmental performance. International Journal of Electronic Finance, 12(2): 163-175.
[16] Chen, J., Siddik, A.B., Zheng, G.W., Masukujjaman, M., Bekhzod, S. (2022). The effect of green banking practices on banks’ environmental performance and green financing: An empirical study. Energies, 15(4): 1292. https://doi.org/10.3390/en15041292
[17] Zhang, X., Wang, Z., Zhong, X., Yang, S., Siddik, A.B. (2022). Do green banking activities improve the banks’ environmental performance? The mediating effect of green financing. Sustainability, 14(2): 989. https://doi.org/10.3390/su14020989
[18] Wang, Q.J., Wang, H.J., Chang, C.P. (2022). Environmental performance, green finance and green innovation: What’s the long-run relationships among variables? Energy Economics, 110: 106004. https://doi.org/10.1016/j.eneco.2022.106004
[19] Jeucken, M., Bouma, J.J. (2017). The changing environment of banks. In Sustainable Banking. Routledge, pp. 24-38.
[20] Lundgren, M., Catasús, B. (2000). The banks’ impact on the natural environment—On the space between ‘what is’ and ‘what if’. Business Strategy and the Environment, 9(3): 186-195. https://doi.org/10.1002/(SICI)1099-0836
[21] McCammon, A.L.T. (1995). Banking responsibility and liability for the environment: What are banks doing? Environmental Conservation, 22(4): 297-305. https://doi.org/10.1017/S037689290003486X
[22] Mir, A.A., Bhat, A.A. (2022). Green banking and sustainability—A review. Arab Gulf Journal of Scientific Research, 40(3): 247-263. https://doi.org/10.1108/AGJSR-04-2022-0017
[23] Liang, L.W., Chang, H.Y., Shao, H.L. (2018). Does sustainability make banks more cost efficient? Global Finance Journal, 38: 13-23. http://doi.org/10.1016/j.gfj.2018.04.005
[24] Nieto, M. (2017). Banks and environmental sustainability: Some financial stability reflections. SSRN Electronic Journal. http://doi.org/10.2139/ssrn.3082107
[25] Rajput, N., Arora, S., Khanna, A. (2013). An empirical study of impact of environmental performance on financial performance in Indian banking sector. International Journal of Business and Management Invention, 2(9): 19-24.
[26] Rehman, A., Ren, J., Liu, J., Dong, M., Yan, B., Zhao, H. (2021). Adoption of green banking practices and environmental performance in Pakistan: A demonstration of structural equation modelling. Environment, Development and Sustainability, 23: 1-21. https://doi.org/10.1007/s10668-021-01326-y
[27] Gulzar, R., Mir, A.K., Athari, S.A., Al-Adwan, A.S. (2024). Green banking practices and environmental performance: Navigating sustainability in banks. Environmental Science and Pollution Research, 31(15): 23211-23226. https://doi.org/10.1007/s11356-024-32418-7
[28] Vidyakala, K. (2020). A study on the impact of green banking practices on bank’s environmental performance with special reference to Coimbatore city. African Journal of Business and Economic Research, 15(3): 9.
[29] Risal, N., Joshi, S.K. (2018). Measuring green banking practices on bank’s environmental performance: Empirical evidence from Kathmandu valley. Journal of Business and Social Sciences, 2(1): 44-56. https://doi.org/10.3126/jbss.v2i1.22827
[30] Tavakol, M., Dennick, R. (2011). Making sense of Cronbach’s alpha. International Journal of Medical Education, 2: 53-55. http://doi.org/10.5116/ijme.4dfb.8dfd
[31] Hair, J.F., Black, W.C., Babin, B.J., Anderson, R.E. (2019). Multivariate Data Analysis (8th ed.). Cengage Learning.
[32] Shrestha, N. (2021). Factor analysis as a tool for survey analysis. American Journal of Applied Mathematics and Statistics, 9(1): 4-11.
[33] Gleser, L.J. (1966). A note on the sphericity test. The Annals of Mathematical Statistics, 37(2): 464-467.
[34] Shi, D., Lee, T., Maydeu-Olivares, A. (2019). Understanding the model size effect on SEM fit indices. Educational and Psychological Measurement, 79(2): 310-334.
[35] Khan, M., Hossain, M.S., Uddin, M. (2021). Institutional determinants of green banking adoption: Evidence from an emerging economy. Journal of Cleaner Production, 294: 126216. https://doi.org/10.1016/j.jclepro.2021.126216
[36] Utomo, M.N., Dewi, N.R., Meutia, I. (2022). ESG disclosure and green finance regulation in Indonesia: An institutional theory perspective. Asian Journal of Sustainability and Social Responsibility, 7(1): 1-15. https://doi.org/10.1186/s41180-022-00050-y