Diana Galoyan*![]() | Sergei Chernov
| Sergei Chernov![]() | Konstantin Sokolovskiy
| Konstantin Sokolovskiy![]() | Sergey Bratanovskii
| Sergey Bratanovskii![]()
© 2025 The authors. This article is published by IIETA and is licensed under the CC BY 4.0 license (http://creativecommons.org/licenses/by/4.0/).
OPEN ACCESS
In the contemporary world, social networks and the digitization of social relations exert a growing influence on the fight against corruption. However, the indicators for its assessment have proven to be inadequately adapted to these changes. The primary purpose of this research is to establish a forward-looking system of indicators for assessing corruption processes in the context of social relations' digitalisation. Based on cluster and correlation analysis, the research methodology included a quantitative and qualitative assessment of corruption processes in 52 countries. A multivariate analysis of corruption was used as the research method. Over the studied period of 2017-2021, there was a significant increase in the number of corruption cases per 100,000 population in the Bahamas (+110.38), Hungary (+54.02), Denmark (+16.81), and Paraguay (+15.24). Substantial reductions in corruption incidence were observed in Slovenia (-39.95), Switzerland (-39.41), Estonia (-15.54), and the Czech Republic (-12.60). A cluster model for classifying countries according to the level of corruption has been developed. The methods for measuring and assessing corruption derived from the study could also be applied to a wide range of illicit natural resource rent-related activities. The digitisation of social relations entails the increasing influence of digital technologies in society, facilitating the prompt identification of corruption cases and the instantaneous dissemination of information about them.
cluster, corruption, sustainable development, digitalization, rents, urbanisation
Today, corruption is a harmful and socially reprehensible phenomenon in many areas of human activity. It is not only the economy and politics that are affected, but also education, medicine, sports, and other areas [1-4]. Moreover, corruption not only undermines contemporary values of democracy and freedom but also destroys the state from within, resulting in the degradation of civil society as the essential institution for developing civilisation [5]. Over 30 years ago, an approach was introduced that defines corruption within the context of transaction cost economics and associates its cause with the characteristics of both monopoly and efficient risk-bearing approaches to contract formation [6].
Abuse of power and distrust in the political system are now global issues that are interconnected to a certain extent [7]. Corruption is one of the biggest problems for most states and their ability to stay stable on a social and economic level [8]. However, different perspectives exist on how to best measure it [9]. Those who study and deal with these issues must develop better tools to define and explain basic corruption types [10]. Corruption hinders economic growth, a phenomenon accentuated by the inverse relationship between the presence of natural resources and economic growth in countries with a low level of digital technology diffusion [11, 12]. Corruption introduces additional barriers to attracting investments, often contributing to violations of fair competition rules and tax evasion. These factors adversely affect economic development. Furthermore, corruption in the public budget sphere diminishes the financial capacity of the state to address social issues and combat poverty. In the realm of environmental protection, corruption inflicts irreparable harm on environmental conservation efforts and obstructs the resolution of numerous ecological challenges, including land degradation, water and air pollution, and the illegal exploitation of natural resources. Among the 17 Sustainable Development Goals, corruption has the most significant impact on Goal 1 (No Poverty), Goal 8 (Decent Work and Economic Growth), Goal 13 (Climate Action), and Goal 16 (Peace, Justice, and Strong Institutions).
Concurrently, the digitization of social relations, defined as its pervasive integration into all spheres of human activity in society, facilitates the instantaneous dissemination of information about corruption among diverse populations, eliciting a societal resonance. Electronic communication tools, such as Facebook, messaging applications, Skype, and other services, have introduced new opportunities for maintaining connections with close acquaintances. Mobile communication and email have fundamentally transformed interpersonal interactions [13]. This phenomenon represents the essence of the digitization of social relations, which permeates every aspect of social life [14].
Corruption exists in both developed and developing countries. However, its manifestations can vary, ranging from political corruption and lobbying by large corporations to commonplace bribery and abuses of power. Consequently, measuring corruption solely through a single set of criteria is challenging, necessitating the utilisation of multidimensional assessment tools. This constitutes the primary challenge in contemporary research on the subject.
Low levels of trust in government are also linked to people's negative impressions of corruption [15]. Due to the digitisation of global development data and the existence of a global corruption perception index, the opportunity has emerged to evaluate corruption utilising contemporary tools of statistical analysis and clustering methods.
The digitalisation of social relationships helps, in part, to identify facts and develop new tools to combat and prevent corruption [16]. Hence, the interdisciplinary measurement of corruption processes in the digital era and the development of a new system of indicators are urgent tasks of modern science today. This study aims to develop a system of indicators for evaluating corruption processes in the context of social relationships becoming more digital.
2.1 The theory of corruption
A broad definition of a complex concept like 'corruption' would include a variety of institutional and legal behaviours that vary in cause and effect across various temporal and spatial contexts [17, 18]. Depending on regional political cultures and institutional structures, it can be interpreted in various ways, as its severity and manifestations change over time and space. Furthermore, no single definition can be applied to all such cases. For instance, kleptocracies exemplify how corruption can be small- or large-scale, systemic or accidental, covert or overt, and committed by individuals or groups [19].
To commit this crime, one must illegally or, more precisely, improperly use state resources or authority for private gain [20, 21]. Using one's official position for gain is the most common contemporary interpretation of this phenomenon [22].
The United Nations now defines corruption as a crime based on gaining an advantage through the abuse of power by private or public individuals. Bribery, embezzlement, and power abuse are distinct types [23].
It is directly linked to things that hurt the world's ability to grow and use its resources. Everyone who has studied the spread of corruption emphasises the contagion effect, which occurs when a phenomenon in one country takes on similar characteristics in neighbouring states [24]. It is also critical to recognise that this phenomenon poses severe challenges to the national economy and society as a whole. Additionally, it relies on various institutional, legal, social, and economic circumstances [25].
David Jancsics identifies seven fundamental corruption theories. The public choice theory comes first [10]. Its essence lies in the recognition that there are various ways and methods through which individuals exploit public institutions for their selfish interests.
2.2 New research on corruption and its causes in society
In the contemporary world, corruption stands as a significant global challenge. There exists a correlation between economic, financial, political, and socio-cultural variables and corruption, as perceived by citizens [26]. The transfer of state resources to the private sector through public procurement procedures opens unprecedented opportunities for corruption and bribery, diminishing trust in them due to irrational use of funds [27]. The development of effective anti-corruption measures relies on a profound understanding of the social and cultural peculiarities underlying corruption in each specific country [28].
Corruption may have its roots in culture and history, yet it is fundamentally an economic and political issue. This leads to inefficiency and injustice in the distribution of public goods and costs. It is indicative of a political system that lacks interest in broader societal concerns, highlighting a governmental structure that fails to ensure the effective allocation of private interests. Political legitimacy is undermined when a government allows certain individuals to disproportionately gain private benefits at the expense of others [29].
Corruption has become a critically important area of study, as the discourse surrounding it contributes to shaping people's expectations regarding the government's capacity to address this issue. One significant consequence arising from this is that simplistic reforms are insufficient to address the matter. Therefore, institutional changes are necessary, along with additional incentives for bureaucrats to mitigate the temptation of misappropriating resources intended for public needs [30].
According to the modern theory of conformity, the behavioural dimension of crime, and the neutralisation theory, both the briber and the official being bribed may believe that their actions are lawful when it comes to public procurement corruption [31]. A study of police corruption in Pakistan reveals the need to examine its interdependence at various levels. Its emergence is primarily attributable to two economic factors: individual and institutional corruption. The first issue is low pay, and the second is a lack of a clear operational budget for expenditure. This is best explained by public choice theory and institutional theory [32].
The offence in question is usually the result of a clash between private and public interests. At the same time, grand corruption is the most common form, which represents an improper contribution to the activities of high-level public officials and politicians. Its causes can be explained from various angles, including economic, psychosocial, and regulatory [33]. Tax evasion is a criminal act closely related to official corruption [34, 35].
Perhaps inequality is another determinant of corruption. At the same time, petty corruption should be viewed as a distinct type of corruption that is more prevalent in all people's daily lives and is more likely to affect measurement [36].
Researchers identify 18 major causes of corruption in the construction industry, using Malaysia as a case study. These reasons are divided into three categories: the industry's nature, flawed regulatory systems, and illegal material incentives [37].
2.3 Global and regional features of corruption measurement
Sustainable development is severely hampered by corruption. As a result, social justice is violated, contributing to political instability. It is not limited to developing nations. However, the devastating consequences of corruption can be seen in countries that are already suffering from economic underdevelopment, political instability, and social injustice [37].
Experience worldwide demonstrates that measuring corruption helps to better understand its effects on social and economic development. Furthermore, it is critical to research various corruption regimes. This is evident from a previous study conducted in Indonesian provinces, where it has been shown to impede normal sustainable development. It has also been determined that its negative impact is amplified when public investment expenditure is allocated [38]. This issue is at the forefront of regional policy discourse in most Central and Eastern Europe (CEE) states. Liberal political forces assert the deterrent function of unelected institutions, civil protest movements and populist statements about the need to support a popular initiative against corruption and bad elites. These have brought the subject under constant public scrutiny [39]. Furthermore, corruption in CEE lowers living standards and quality of life, both indirectly through institutional effects and directly through the private costs imposed on individual citizens [40].
In recent years, various instruments have been employed to measure corruption, encompassing the following approaches: firstly, surveys of respondents are conducted to assess corruption perceptions and self-reported instances; secondly, administrative corruption statistics are taken into account; thirdly, indicators of political connections or conflicts of interest are applied, utilising administrative data [41]; fourthly, micro-level corruption indicators, such as inflated prices or costs associated with government procurement, are utilised for detection purposes [42]. Additionally, for these purposes, the European Quality of Government Index is employed, collectively characterising the levels of corruption, impartiality, and the quality of government services [43].
Most corruption studies suffer from a common challenge: there is no objective measure of corruption in the public sector that applies universally across different countries. Research on the determinants or consequences of corruption typically relies on indicators of corruption perception. In recent years, a second type of indicator reflecting experiences in combating bribery has become available [44].
Corruption in public administration in Russia is directly related to a conflict of interest, in which an official's private or personal interest interferes with their ability to perform their duties objectively. At the same time, they make a choice and act contrary to what is best for the state and society [22]. As a result, the state suffers.
Another example is Kazakhstan, a regional hotspot of stability until recently. However, at the beginning of 2022, Kazakhstan experienced a brief period of turbulent instability and unrest. Their justification includes the fact that this country has never been able to resolve complex issues with abuse, particularly when it comes to the context of public procurement tenders [45].
In the digital age, thanks to the emergence of modern tools for controlling sustainable development and government regulation, e-government has a statistically significant impact on overcoming and reducing corruption. It comprises three components: a telecommunication system, online participation, and online services [46]. An examination of several national indicators, including GDP per capita, economic openness, the government efficiency index, inflation, and level of education concerning the corruption index, reveals that enrollment in secondary education harms corruption in G20 member states. In contrast, GDP per capita only had a positive, significant impact in developing countries and a negative, significant impact in developed ones. However, inflation and economic openness significantly and favourably impacted the corruption level. Only developing countries, though, saw this improvement [47].
3.1 Research design
The key hypothesis. The prevalence of corruption in CEE, CA, and SC countries is determined by two factors: the share of resource rent in the national economy and the population's perception of its socio-cultural value, which varies according to the level of urbanisation. This hypothesis was supported by the methodological approaches of Acemoglu and Robinson [48], Al-Jundi et al. [49], and Benk et al. [50]. Simultaneously, institutional and political corruption are more characteristic of EU countries, the USA, and Canada [51, 52].
The study utilised data on corruption cases statistics officially reported by countries worldwide to the United Nations (UN) under the International Classification of Crimes for Statistical Purposes (ICCS). According to the regulations of this classification, these are unlawful actions defined in the UN Convention against Corruption and other national and international legal documents against corruption ICCS 0703 [53]; bribery, which entails the promise, offer, provision, solicitation, or acceptance of an undue advantage to a public official or an individual directly or indirectly managing or working in the private sector, with the aim of inducing that person to act or refrain from acting in the performance of their official duties ICCS 07031 [53]; other acts of corruption include embezzlement, abuse of office, abuse of influence, illicit enrichment, and all other corrupt actions not mentioned above ICCS 07032-07039 [53]. The unit of measurement is an individual offence. Each incident with a specific location at a particular moment in time is counted separately. The Corruption Rate per 100,000 population indicator was utilised.
A time series of 2017-2021 was chosen to analyse the Corruption. Corruption-related factors were also selected to confirm or refute the research hypothesis through quantitative and qualitative analysis of various literature sources and information from the UN and World Bank Development Indicators Database. For cluster analysis, data from the year 2020 were selected as they were available for all countries under study. These data encompassed the following indicators: Corruption (Rate per 100,000 population), Tax revenue (% of GDP) GDP (current US$), Total natural resources rents (% of GDP), Population ages 65 and above (% of total population), Rural population (% of total population).
3.2 Sample
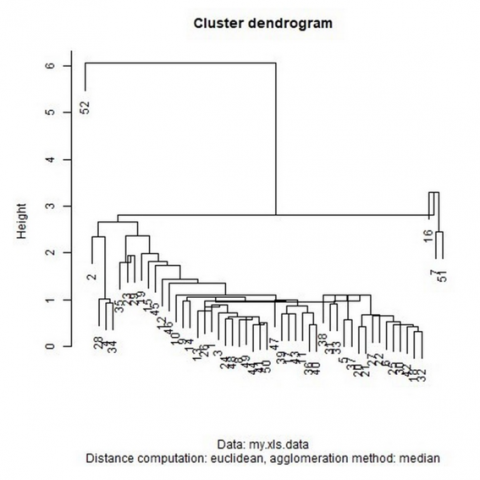
A special procedure based on the hclust function in the statistical data processing package R was used for automatic cluster formation in the cluster analysis. The authors used cluster analysis to conduct a more accurate analysis. For both methods, calculating the Euclidean distance between observations and respective cluster centres was used. Utilising the method of Euclidean distance calculation and employing the option of cluster analysis based on data from 52 countries, coupled with a comparison of the Corruption Perception Index with the percentage share of resource rent in GDP (current US$), urbanisation, and the percentage of the population aged over 65, a dendrogram was constructed. This dendrogram is a tree-like diagram comprising n levels, each representing a step in the process of sequential agglomeration of clusters.
A multiple linear regression model was created using the least-squares method and a plausibility analysis based on the Heteroskedasticity-robust standard errors procedure. The managerial (control) variable in this context is the GDP Economic Growth indicator. The initial criterion for selecting countries to construct the model was the presence of positive economic growth. This variable exerts influence on both the dependent variable and the two independent variables included in the model.
The dependent variable is the Corruption (Rate per 100,000 population). The independent variables are Total natural resources rents (% of GDP) and Urban population (% of total population). The novelty of incorporating these two independent variables into the model lies in the examination of the influence of both a socio-demographic factor and the economic development system of the country. Previously, situations involving a close relationship between corruption and rent-based incomes were explored when studying countries with predominant resource-extractive economies and rural populations. In the contemporary world, profound changes have occurred, and currently, in countries with high corruption levels, the level of a rent-based economy coexists with urbanisation. The selection of indicators for cluster analysis is justified by their relevance to sustainable development and manifestations of corruption. These include the level of tax collection, the state of economic development and its structure, and the share of natural resource rent in GDP as an economic-ecological factor. Additionally, two indicators reflecting social influences on corruption levels were incorporated: the proportion of the population aged over 65 and the degree of urbanisation.
3.3 Data collection
The data for this study came from 52 countries in Europe, Africa, the Americas, Asia and the former Soviet republics. These countries: Albania, United Arab Emirates, Austria, Azerbaijan, Belgium, Bulgaria, Bahamas, Bosnia and Herzegovina, Switzerland, Chile, Colombia, Costa Rica, Cyprus, Czechia, Germany, Denmark, Ecuador, Estonia, Finland, France, United Kingdom, Greece, Guatemala, Croatia, Hungary, Ireland, Italy, Kazakhstan, Kenya, Lithuania, Luxembourg, Latvia, Macao SAR, China, Mongolia, Mauritius, Malaysia, Netherlands, Norway, Panama, Peru, Poland, Portugal, Paraguay, Romania, Russian Federation, Singapore, El Salvador, Serbia, Slovak Republic, Slovenia, Sweden, United States. The sample comprising 52 countries was derived from an analysis of data available through the UNODC Research - Data Portal on Corruption and Economic Crime. For these countries, information on corruption-related offenses was accessible.
3.4 Limitations
During the hierarchical cluster analysis, data from 52 countries worldwide for the year 2020 were utilised, excluding countries for which information on corruption cases in UN statistics was unavailable. Unfortunately, there is missing data in certain years in the UN statistical database for these countries, which prevents a dynamic examination of this issue.
3.5 Statistical analysis
The research database was created with the help of Microsoft Excel. Cluster analysis was carried out in the R statistical processing of scientific data programme. The hierarchical cluster analysis method was employed utilising the Euclidean distance calculation method and agglomerative clustering techniques, specifically employing the median and Complete Linkage (furthest neighbour) methods.
All nations suffer from some degree of corruption. According to UN data, the phenomenon is quite widespread globally, and it now exists in one form or another in the USA, the United Kingdom, France, Germany, Sweden, Switzerland, Italy, Russia, Kazakhstan, Bulgaria, Poland, Hungary, Slovenia, Malaysia, Kenya, Ecuador, and numerous other countries worldwide.
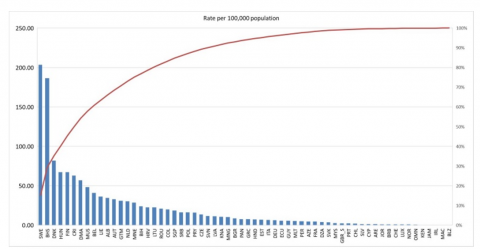
The Pareto principle 20/80 aids in comprehending the distribution of corruption cases worldwide. Approximately 20% of countries exhibit the highest level of corruption cases per 100,000 population, while the remaining 80% of countries account for other manifestations of corruption (Figure 1).
Figure 1. The quantitative analysis of country rankings in key world regions according to the corruption rate per 100,000 population
Among these countries, Sweden recorded the highest number of corruption cases – 190.87. Following closely is the offshore-related Bahamas Islands – 160.67. Within the EU, Finland reported 73.08; Denmark – 66.48; Austria – 32.32. In the United States, 2.80 cases of corruption per 100,000 population were identified, while in Switzerland, the figure stood at 0.24. The Corruption Rate per 100,000 population is calculated by comparing various types of corruption: bribery, misappropriation of public funds, use of public office for personal gain, nepotism in public service, and other phenomena associated with government corruption.
At the same time, selected CEE and former Soviet republics are the most problematic regions of the world.
A study of the evolution of Corruption from 2017 to 2021 reveals several noteworthy trends. To begin, the countries in the region can be roughly divided into three groups: those that have seen a significant improvement in the fight against corruption, those that have seen a deterioration, and those that have seen little change (Table 1).
Countries where the number of corruption cases per 100,000 population has significantly increased include the Bahamas (+110.38), Hungary (+54.02), Denmark (+16.81), and Paraguay (+15.24). The most rapid decrease in corruption incidence was observed in Slovenia (-39.95), Switzerland (-39.41), Estonia (-15.54), and the Czech Republic (-12.60). At the same time (2020-2021), there has been a slight deterioration in the fight against corruption in Sweden (+12.45), Hungary (+42.73), and Denmark (+15.12).
Cluster analysis is used to group countries with similar corruption situations by comparing the corruption Score to the percentage share of resource rents generated in GDP, Tax revenue (% of GDP), GDP (current US$), urbanisation, and the percentage of the population over 65 years old (Figure 2).
Table 1. Corruption (Rate per 100,000 population)
|
No. |
Cod |
Country |
2017 |
2018 |
2019 |
2020 |
2021 |
2021 to 2017 |
|
1 |
ALB |
Albania |
40.08 |
35.91 |
46.28 |
29.54 |
34.22 |
-5.85 |
|
2 |
ARE |
United Arab Emirates |
- |
- |
0.77 |
0.74 |
0.90 |
- |
|
3 |
AUT |
Austria |
36.48 |
35.21 |
35.56 |
32.32 |
32.67 |
-3.80 |
|
4 |
AZE |
Azerbaijan |
1.94 |
3.51 |
3.54 |
3.02 |
4.44 |
2.50 |
|
5 |
BEL |
Belgium |
40.37 |
41.31 |
41.48 |
37.17 |
40.53 |
0.16 |
|
6 |
BGR |
Bulgaria |
3.24 |
9.46 |
8.29 |
6.96 |
8.21 |
4.96 |
|
7 |
BHS |
Bahamas |
76.69 |
168.94 |
197.75 |
160.16 |
186.07 |
109.38 |
|
8 |
BIH |
Bosnia and Herzegovina |
11.13 |
12.65 |
22.35 |
27.21 |
23.82 |
12.68 |
|
9 |
CHE |
Switzerland |
40.10 |
0.22 |
0.16 |
0.24 |
0.69 |
-39.41 |
|
10 |
CHL |
Chile |
2.10 |
14.90 |
2.99 |
2.06 |
1.86 |
-0.24 |
|
11 |
COL |
Colombia |
31.37 |
22.16 |
22.83 |
20.99 |
19.81 |
-11.56 |
|
12 |
CRI |
Costa Rica |
56.57 |
54.14 |
65.02 |
61.15 |
62.81 |
6.24 |
|
13 |
CYP |
Cyprus |
2.57 |
1.39 |
1.30 |
1.05 |
0.96 |
-1.60 |
|
14 |
CZE |
Czechia |
25.86 |
24.64 |
22.20 |
16.04 |
13.25 |
-12.60 |
|
15 |
DEU |
Germany |
4.66 |
4.79 |
4.99 |
5.00 |
6.13 |
1.47 |
|
16 |
DNK |
Denmark |
64.79 |
83.81 |
87.30 |
66.48 |
81.60 |
16.81 |
|
17 |
ECU |
Ecuador |
4.96 |
6.59 |
6.50 |
7.06 |
5.35 |
0.40 |
|
18 |
EST |
Estonia |
22.09 |
28.44 |
5.43 |
6.09 |
6.55 |
-15.54 |
|
19 |
FIN |
Finland |
64.72 |
69.73 |
71.72 |
73.08 |
66.84 |
2.11 |
|
20 |
FRA |
France |
3.06 |
3.67 |
3.72 |
3.55 |
4.24 |
1.17 |
|
21 |
GBR_S |
United Kingdom (Scotland) |
3.47 |
3.46 |
3.31 |
2.36 |
2.17 |
-1.29 |
|
22 |
GRC |
Greece |
8.44 |
6.19 |
5.81 |
5.77 |
7.25 |
-1.19 |
|
23 |
GTM |
Guatemala |
35.62 |
31.55 |
33.68 |
29.03 |
30.52 |
-5.10 |
|
24 |
HRV |
Croatia |
18.15 |
12.38 |
19.01 |
13.13 |
22.46 |
4.31 |
|
25 |
HUN |
Hungary |
13.09 |
22.89 |
18.48 |
24.38 |
67.11 |
54.02 |
|
26 |
IRL |
Ireland |
0.08 |
0.12 |
0.10 |
0.12 |
0.16 |
0.08 |
|
27 |
ITA |
Italy |
5.95 |
5.62 |
5.81 |
6.34 |
6.49 |
0.53 |
|
28 |
KAZ |
Kazakhstan |
13.39 |
- |
- |
11.55 |
- |
- |
|
29 |
KEN |
Kenya |
0.15 |
0.24 |
0.26 |
0.26 |
0.18 |
0.03 |
|
30 |
LTU |
Lithuania |
25.79 |
19.30 |
17.37 |
19.54 |
22.39 |
-3.40 |
|
31 |
LUX |
Luxembourg |
0.17 |
0.49 |
0.16 |
0.79 |
0.63 |
0.46 |
|
32 |
LVA |
Latvia |
9.46 |
12.50 |
18.47 |
9.59 |
10.94 |
1.48 |
|
33 |
MAC |
China, Macao Special Administrative Region |
- |
0.00 |
0.15 |
0.30 |
0.15 |
- |
|
34 |
MNG |
Mongolia |
4.84 |
11.44 |
16.18 |
9.53 |
10.01 |
5.16 |
|
35 |
MUS |
Mauritius |
- |
- |
- |
41.45 |
47.96 |
- |
|
36 |
MYS |
Malaysia |
- |
2.57 |
3.17 |
2.58 |
2.47 |
- |
|
37 |
NLD |
Netherlands |
39.17 |
- |
38.04 |
33.75 |
30.03 |
-9.14 |
|
38 |
NOR |
Norway |
1.55 |
0.68 |
0.88 |
0.74 |
0.57 |
-0.98 |
|
39 |
PAN |
Panama |
6.91 |
8.35 |
12.85 |
6.68 |
7.45 |
0.54 |
|
40 |
PER |
Peru |
1.80 |
2.43 |
3.17 |
4.81 |
4.84 |
3.04 |
|
41 |
POL |
Poland |
19.25 |
26.05 |
16.21 |
19.53 |
15.95 |
-3.30 |
|
42 |
PRT |
Portugal |
1.71 |
1.61 |
1.65 |
1.50 |
2.06 |
0.35 |
|
43 |
PRY |
Paraguay |
0.44 |
24.34 |
20.15 |
15.31 |
15.68 |
15.24 |
|
44 |
ROU |
Romania |
27.59 |
22.33 |
20.95 |
17.56 |
20.78 |
-6.81 |
|
45 |
RUS |
Russian Federation |
20.37 |
20.94 |
21.26 |
21.16 |
- |
- |
|
46 |
SGP |
Singapore |
21.63 |
23.39 |
10.06 |
15.53 |
18.31 |
-3.32 |
|
47 |
SLV |
El Salvador |
0.62 |
0.88 |
1.16 |
0.84 |
1.05 |
0.42 |
|
48 |
SRB |
Serbia |
20.09 |
15.86 |
14.21 |
10.13 |
15.97 |
-4.13 |
|
49 |
SVK |
Slovakia |
3.07 |
2.77 |
2.49 |
2.40 |
3.41 |
0.34 |
|
50 |
SVN |
Slovenia |
46.27 |
10.11 |
10.36 |
14.73 |
11.32 |
-34.95 |
|
51 |
SWE |
Sweden |
209.73 |
206.95 |
200.79 |
190.87 |
203.31 |
-6.42 |
|
52 |
USA |
United States of America |
4.84 |
4.45 |
4.04 |
2.80 |
- |
- |
Figure 2. Hierarchical dendrogram for country clustering according to the level of corruption and related factors
In the course of calculations, three primary clusters of countries were identified. The first cluster comprises countries with a recorded high number of corruption cases per 100,000 population: Sweden (190.87), the Bahamas (160.16), and Denmark (66.48). The reasons for the high level of corruption in these countries vary. In Sweden and Denmark, there exists an effective legal system aimed at maximum detection of these cases, whereas the Bahamas serves as one of the global centres for offshore financial operations. Additionally, the factor of high taxation in Sweden and Denmark has a certain influence, leading to frequent attempts to evade tax payments through corrupt schemes.
The second cluster consists of countries such as the United Arab Emirates (0.74), Azerbaijan (3.02), Kazakhstan (11.55), and Mongolia (9.53). In these countries, corruption is based on the redistribution of natural rents.
The third cluster encompasses all other countries, including the United States, the United Kingdom, France, Germany, and others. Unlike the first and second groups, these countries are characterised more by political institutional corruption, associated with abuse of office or power for personal gain, various forms of nepotism in public service, favouritism towards relatives and friends, as well as bribery.
The Balkan countries are Albania, Bosnia and Herzegovina, Croatia, Serbia, and Slovenia, where this phenomenon has historically been prevalent and linked to organised crime, drug trafficking, and smuggling. The listed countries have nearly the same Corruption (Rate per 100,000 population) and share problems related to its prevalence in local governments. Overall, this phenomenon has a complex, multi-level impact on the development of the countries studied.
The degree of urbanisation and the proportion of citizens over 65 years old should be considered when analysing the population's socio-cultural values ascribed to corruption. There is a link between these factors and the Corruption Perceptions Index in some countries. The level of resource rent income in GDP and the share of the urban population in the total population had the greatest impact on Corruption. The greater the share of resource rents, the worse the corruption situation. In contrast, the higher the percentage of urbanisation, the better the corruption control. The reduction or increase in the share of income derived from the utilisation of natural resources, as well as urbanisation trends, are expected to influence the level of corruption in the future.
The ecological dimension of sustainability in this study is examined through the lens of assessing the extent to which resource rents are utilised in the economy. Countries with a high proportion of total natural resources rents (% of GDP) tend to exploit the environment and natural resources to a greater extent, often conflicting with the Sustainable Development Goals (SDGs).
The indicators Total natural resources rents (% of GDP) and Tax revenue (% of GDP) exhibit an inverse correlation (negative correlation coefficient: −0.475; p <0.01). A multiple linear regression model demonstrates the following relationship:
Corruption (Rate per 100,000 population) = −0.707685 * Total natural resources rents (% of GDP) + 0.520734* Rural population (% of total population)**.
The coefficients meet the standard reliability thresholds (p <0.10; p <0.05; *p <0.01).
In the case of natural resource rents, corruption facilitates environmental degradation, resource depletion, and climate change. In many African countries and other regions worldwide, transnational corporations frequently engage in various forms of corruption to lobby for reduced environmental obligations, the relocation of polluting industries, and the uncontrolled emission of greenhouse gases.
Corruption can have detrimental effects on sustainable development in countries characterised by low tax revenue collection and a high share of natural resource rents in the economy. These countries may also exhibit varying levels of urbanisation and diverse demographic structures.
The corruption situation is projected to improve with further urbanisation, particularly if countries in the region adopt a new model of economic development involving a reduction in the share of sectors or specific industries where this phenomenon is deeply rooted. This primarily applies to extractive sectors of the economy and energy monopolies. Transitioning away from reliance on natural resource rents towards manufacturing and high-tech sectors is expected to contribute to overcoming high levels of corruption and the establishment of rule-of-law states. This study demonstrated that in resource-rich countries, corruption exerts a negative impact on sustainable development. Primarily, it hinders investment and economic growth, the enhancement of societal well-being, and environmental conservation. The environmental consequences of corruption are closely associated with deforestation, river pollution, pesticide contamination of agricultural fields, and atmospheric emissions of pollutants resulting from unlawfully obtained permits for their use.
This study's fundamental definition of corruption is consistent with other authors, who hold that it can be broadly defined as a violation of the law or a misuse of authority to obtain benefits or income. This happens when someone in a position of authority engages in illegal behaviour to influence the outcome of a situation. Examples are a financial matter involving the acquisition of a contract, a political matter involving the bribery of a political official, and a personal matter involving the acquisition of a reward [54].
In real life, there is often a link between how much people trust the government and how they feel about taking bribes. Two opposed correlations emerge. Citizens in both rich and poor countries generally have negative attitudes towards bribery and government bureaucracy. Populations in developing and transition countries have more neutral, if not positive, attitudes towards bribery and trust in government [50].
Public power should not be used as a tool or as a way to redistribute money among its employees or a comparatively small group of associated supporters. It should be aware of people's tendency towards selfishness, particularly when they hold positions of power, and should work to prevent them from abusing their position [34].
In transitional countries like Albania, informal practices and institutions such as corruption, clientelism, and favouritism pose significant challenges to the growth of the educational system. Corruption in secondary and higher education institutions has been widely reported in the media, harming the education system's reputation. Bribery and favouritism in student assessment procedures are frequent phenomena, followed by clientelistic behaviours that began and developed due to paternalism and unofficial practices [55].
Social and cultural characteristics may account for differences among individual countries in their propensity for corruption. Drawing upon institutional theory, cultural models have been developed at macro-, meso-, and micro-levels, contributing to tendencies towards corrupt practices in Poland and Russia. The level of institutionalization of legal nihilism and ethical dualism at the macro-level, as well as micro-factors such as gender socialization and legal education, exert significant influence on the propensity for corrupt activities [28].
Corruption has far-reaching consequences as people's satisfaction with public officials' services declines. Furthermore, trust in political and public institutions is a problem [56, 57]. Free political institutions establish a level playing field in a connected and globalised world where, among other things, most citizens can enjoy their guaranteed rights. In turn, this encourages economic activity and advances science and innovation, both of which are crucial for more effective use of resources and decreasing corruption in society [49, 58, 59]. The fight against corruption can be helped in many ways by digitalisation. These opportunities may involve a scenario in which the decision is whether to use digital technology to prevent lawbreaking, corruption, or fraud and how ethical it is regarding data and information protection laws.
In the contemporary context of the ongoing digitisation of social relations, new opportunities arise for utilising a system of indicators to assess corruption cases, taking into account diverse databases, information from social networks, and other sources. This enables the rapid dissemination of information about instances of corruption and garnering public support in the fight against it.
The influence of resource rent in the national economy and its socio-cultural value perception by the population, depending on the level of urbanisation, should be considered by the modern system of indicators of corruption processes. This must be done against the background of social relationships becoming more digital. Digital technologies also make it easier to detect and assess how it manifests itself in various areas of activity, speed up information dissemination, and encourage the development of new tools and preventative measures.
According to the findings, corruption harms the economic development of CEE countries, CA, and SC. Additionally, it was discovered that the degree of urbanisation and the percentage of citizens over 65 years old should be considered when determining how the population perceives corruption from a socio-cultural perspective. There is a link between these factors and the corruption in some countries. The level of resource rent income in GDP and the share of the urban population in the total population strongly correlated with the Corruption Perceptions Index. The greater the share of resource rents, the worse the corruption situation. In contrast, the more urbanised a country is, the better the situation for preventing corrupt practices.
The indicators proposed in this study can be utilised to justify policy decisions or enhance anti-corruption efforts aimed at promoting sustainable development. In particular, the indicators Total natural resources rents (% of GDP) and Tax revenue (% of GDP) exhibit an inverse correlation, enabling the identification of corruption risks. Specifically, the higher the share of natural resource rents, the lower the proportion of tax revenue within the economy.
Overall, public procurement is a clear area where corruption is more likely to happen. Therefore, new assessment tools in the context of a digitalised economy require more focus and investigation. The developed econometric model for predicting possible changes in the Corruption Perceptions Index under different socio-economic trajectories in the countries under study enables the authors to compare various interaction factors between natural rents and urbanisation trends. In practice, its use enables the evaluation of potential paths for the region's nations to a new economic development model based on a shift away from the rent economy and towards processing and high-tech industries. However, this will not suffice; economic and legal gaps in managing sustainable and innovative development in modern economic systems must be bridged.
[1] García, P.J. (2019). Corruption in global health: The open secret. The Lancet, 394(10214): 2119-2124. https://doi.org/10.1016/S0140-6736(19)32527-9
[2] Setor, T.K., Senyo, P.K., Addo, A. (2021). Do digital payment transactions reduce corruption? Evidence from developing countries. Telematics and Informatics, 60: 101577. https://doi.org/10.1016/j.tele.2021.101577
[3] Ullah, B. (2020). Financial constraints, corruption, and SME growth in transition economies. The Quarterly Review of Economics and Finance, 75: 120-132. https://doi.org/10.1016/j.qref.2019.05.009
[4] Zimelis, A. (2020). Corruption research: A need for an integrated approach. International Area Studies Review, 23(3): 288-306. https://doi.org/10.1177/2233865920926778
[5] Botir, U., Ibodullaevich, K.K. (2022). Causes of corruption, socio-political consequences. Eurasian Journal of Humanities and Social Sciences, 8: 37-40. https://geniusjournals.org/index.php/ejhss/article/view/1387.
[6] Williamson, O.E. (1985). Assessing contract. The Journal of Law, Economics, and Organization, 1(1): 177-208. https://doi.org/10.1093/oxfordjournals.jleo.a036886
[7] Beesley, C., Hawkins, D. (2022). Corruption, institutional trust and political engagement in Peru. World Development, 151: 105743. https://doi.org/10.1016/j.worlddev.2021.105743
[8] Igiebor, G.O. (2019). Political corruption in Nigeria: Implications for economic development in the Fourth Republic. Journal of Developing Societies, 35(4): 493-513. https://doi.org/10.1177/0169796X19890745
[9] Carloni, E., Gnaldi, M. (2021). Understanding and Fighting Corruption in Europe. Springer Cham. https://doi.org/10.1007/978-3-030-82495-2
[10] Jancsics, D. (2019). Corruption as resource transfer: An interdisciplinary synthesis. Public Administration Review, 79(4): 523-537. https://doi.org/10.1111/puar.13024
[11] Erum, N., Hussain, S. (2019). Corruption, natural resources and economic growth: Evidence from OIC countries. Resources Policy, 63: 101429. https://doi.org/10.1016/j.resourpol.2019.101429
[12] Ramadania, R., Hartijasti, Y., Purmono, B.B., Haris, N., Muhammad, D., Afifi, M.Z. (2024). A systematic review on digital transformation and organizational performance in higher education. International Journal of Sustainable Development and Planning, 19(4): 1239-1252. https://doi.org/10.18280/ijsdp.190402
[13] Antonucci, T.C., Ajrouch, K.J., Manalel, J.A. (2017). Social relations and technology: Continuity, context, and change. Innovation in Aging, 1(3): igx029. https://doi.org/10.1093/geroni/igx029
[14] Fussey, P., Roth, S. (2020). Digitizing sociology: Continuity and change in the internet era. Sociology, 54(4): 659-674. https://doi.org/10.1177/0038038520918562
[15] Akinola, O.A., Omar, B., Mustapha, L.K. (2022). Corruption in the limelight: The relative influence of traditional mainstream and social media on political trust in Nigeria. International Journal of Communication, 16: 1460-1481. https://ijoc.org/index.php/ijoc/article/view/17438.
[16] Chernov, S. (2020). Countering corruption in the digital economy. Economic Sciences, 5(186): 139-144. https://elibrary.ru/item.asp?id=43055754.
[17] Alraggad, M.M. (2024). Legal aspect to ensuring sustainable development in Jordan: Countering crime and shadow operations. International Journal of Sustainable Development and Planning, 19(6): 2361-2372. https://doi.org/10.18280/ijsdp.190634
[18] Sarina, S.A., Nukusheva, A.A., Kalmagambetov, K.S., Kumysbekova, Z.T., Nesterova, E.V. (2016). Confession and carrying into execution of foreign arbitration courts decisions: Reciprocity and public policy. International Journal of Environmental and Science Education, 11(11): 4760-4767. https://files.eric.ed.gov/fulltext/EJ1114855.pdf.
[19] Warf, B. (2019). Global Corruption from a Geographic Perspective. Cham: Springer International Publishing. https://doi.org/10.1007/978-3-030-03478-8
[20] Datta, P., Walker, L., Amarilli, F. (2020). Digital transformation: Learning from Italy’s public administration. Journal of Information Technology Teaching Cases, 10(2): 54-71. https://doi.org/10.1177/2043886920910437
[21] Uroos, A., Shabbir, M.S., Zahid, M.U., Yahya, G., Abbasi, B.A. (2022). Economic analysis of corruption: Evidence from Pakistan. Transnational Corporations Review, 14(1): 46-61. https://doi.org/10.1080/19186444.2021.1917331
[22] Moiseev, V.V. (2019). State management and corruption in Russia. In 2019 5th International Conference on Social Science and Higher Education (ICSSHE 2019), pp. 34-37. https://doi.org/10.2991/icsshe-19.2019.271
[23] UN Office on Drugs and Crime. (2023). Corruption. https://www.unodc.org/unodc/en/data-and-analysis/statistics/corruption.html.
[24] O'Trakoun, J. (2017). New perspectives on corruption contagion. The Journal of International Trade Economic Development, 26(5): 552-565. https://doi.org/10.1080/09638199.2017.1281340
[25] Dimant, E., Tosato, G. (2017). Causes and effects of corruption: What has past decade's empirical research taught US? A survey. Journal of Economic Surveys, 32(2): 335-356. https://doi.org/10.1111/joes.12198
[26] Raya-Quero, D., Navarro-Galera, A., Sáez-Lozano, J.L. (2024). Factors influencing political corruption. An empirical research study of regional governments. International Review of Administrative Sciences, 90(1): 149-166. https://doi.org/10.1177/00208523231159244
[27] Dikmen, S., Çiçek, H.G. (2023). Fighting against corruption and bribery in public procurements during the COVID-19 pandemic. In The Ethics of Bribery: Theoretical and Empirical Studies. Springer, pp. 309-328. https://doi.org/10.1007/978-3-031-17707-1_18
[28] Fürstenberg, A., Starystach, S., Uhl, A. (2023). Culture and corruption: An experimental comparison of cultural patterns on the corruption propensity in Poland and Russia. European Journal of Criminology, 20(5): 1719-1739. https://doi.org/10.1177/14773708221081017
[29] Rose-Ackerman, S. (1999). Corruption and Government: Causes, Consequences, and Reform. Cambridge: Cambridge University Press.
[30] Gupta, A. (2005). Narrating the state of corruption. In Corruption. Anthropological Perspectives, pp. 173-193.
[31] Gottschalk, P. (2017). Convenience theory of white-collar crime. In Investigating White-Collar Crime. Springer, Cham, pp. 13-29. https://doi.org/10.1007/978-3-319-68916-6_2
[32] Malik, N., Qureshi, T.A. (2021). A study of economic, cultural, and political causes of police corruption in Pakistan. Policing: A Journal of Policy and Practice, 15(2): 1446-1462. https://doi.org/10.1093/police/paaa016
[33] Mahmud, N.M., Mohamed, I.S., Arshad, R. (2022). The supply-side of corruption: A review of scenario, causes and prevention measure. Journal of Financial Crime, 29(1): 34-44. https://doi.org/10.1108/JFC-06-2021-0120
[34] Ivanyna, M., Mourmouras, A., Rangazas, P. (2017). Introduction. In The Macroeconomics of Corruption. Springer, Cham, pp. 1-30. https://doi.org/10.1007/978-3-319-68666-0_1
[35] Policardo, L., Carrera, E.J.S. (2018). Corruption causes inequality, or is it the other way around? An empirical investigation for a panel of countries. Economic Analysis and Policy, 59: 92-102. https://doi.org/10.1016/j.eap.2018.05.001
[36] Yap, J.B.H., Lee, K.Y., Rose, T., Skitmore, M. (2022). Corruption in the Malaysian construction industry: Investigating effects, causes, and preventive measures. International Journal of Construction Management, 22(8): 1525-1536. https://doi.org/10.1080/15623599.2020.1728609
[37] Desta, Y. (2019). Manifestations and causes of civil service corruption in developing countries. Journal of Public Administration and Governance, 9(3): 23-35. https://doi.org/10.5296/jpag.v9i3.14930
[38] Alfada, A. (2019). The destructive effect of corruption on economic growth in Indonesia: A threshold model. Heliyon, 5(10): e02649. https://doi.org/10.1016/j.heliyon.2019.e02649
[39] Cianetti, L., Hanley, S. (2021). The end of the backsliding paradigm. Journal of Democracy, 32(1): 66-80. https://doi.org/10.1353/jod.2021.0001
[40] Amini, C., Douarin, E. (2020). Corruption and life satisfaction in transition: Is corruption a social norm in Eastern Europe? Social Indicators Research, 151: 723-766. https://doi.org/10.1007/s11205-020-02389-6
[41] Ahmed, H., Muzeyin, J.R., Ferejo, M.N., Amde, S.J. (2022). Evaluation of critical factors influencing framework agreement in public procurement: Evidence from administrative offices in Ethiopia. International Journal of Sustainable Development and Planning, 17(1): 83-90. https://doi.org/10.18280/ijsdp.170108
[42] Mungiu-Pippidi, A., Fazekas, M. (2020). Chapter 2: How to define and measure corruption. In A Research Agenda for Studies of Corruption. https://doi.org/10.4337/9781789905007.00008
[43] Charron, N., Lapuente, V., Annoni, P. (2019). Measuring quality of government in EU regions across space and time. Papers in Regional Science, 98(5): 1925-1954. https://doi.org/10.1111/pirs.12437
[44] Gutmann, J., Padovano, F., Voigt, S. (2020). Perception vs. experience: Explaining differences in corruption measures using microdata. European Journal of Political Economy, 65: 101925. https://doi.org/10.1016/j.ejpoleco.2020.101925
[45] Khamitov, Z., Knox, C., Junusbekova, G. (2023). Corruption, public procurement and political instability in Kazakhstan. Central Asian Survey, 42(1): 89-108. https://doi.org/10.1080/02634937.2022.2072811
[46] Carty, V., Reynoso Barron, F.G. (2019). Social movements and new technology: The dynamics of cyber activism in the digital age. In The Palgrave Handbook of Social Movements, Revolution, and Social Transformation. Springer, pp. 373-397. https://doi.org/10.1007/978-3-319-92354-3_16
[47] Maria, N.S., Susilowati, I., Fathoni, S., Mafruhah, I. (2021). The effect of education and macroeconomic variables on corruption index in G20 member countries. Economies, 9(10): 23. https://doi.org/10.3390/economies9010023
[48] Acemoglu, D., Robinson, J. (2012). Why Nations Fail: The Origins of Power, Prosperity and Poverty. New York: Crown.
[49] Al-Jundi, S.A., Shuhaiber, A., Al-Emara, S.S. (2019). The effect of culture and organisational culture on administrative corruption. International Journal of Economics and Business Research, 18(4): 436-451. https://doi.org/10.1504/IJEBR.2019.103096
[50] Benk, S., Yüzbaşı, B., McGee, R.W. (2017). Confidence in government and attitudes toward bribery: A country-cluster analysis of demographic and religiosity perspectives. Religions, 8(1): 8. https://doi.org/10.3390/rel8010008
[51] Martinangeli, A.F.M., Povitkina, M. Jagers, S., Rothstein B. (2024). Institutional quality causes generalized trust: Experimental evidence on trusting under the shadow of doubt. American Journal of Political Science, 68(3): 972-987. https://doi.org/10.1111/ajps.12780
[52] Saha, S., Sen, K. (2023). Do economic and political crises lead to corruption? The role of institutions. Economic Modelling, 124: 106307. https://doi.org/10.1016/j.econmod.2023.106307
[53] UNODC. (2015). International classification of crime for statistical purposes. https://www.unodc.org/documents/data-and-analysis/statistics/crime/ICCS/ICCS_English_2016_web.pdf.
[54] Kratcoski, P.C. (2018). Introduction: Overview of major types of fraud and corruption. In Fraud and Corruption. Springer, Cham, pp. 3-19. https://doi.org/10.1007/978-3-319-92333-8_1
[55] Zhllima, E., Imami, D., Rama, K., Shahini, A. (2018). Corruption in education during socialism and the postsocialist transition: The case of Albania. Region: Regional Studies of Russia, Eastern Europe, and Central Asia, 7(2): 51-70. https://doi.org/10.1353/reg.2018.0016
[56] Habibov, N., Afandi, E., Cheung, A. (2017). Sand or grease? Corruption-institutional trust nexus in post-Soviet countries. Journal of Eurasian Studies, 8(2): 172-184. https://doi.org/10.1016/j.euras.2017.05.001
[57] Soldatova, L.I., Skomoroshchenko, A.A., Zhurakhovskiy, A.S., Zakharova, A.V., Chernov, S. (2020). Economic and legal gaps in managing modern economic systems' innovative development. In The Economic and Legal Foundations of Managing Innovative Development in Modern Economic Systems. https://doi.org/10.1515/9783110643701-014
[58] Freire, D. (2012). Why nations fail, by Daron Acemoglu and James Robinson. Meridiano, 47(135): 43-45. https://doi.org/10.20889/7505
[59] Ibiricu, B., van der Made, M.L. (2020). Ethics by design: A code of ethics for the digital age. Records Management Journal, 30(3): 395-414. https://doi.org/10.1108/rmj-08-2019-0044