Osman Sejfijaj![]() | Ermira Shehu*
| Ermira Shehu*![]() | Alberta Tahiri
| Alberta Tahiri![]() | Bedri Millaku
| Bedri Millaku![]() | Idriz Kovaçi
| Idriz Kovaçi![]() | Afrim Selimaj
| Afrim Selimaj![]()
© 2025 The authors. This article is published by IIETA and is licensed under the CC BY 4.0 license (http://creativecommons.org/licenses/by/4.0/).
OPEN ACCESS
Trade openness is of great importance as it enables countries to establish export and import relations as two factors influencing economic growth. Thus, the purpose of this paper is to analyze the impact of export and import on the GDP of the Western Balkans countries. Such an analysis was done through linear regression performed in SPSS, using time series data obtained from the “World Development Indicators” database of the World Bank. It has resulted that for the analyzed period 2010-2021, at the significance level α=0.05, exports and imports have a positive impact on the growth of the GDP of the Western Balkan countries. So, exports and imports are seen as a source of economic growth of these countries. The impact of exports on GDP is lower than the impact of imports and this is explained by the fact that all the economies of this region are small, underdeveloped, have pronounced internal and external imbalances, face the problems of unemployment, poverty and inequalities, and that all these, and not only, make the WB countries less competitive in international markets. Dealing with many issues that are important for the integration of these countries is difficult because sustainable economic development is needed.
export, import, international trade, GDP, Western Balkan
We have all heard about globalization as a process of expanding and deepening relations between different countries [1], this process which is constantly growing and which is increasingly being given importance for its own role that has in the international trade between different countries and the creation of free trade zones which facilitate the procedures of export and import of goods and services. The initial wave of favourable arguments regarding trade can be traced back to the classical school of economic thought [2] since the time of Adam Smith and David Ricardo, who formulated the theory of absolute and comparative advantage [3] and which was then enriched by the work of Torrens, James Mill and John Stuart Mill in the first half of the 19th century [2]. The concepts of comparative advantage and gains from trade are two of the oldest and most discussed notions in the field of economics [4]. International trade theory aims to explain why countries develop their advantages in global markets [5]. The classical school of economics argues that trade stimulates economic growth through surplus exports [6] and the use of comparative advantage [7]. According to these theories, countries can benefit from trade by specializing in the production of those goods for which their resources are more suitable and by acquiring materials that they could not produce [8]. It is interesting to note that these theories do not take into account the negative factors for economic growth, such as differences in the behavior of prices between countries and the decrease in demand for primary products, which can lead to a deterioration in the country’s terms of trade [8]. Since then, the rationale for free trade and the various and indisputable benefits that international specialization brings to nations’ productivity have been widely discussed and well documented in the economic literature [2, 9, 10].
As seen in many countries, the main motive of governments is to achieve high and sustainable economic growth in order to prevail in a challenging world of trade relations [11, 12]. Exports and imports play an important role in economic growth in developed and developing countries [13]. The question of how developing countries can accelerate their economic growth is of crucial importance. Many of the rapidly growing newly industrialized countries lend support to the idea that export promotion can be an effective development strategy. Of course, such a line of causality is consistent with macroeconomic theory, where exports are treated as injections into the economy [14]. Thus, an important policy strategy for assessing growth and development in developing economies is to ascertain the economic relationship between economic growth and the trade sector for a given economy [15].
Thus, the purpose of this paper is to analyze the impact of export and import on the GDP of six (6) Western Balkan countries (WB or WB6). The Western Balkans is a political and geographical term [16, 17] that includes the countries of the Balkan Peninsula which are not yet members of the European Union (EU) [17, 18]. WB6 consists of: Kosovo, Albania, North Macedonia, Montenegro, Serbia and Bosnia and Herzegovina. The breakup of Yugoslavia and wars in the 1990s destroyed economic structures in the WB. These traumatic events disrupted the patterns of production and movement of goods, capital and labor that had been established over more than half a century while most of these countries had been part of a single state. After the beginning of the 2000s, the economies in the region recorded reduced economic growth and this growth slowdown caused reflections about how economic development could be further strengthened in the region, apart from the already existing instruments and processes led by the EU [19].
So, this paper analyses the impact of exports and imports on the GDP of WB6 using time series data for a period of 12 years, namely 2010-2021. The paper is divided into several sections. The first section summarizes a general introduction related to the problem being studied and briefly explains the content of the paper. The second section summarizes the theoretical treatment of the topic, as well as summarizing the results of a certain number of studies by different authors which have enabled us to make a comparability regarding what impact exports and imports have on GDP, or economic growth, of different countries in corresponding periods of time. Also, WB6 and the characteristics of these countries are also discussed here. The third section is the research methodology where some issues are clarified such as: the research method, the type of data used for the purpose of the research, analyses performed, research model and its specification and similar. The fourth section includes a comparative analysis related to the level of exports, imports and GDP of these countries and the analysis of linear trends for WB6 which was performed after calculating the average of all countries taken as a whole (region). The fifth section summarizes the results obtained from the linear regression analysis and the findings from the conducted study, and the sixth section deals with the conclusions drawn from this study.
Research question: What impact do exports and imports have on the GDP of the Western Balkan countries?
From the theories of international trade since the study of Ricardo [7], it has been argued that trade plays an important role in the national wealth of nations, namely in the formation of capital [20]. International trade can be considered as a potential driver of a country's economic growth [21] because it serves as a transmission belt for transferring the benefits of industrialization and modern technology from developed countries to less developed ones [22].
Since the main purpose of this paper is to explain the impact of export and import on GDP, it is important to mention the simple definition of export and import as the easiest way to start international business operations as well as GDP. Together, export and import represent the foundation of international trade. Exports mean domestically produced goods and services that are sold abroad, and imports mean foreign-produced goods and services that are sold domestically [23]. On the other hand, GDP is a measure of overall economic activity [24], representing the market value of all final goods and services produced within a country in a given period of time [23, 25].
Economic policies that lead to economic growth and development have been studied by many economists for a long time, and many economic models were built to understand economic growth and shed light on this issue [26]. Theoretically, it is well known that both exports and imports play a crucial role in economic development. Theoretical and empirical studies mainly focus either on the relationship between export and economic growth or between import and economic growth or on the relationship between export, import and economic growth [27]. There are different arguments about the relationship and the effect of export and import on economic growth and the relationship of these three variables varies from one country to another [28], that is, the results were specific to different countries and did not show a general consensus [20] since the arguments are controversial and based on these arguments, different hypotheses can be generated for the relationship of these three variables [28]. The main difference that the data showed is the model specification [20].
Numerous studies by different authors have been conducted in order to study the relationship between exports, imports and GDP [12-15, 20, 29-37]. All these authors and researchers, and not only, have analyzed either the impact of exports on economic growth or the impact of imports on economic growth or the impact of exports and imports on economic growth of the countries they included in the analysis. The relationship between exports, imports (also known as international trade) and economic growth has long been a well-known topic of interest to policy makers and academics. The reason for this is simple because the main goal of almost every nation is to increase GDP and improve the quality of life for their citizens [28, 36]. Economic growth is one of the most important determinants of economic well-being [13].
Wall [29] in his paper talks about economic growth and imports. He mentions that at the United Nations Conference on Trade and Development (UNCTAD) in 1964 it was said that the result of a less developed country’s efforts to accelerate the rate of economic growth depends on the rate of investment in fixed capital that country can achieve. On the assumption that most less developed countries are unable to produce most of the machinery and equipment required by the investment process, the success of an economic growth program depends on the import of these goods [29]. On the other hand, the research results of Doraisami [14] provide strong empirical support for a positive long-term relationship between exports and economic growth, relating that exports are the “engine of economic growth”. The role of exports as an “engine of economic growth” is an ongoing topic of debate in the economic growth literature [8]. The results obtained from the study of Doraisami [14], also, give support to the conclusions of Bahmani-Oskooee and Alse [30] that in less developed countries the increase in exports will contribute to economic growth and vice versa [30].
The results of Bouoiyour’s [31] study have shown that exports contribute to the industrialization and growth of the Morocco’s economy, while imports transform the Moroccan economy. These results are consistent with the positive relationship between exports, imports and GDP in the cointegration equation [31]. Kaushik and Klein [32] state that the results from their study are largely consistent with the literature of development economics, regarding the fact that export promotion policies promote economic growth by encouraging and making it possible for firms in the commercial sector to use efficiently their economic resources [32]. Fullerton et al. [33] have found that imports play a more critical role than exports for economic growth in Mexico, as well as the empirical findings of Mkubwa et al. [12] showed that trade openness had a positive and significant effect on economic growth in Tanzania. Andrews [15] analysis found that Liberia’s GDP growth is not driven by exports alone, but by a mix of exports and imports, with the latter having a long-term impact. Also, in Tanzania, imports are seen as a source of economic growth [34]. The results from Saaed and Hussain’s [34] analysis provide evidence that economic growth in Tunisia was driven by a growth-led import strategy as well as export-led import. Bakari and Mabrouki’s [35] study results provide evidence that exports and imports are seen as a source of economic growth in Turkey, and Hamdan [13] found that the effect of exports and imports was positive on economic growth in Arab countries during the period 1995-2013. Albiman and Suleiman [20] state that because Malaysia is an open economy, to ensure the effective use of domestic resources, new policy reforms are needed to ensure that at least two variables, import, export or domestic investment reinforce each other in order to promote economic growth in the long run [20]. Bakari [36] from the results of the research has provided evidence that exports and imports are seen as the source of economic growth in Canada. Panta et al. [37] investigated the relationship between exports, imports, capital and GDP in a small economy like Nepal, where it was found that exports have a minimal impact and imports make a large contribution to GDP [37].
As for the Balkans, it should be mentioned that the Balkans has always been one of the crossroads with a very high influence in broad political and economic positions [17, 38] and its reconstruction became one of the urgent issues for the international community after the wars of the 1990s. Indeed, the EU has tried to define a strategy for the integration of the Balkan region through the Stabilization-Association Process (SAP), launched in 2000, which represents a long-term commitment to the development of WB6 both in terms of political efforts and financial and human resources [39]. Economies in the Balkan region share some similarities [19]. Like other countries in transition, WB6 is characterized by structural changes and macroeconomic instability [17, 40], and all these countries have similar economic, political and social indicators [17, 41]. All WB6 economies are very small and still relatively underdeveloped, with average GDP per capita at PPS (Purchasing Power Standards) roughly one-third of the EU level. In addition, they have pronounced internal and external imbalance [19]. Completing the economic and institutional transition through structural reforms, reducing unemployment, poverty and inequalities, modernizing infrastructure, successful future integration in the EU, and other important issues are seen to be a real test for the region, having given current circumstances and global instabilities, including migration. Addressing all these issues at the same time is hardly possible without sustainable economic development [42]. Ultimately, SAP aims to prepare these countries for future EU membership [39]. The WB6 economic transition was characterized by the liberalization of trade and capital flows, which opened domestic markets to foreign competition, as well as by the elimination of trade barriers [43].
The EU supports the strengthening of regional economic integration that has been set as a priority by the leaders of the region in order to promote regional economic development [19]. The economic size of countries has a positive impact on international trade because a growing economy affects the growth of trade activities. Trade knows no political barriers, therefore only economic growth enables the elimination of political barriers and prejudices, opening opportunities for the development of trade at the international level [17]. Regional cooperation among the WB6 is a fundamental policy objective in all countries concerned, as it is considered a very important step on the way to European integration. The integration of these countries in the EU can be considered as the integration of a region as a whole [44]. In the framework of the so-called Berlin process, prime ministers from the WB6 have pledged to strengthen economic relationships and promote the free movement of goods, services, capital and qualified workers in the region [19].
The methodology of this research contains the qualitative and quantitative component that was designed based on:
·Tertiary sources (books, scientific works, Internet, etc.).
·Secondary data (taken from the World Development Indicators database).
Based on the research question presented in the introductory part, the hypotheses of this research are as follows:
H₀: Exports and imports have a negative impact on the GDP of the Western Balkan countries.
H₁: Exports and imports have a positive impact on the GDP of the Western Balkan countries.
Quantitative research methods have been applied to test these hypotheses. The impact of exports and imports on the GDP of WB6 was analyzed through linear regression performed through SPSS software. The secondary data were provided from the World Bank database, namely from the database: World Development Indicators (Data from database: World Development Indicators). The analysis includes a period of 12 years (2010-2021). In order to see the truth of the raised hypotheses, a research model has been built, which has the form:
Y=β₀+β₁X₁+β₂X₂+ε (1)
Table 1. Variables explanation of the research model
|
Symbol |
Abbreviation |
Variable |
Type of Variable |
|
Y |
GDP |
Gross Domestic Product |
Dependent |
|
X₁ |
EXP |
Exports |
Independent |
|
X₂ |
IMP |
Imports |
Independent |
Table 2. Meaning of model coefficients
|
Symbol |
Meaning |
|
β₀ |
Constant coefficient indicating what the value of Y will be when X=0 |
|
β₁ |
Coefficient indicating what the value of Y will be when X₁ changes by 1 unit, keeping X₂ constant |
|
β₂ |
Coefficient indicating what the value of Y will be when X₂ changes by 1 unit, keeping X₁ constant |
|
ε |
The error term, summarizes all other factors that may have an influence on the given phenomenon, but which are not taken into account in the model |
After the research model’s variables explanation in Table 1 and giving the meaning of model coefficients in Table 2, the research model takes the following form:
GDP=β₀+β₁ EXP+β₂ IMP+ε (2)
This section summarizes a comparative analysis in terms of percentage (%) of annual GDP growth, exports and imports of WB6. Through the graphic representations, it can be seen clearly the changes in the level of these three variables in the countries included in the analysis for the period 2010-2021, so a comparability is made of which country has recorded the highest or lowest level of GDP, exports and imports during the analysed period.
Also, linear trend analysis is included here. In order to perform the analysis of linear trends, we calculated the average per cent of GDP, exports and imports for each year for the six countries taken as a whole. The data obtained after calculating the average of the six countries have served to generate the analysis of linear trends for the variables included in the research model, namely the linear trend between GDP and exports, as well as the linear trend between GDP and imports.
Figure 1 presents the data on GDP growth of the WB6 for the period 2010-2021, from which we note that in most of the years Kosovo leads with the highest percentage of GDP growth in the Balkans. An exception is made in 2014 during which North Macedonia recorded the highest level of GDP, and in 2018 when Montenegro led with an increase in GDP. In 2020, all the countries of the Western Balkans had negative GDP growth, where we mention that during this year Serbia had the best position as it recorded the lowest decline compared to other countries, thus it had a level of -0.94% of GDP while the other five states had a decline at a higher level, e.g., Montenegro recorded the highest decline of -15.31% in the GDP level. The recessionary decline in GDP is the result of several factors, including the significant deterioration of domestic and foreign demand for goods and services, the collapse of tourism in the region (due to lockdown measures in and outside the region), the possible reduction in incoming remittance flows to some households and the decline in the levels of domestic and foreign private direct investments [45]. As for the year 2021, we see that the highest increase in the level of GDP was experienced by Montenegro (12.43%), followed by Kosovo (9.13%), Albania (8.54%), Serbia (7.39%), Bosnia and Herzegovina (7.10%) and North Macedonia (3.96%). According to the “Western Balkans Regular Economic Report, No. 20” of the World Bank, in 2021, WB saw an accelerated recovery from the recession caused by the COVID-19 crisis that the six economies experienced in 2020. The recovery developed at a faster pace than expected, as a result of strength in domestic and external demand, but this recovery is also fragile [46].
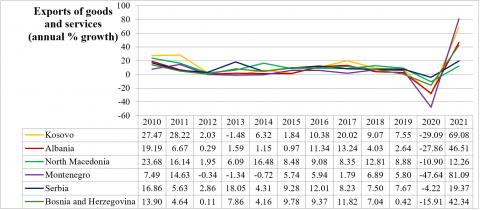
Figure 2 shows the data on the percentage of export growth of the WB6 during the years 2010-2021. We note that during 2010 and 2011, Kosovo has the highest increase in exports compared to the other five countries, in 2012 it is Serbia that leads the percentage of exports growth, but during this year there is a noticeable decrease in the level of exports of all countries compared with previous years. In 2013, Serbia continues to increase the level of exports (from 2.86% in 2012 to 18.05% in 2013), in 2014 North Macedonia led this increase, in 2015 Bosnia and Herzegovina has the only case when it marks the highest level of increase in the percentage of exports during the analysed period compared to other countries. The year 2016 continues with Serbia, which again leads in terms of export growth, the year 2017 puts Kosovo in first place, and in 2018 and 2019 North Macedonia records the highest growth. As in the case of the percentage of GDP growth, in this case too, during 2020 all countries recorded a decrease in the exports level. Again, the lowest decrease was experienced by Serbia (-4.22%) compared to other countries which recorded a double-digit decrease. The last year included in the analysis, 2021, in terms of exports favours Montenegro (with an increase of 81.09%, followed by Kosovo (69.08%), Albania (46.51%), Bosnia and Herzegovina (42.34%), Serbia (19.37%) and North Macedonia (12.26%). The WB's recovery during 2021 was supported by a sharp combination of domestic reopening, allowing for a recovery in consumption and tourism arrivals, as well as favourable external conditions for the region's exports. A strong recovery in advanced economies, driven by rapid vaccination and aided by fiscal stimulus, also provided a welcome boost to the region’s export demand [46].
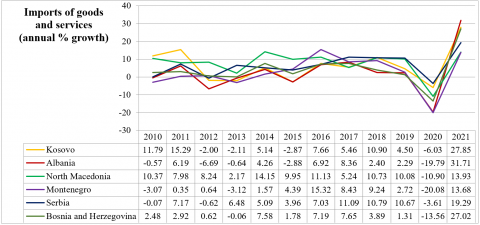
Figure 3 presents data on the percentage increase in imports of WB6 during the period 2010-2021. It can be seen that during 2010 and 2011 Kosovo had the highest increase in imports, in 2012 North Macedonia was the country with the highest level of imports in the Balkans, in 2013 Serbia had the highest level of imports, then again during the years 2014 and 2015, North Macedonia recorded the highest level of imports, although in 2015 there was a decrease in this level compared to 2014. In 2016, Montenegro moved to the first place in terms of the imports growth, to continue with Serbia in 2017, while in 2018 there were small differences between Kosovo, Serbia and North Macedonia, but during this year Kosovo had the highest level of imports growth by 10.90%, followed by Serbia with 10.79% and North Macedonia by 10.73%. In 2019, Serbia continued with the highest level of imports and in 2020, as in the case of GDP and exports, all countries had a decrease in imports. Again, Serbia was the country that recorded the lowest decrease (-3.61%), while Montenegro had the highest decrease in imports (-20.08%). And for 2021, a significant increase in the level of imports from all countries is seen compared to a year earlier. During this year, Albania recorded the highest level of imports (31.71%), followed by Kosovo (27.85%), Bosnia and Herzegovina (27.02%), Serbia (19.29%), North Macedonia (13.93%) and Montenegro (13.68%).
This section continues with data analysis through linear trends. As we mentioned above, here is presented the linear trend between GDP and exports, as well as between GDP and imports.
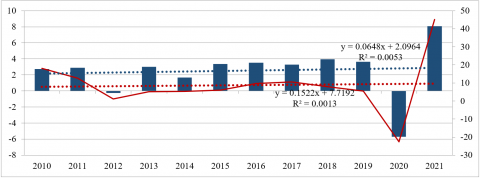
Based on the data presented in Figure 4, we say that WB6 for the analyzed period (2010-2021) had a variability of the GDP level from year to year. Year after year there is an increase and decrease of this level, which in general these variations have reflected in a linear trend with a symbolic increase, so it can be seen that this trend is almost in a straight line with the horizontal axis. The decline of GDP to negative levels is seen in 2012 and 2020. Also, the linear trend for the export variable has a rather low, almost invisible growth. A marked decrease in the average of WB6 exports is observed in 2020, when it is known that the situation created by the coronavirus pandemic was the cause. Based on the figure above, we can say that there is a positive relationship between GDP and exports, since with the increase in exports, the GDP is also increasing, although at low levels, but still there is growth. According to the "Western Balkans Regular Economic Report, No. 21” of the World Bank, the WB6 saw a strong return to economic growth in 2021 with a broad-based recovery in economic activity. In 2021, GDP growth in WB6 reached 7.4% after a contraction of 3.2% in 2020 [47]. Also, higher commodity prices and a generally favourable external environment supported export growth in all BP countries [47].
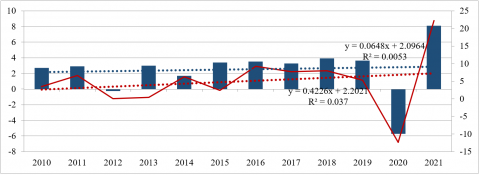
Figure 5 presents the linear trend between the GDP variable and the imports variable. As we can see, there is a positive relationship between GDP and imports because an increase in imports has an impact on GDP growth. The most obvious decrease in imports level of WB6 was recorded in 2020, when the main cause of this decrease was the COVID-19 crisis, which brought severe damage to all economies of WB in 2020, when economic activity was severely disrupted by lockdown measures [48]. Unlike exports, the linear trend for imports has a more pronounced growth tendency, as can be seen in the figure. The increase in imports, driven by a strong recovery in consumption and high energy, material and food prices, overshadowed in some cases the recovery in gross exports [47].
Across the region, real GDP growth was driven by service sectors. Retail trade expanded strongly in all countries, reflecting the strong recovery in private consumption. Sharp growth in tourism and transport [47] as a result of falling infection rates led countries across the region to loosen domestic and cross-border mobility restrictions during the late spring and summer. This saw a sharp rebound in domestic consumption and travel across Europe, increasing remittances as well as tourism inflows during the peak summer season [46]. The growth of tourism and transport also fuelled the growth of services in WB, especially in Albania, Kosovo and Montenegro. ICT services further contributed to growth in North Macedonia [47].
This section presents the results obtained from the linear regression analysis through which the impact of export and import on the GDP of WB countries was seen. Within the results of the linear regression analysis, descriptive statistics, bivariate correlation analysis, model summary, ANOVA, coefficient table and collinearity diagnostics table are presented. The results obtained are supported by the interpretations and justifications given in order to be as clear as possible.
From the result obtained in Table 3, we see that for the variables included in the model, namely for GDP, EXP and IMP, the number of observations is 72, based on the fact that the analysis includes data for six (6) Western Balkan states for a period of 12 years (2010-2021). According to the given result, we say that the % of GDP growth moves from a minimum value of -15.31% to a maximum value of 12.43%, with an average of 2.52% and a standard deviation of 3.66%. For the EXP variable, the minimum value of the % of exports growth during the analyzed period was found to be -47.64%, the maximum value 81.09%, and the average 8.71% with a standard deviation of 17.37%. Similarly, the minimum value of the % of imports growth is -20.08%, the maximum value is 31.71%, the mean is 4.95% and the standard deviation is 8.89%.
Table 3. Descriptive statistics
|
Descriptive Statistics |
|||||
|
|
N |
Minimum |
Maximum |
Mean |
Std. Deviation |
|
Y GDP |
72 |
-15.31 |
12.43 |
2.5194 |
3.66238 |
|
X1 EXP |
72 |
-47.64 |
81.09 |
8.7067 |
17.36928 |
|
X2 IMP |
72 |
-20.08 |
31.71 |
4.9496 |
8.89845 |
|
Valid N (listwise) |
72 |
|
|
|
|
Source: Authors’ calculations in SPSS software (2024)
Table 4 shows the result of the bivariate correlation analysis. We know that through this analysis we are able to test the strength of the relationship or interconnection between the variables that are included in the research model. Thus, we say that:
·There is a high positive correlation between GDP and EXP, at a value of 0.817, and this statement is correct because the significance value was found to be 0.000 (p value = 0.000 < 0.05).
·There is a high positive correlation at a value of 0.735 between GDP and IMP. This statement is correct because it is proven through the resulting value of significance that is 0.000 (p value = 0.000 < 0.05).
·Also, there is a high and positive correlation at a value of 0.783 between the two independent variables, EXP and IMP, and this statement is also correct because the significance value is again 0.000 (p value = 0.000 < 0.05).
All the above statements are also true for the level of significance α = 0.01, since the p value in all three cases is equal to 0.000. So the above statements are valid for α = 5% and for α = 1%.
Table 4. Bivariate correlations analysis
|
Correlationsb |
||||
|
|
YGDP |
X1EXP |
X2IMP |
|
|
Y GDP |
Pearson Correlation |
1 |
.817** |
.735** |
|
Sig. (2-tailed) |
|
.000 |
.000 |
|
|
X1 EXP |
Pearson Correlation |
.817** |
1 |
.783** |
|
Sig. (2-tailed) |
.000 |
|
.000 |
|
|
X2 IMP |
Pearson Correlation |
.735** |
.783** |
1 |
|
Sig. (2-tailed) |
.000 |
.000 |
|
|
|
**. Correlation is significant at the 0.01 level (2-tailed). |
||||
|
b. Listwise N=72 |
||||
Source: Authors’ calculations in SPSS software (2024)
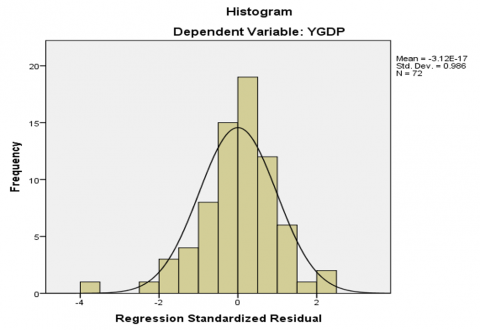
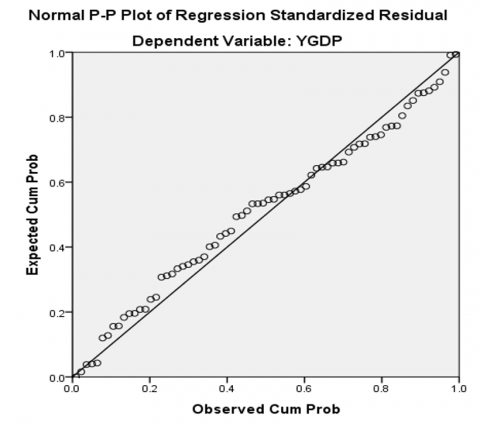
Based on Figure 6, respectively on the graphical presentation of the data distribution through the histogram, we see that for the dependent variable (GDP) and for the two independent variables (EXP and IMP) there is a normal distribution. The same can be seen from the probability graph, where there is a positive linear relationship between the variables, since the points are distributed close to the regression line, with the exception of the specific points that show standard deviation, and that the latter are summarized in the stochastic variable or the error term (ε).
(a) Histogram
(b) Probability graph
Figure 6. Graphic presentation of data distribution
Source: Authors’ calculations in SPSS software (2024)
Table 5 presents some valuable results for the research, namely, among others, from here we get the value of the correlation coefficient (R), the determination coefficient (R²), the Durbin-Watson coefficient and the significance value of the model. According to the results, we say that R has a value of 0.831, which means that the variables included in the model have a correlation of 83.1%, and R² has a value of 0.691, which means that the independent variables (EXP and IMP) explain the variable dependent (GDP) at a level of 69.1%. The remaining percentage (30.9%) belongs to the stochastic variable or the error term (ε) which includes all other factors that have an impact on the economic growth of WB countries, but which are not taken into account in the model. It is widely accepted among economists that economic growth is an extremely complex process, which depends on many variables such as capital accumulation (both physical and human) [2, 27], trade, fluctuations in prices, political conditions, income distribution [2], entrepreneurship, innovation [27], investment, savings, inflation, inflation variability, government spending as a percentage of GDP, government deficit [26], geographic characteristics [2] and other mainly macroeconomic variables [26].
Table 5. Model summary
|
Model Summaryb |
||||||||||
|
Model |
R |
R Square |
Adjusted R Square |
Std. Error of the Estimate |
Change Statistics |
Durbin-Watson |
||||
|
R Square Change |
F Change |
df1 |
df2 |
Sig. F Change |
||||||
|
1 |
.831a |
.691 |
.682 |
2.06382 |
.691 |
77.292 |
2 |
69 |
.000 |
1.769 |
|
a. Predictors: (Constant), X2 IMP, X1 EXP |
||||||||||
|
b. Dependent Variable: Y GDP |
||||||||||
Source: Authors’ calculations in SPSS software (2024)
The Durbin-Watson coefficient value was found to be 1.769, which is within the preferred range of 1.5 - 2.5. The value of the Durbin-Watson coefficient is an indicator for the autocorrelation between independent variables and in our case, it was found that there is no autocorrelation or interdependence between these variables, which made the research model even more reliable. We will prove such a thing below too through the resulting values of “Colinearity Statistics” (Table 6), as well as from the results of the table for collinearity diagnostics (Table 7).
From the above table we see that the research model is statistically reliable and acceptable based on the significance value that resulted (Sig. F Change = 0.000). Also, the same thing is confirmed by the significance value given in the ANOVA Table (Table 8), where it was found that Sig. = 0.000. So, in short, this research model is statistically reliable for significance level α = 5%, as well as for α = 1%.
Since we saw the significance of the model as a whole, we will now see the significance of each coefficient included in our research model in particular. Such results are presented in Table 6.
Table 6. Coefficients of the research model
|
Coefficientsa |
||||||||||
|
Model |
Unstandardized Coefficients |
Standardized Coefficients |
t |
Sig. |
95.0% Confidence Interval for B |
Collinearity Statistics |
||||
|
B |
Std. Error |
Beta |
Lower Bound |
Upper Bound |
Tolerance |
VIF |
||||
|
1 |
(Constant) |
.871 |
.280 |
|
3.110 |
.003 |
.312 |
1.429 |
|
|
|
X1EXP |
.131 |
.023 |
.623 |
5.803 |
.000 |
.086 |
.177 |
.388 |
2.579 |
|
|
X2IMP |
.102 |
.044 |
.248 |
2.306 |
.024 |
.014 |
.190 |
.388 |
2.579 |
|
|
a. Dependent Variable: YGDP |
||||||||||
Source: Authors’ calculations in SPSS software (2024)
Table 7. Collinearity diagnostics
|
Collinearity Diagnosticsa |
||||||
|
Model |
Dimension |
Eigenvalue |
Condition Index |
Variance Proportions |
||
|
(Constant) |
X1EXP |
X2IMP |
||||
|
1 |
1 |
2.198 |
1.000 |
.08 |
.05 |
.05 |
|
2 |
.633 |
1.864 |
.91 |
.07 |
.04 |
|
|
3 |
.169 |
3.606 |
.01 |
.88 |
.90 |
|
|
a. Dependent Variable: YGDP |
||||||
Source: Authors’ calculations in SPSS software (2024)
Table 8. ANOVA
|
ANOVAa |
||||||
|
Model |
Sum of Squares |
df |
Mean Square |
F |
Sig. |
|
|
1 |
Regression |
658.428 |
2 |
329.214 |
77.292 |
.000b |
|
Residual |
293.895 |
69 |
4.259 |
|
|
|
|
Total |
952.322 |
71 |
|
|
|
|
|
a. Dependent Variable: Y GDP |
||||||
|
b. Predictors: (Constant), X2 IMP, X1 EXP |
||||||
Source: Authors’ calculations in SPSS software (2024)
The meaning of the values of the model coefficients is as follows:
β₀ - indicates that if EXP and IMP are constant (do not change) then GDP will have a value of 0.871%. Such a statement is correct because it is verified through the significance value of the coefficient 0.003 (so, p value = 0.003 < 0.05).
β₁ - indicates that if EXP increases by 1%, GDP will increase by 0.131%, keeping IMP constant. This statement is correct since the significance value of this coefficient turned out to be 0.000 (p value = 0.000 < 0.05). This means that for the analyzed period (2010-2021), the impact of exports on the economic growth of WB6 has been positive, so the increase in the % of exports has led to an increase in the % of GDP of these countries.
β₂ - indicates that if IMP increases by 1% then GDP will increase by 0.102%, keeping EXP constant. The significance level of 0.024 shows that this statement is acceptable (so, p value = 0.024 < 0.05) and even in this case we say that for the analysed period (2010-2021) the economic growth of the WB6 was also influenced by the % of imports growth.
Based on the results, finally, we say that H1 is confirmed, which stated that “Exports and imports have a positive impact on the GDP of the Western Balkan countries”. So, exports and imports are seen as important factors in the economic growth of these countries. It is worth noting that the analysis of Pere and Ninka [44] shows that the countries bordering the region (Slovenia, Hungary, Bulgaria, Romania and Greece) and the EU member countries have a positive impact on exports and in terms of imports WB6 are still positively dependent on the economies of countries bordering the region [44]. Exports of goods and services represent one of the most important sources of foreign exchange earnings that relieve pressure on the balance of payments and create employment opportunities [13]. On the other hand, imports help stimulate economic growth through several different channels. They are a source of technology and new ideas transfer, promote innovation among domestic firms through import competition, provide factors of production that are used in both domestic and export manufacturing sectors. Given the latter, it is not surprising that an expansion of imports can often trigger an expansion of exports [49].
From the table of coefficients, we also interpret the meaning of the values presented in the Collinearity Statistics column, namely the values of the Tolerance and VIF (Variance Inflation Factor) coefficients. These coefficients prove if there is multicollinearity in the research model and to come to the conclusion that there is no multicollinearity in the model, the resulting values of the Tolerance coefficient should be higher than 0.2 and the values of the VIF coefficient should be lower than 5. In our case it is proven that there is no multicollinearity because Tolerance = 0.388 and VIF = 2.579 for both independent variables (EXP and IMP).
Also, another indicator of multicollinearity is the Condition Index in Table 7. According to the result of this coefficient, multicollinearity exists when any of the Variance Proportions has values higher than 0.9, corresponding to any row in which the Condition Index has a value higher than higher than 30 [46].
According to the result, it has emerged that in all cases the Condition Index values are lower than 30, which means that once again the non-presence of multicollinearity in the research model is proven. The reason why importance is given to the aspect of multicollinearity is because in cases where multicollinearity exists in the model then it is likely that the regression coefficients are meaningless and such a thing entails the need for the independent variables which are highly correlated to be removed from model in order to increase its statistical significance.
From the above treatment of the issues this study deals with, we can conclude that the process of globalization has increased the importance of creating cooperative relations between countries around the globe. Such a situation led to an increase in the quality of life of the population as people have before them many and different opportunities to meet their needs and demands for certain goods and services. So, they feel fulfilled either by consuming local products and services or imported ones, when their country does not have the opportunity to offer them something for specific reasons.
As for the Western Balkan region, we emphasize that the six countries included in its territory, namely Kosovo, Albania, Macedonia, Montenegro, Serbia and Bosnia and Herzegovina, are still characterized by an internal and external imbalance, low economic development, fragile economic growth, political instability, problems with unemployment, poverty and inequality, as well as by a situation which makes WB countries less competitive in international markets compared to world rivals.
Regarding the purpose of the paper, which was to analyse the impact of export and import on the GDP of WB6, it turned out that for the analysed period (2010-2021) exports and imports have a positive impact on the GDP of WB6, so they are seen as source of economic growth of these countries. In general, the level of imports is higher than the level of exports and also imports have a higher impact on the economic growth of WB6. In order to promote higher economic growth, as well as sustainable economic development, it remains for these states to meet and fulfil the requirements of the European community to ensure further integration into the political and economic processes within the EU.
[1] Daniels, J.D., Radenbaugh, L.H., Sullivan, D.P. (2019). International Business: Environments & Operations. UK: Pearson Education Limited.
[2] Medina-Smith, E.J. (2001). Is the export-led growth hypothesis valid for developing countries? A case study of Costa Rica. United Nations Conference on Trade and Development. Policy Issues in International Trade and Commodities, Study Series No. 7, New York and Geneva. https://cir.nii.ac.jp/crid/1130282271902140800.
[3] Bano, S., Paswan, N.K. (2016). New Zealand - India trade relations and growth potential: An empirical analysis. India Quarterly, 72(1): 50-74. https://www.jstor.org/stable/48505482.
[4] Gerber, J. (2018). International Economics. England: Pearson Education Limited.
[5] Kristo, I. (2004). International Business. Tiranë: PEGI.
[6] Smith, A. (1776, reprinted 1821). An Inquiry into the Nature and Causes of the Wealth of Nations (5th Ed.), London: Methuen and Co., Ltd.
[7] Chipman, J. (1965). A survey of the theory of international trade: Part 1, the classical theory. Econometrica, 33(3): 477-519. https://doi.org/10.2307/1911748
[8] Kalaitzi, A.S., Cleeve, E. (2018). Export-led growth in the UAE: Multivariate causality between primary exports, manufactured exports and economic growth. Eurasian Business Review, 8(3): 341-365. https://doi.org/10.1007/s40821-017-0089-1
[9] Bhagwati, J. (1978). Anatomy and Consequences of Exchange Control Regimes: Liberalization Attempts and Consequences. Cambridge, MA: Ballinger.
[10] Krueger, A.O. (1978). Foreign Trade Regimes and Economic Development: Liberalization Attempts and Consequences. Cambridge, MA: Ballinger.
[11] Manni, U.H., Ibne Afzal, M.N. (2012). Effect of trade liberalization on economic growth of developing countries: A case of bangladesh economy. Journal of Business, Economics & Finance, 1(2): 37-44. https://dergipark.org.tr/en/pub/jbef/issue/32420/360521.
[12] Mkubwa, H.M., Mtengwa, B.A., Babiker, S.A. (2014). The impact of trade liberalization on economic growth in Tanzania. International Journal of Academic Research in Business and Social Sciences, 4(5): 514-532. https://doi.org/10.6007/ijarbss/v4-i5/879
[13] Hamdan, B.S.S. (2016). The effect of exports and imports on economic growth in the arab countries: A panel data approach. Journal of Economics Bibliography, 3(1): 100-107. http://doi.org/10.1453/jeb.v3i1.600
[14] Doraisami, A. (1996). Export growth and economic growth: A reexamination of some time-series evidence of the malaysian experience. The Journal of Developing Areas, 30(2): 223-230. http://www.jstor.org/stable/4192541.
[15] Andrews, A.P. (2015). Exports, imports, and economic growth in Liberia: Evidence from causality and cointegration analysis. Journal of Management Policy and Practice, 16(3): 95-109. https://pdfs.semanticscholar.org/e423/9bd636c076456ad01410b900f082a79bc646.pdf.
[16] Jusufi, G., Ukaj, F., Ajdarpašić, S. (2020). The effect of product innovation on the export performance of Kosovo SMEs. Management: Journal of Contemporary Management Issues, 25(2): 215-234. https://doi.org/10.30924/mjcmi.25.2.12
[17] Jusufi, G., Ukaj, F. (2021). Turkey’s trade with Western Balkans: Looking beyond the turkish foreign policy. InterEULawEast: Journal for the International and European Law, Economics and Market Integrations, 8(2): 133- 160. https://doi.org/10.22598/iele.2021.8.2.7
[18] Jusufi, G., Ukaj, M. (2020). Migration and economic development in Western Balkan countries: Evidence from Kosovo. Poslovna Izvrsnost/Business Excellence, 14(1): 135-158. https://doi.org/10.22598/pi-be/2020.14.1.135
[19] Kaloyanchev, P., Kusen, I., Mouzakitis, A. (2018). Untapped potential: Intra-regional trade in the Western Balkans. European Economy, Discussion Paper 080, European Commission Directorate-General for Economic and Financial Affairs. Luxembourg: Publications Office of the European Union. https://ec.europa.eu/info/sites/default/files/economy-finance/dp080_western_balkans.pdf.
[20] Albiman, M., Suleiman, N.N. (2016). The relationship among export, import, capital formation and economic growth in Malaysia. Journal of Global Economics, 4(2): 2375-4389. https://doi.org/10.4172/2375-4389.1000186
[21] Bastola, U., Sapkota, P. (2015). Causality between trade and economic growth in a least developed economy: Evidence from Nepal. The Journal of Developing Areas, 49(4): 197-213. http://www.jstor.org/stable/24737371.
[22] Naveed, A., Shabbir, G. (2006). Trade openness, FDI and economic growth: A panel study. Pakistan Economic and Social Review, 44(1): 137-154. http://www.jstor.org/stable/25825288.
[23] Mankiw, N.G. (2018). Principles of Macroeconomics (8th Ed.). USA: Cengage Learning.
[24] Williamson, S.D. (2018). Macroeconomics (6th Ed., Global Edition). Harlow, UK: Pearson Education Limited.
[25] Froyen, R.T. (2013). Macroeconomics: Theories and policies. England: Pearson Education Limited.
[26] Zestos, G.K., Tao, X. (2002). Trade and GDP growth: Causal relations in the United States and Canada. Southern Economic Journal, 68(4): 859-874. https://doi.org/10.2307/1061496
[27] Varshini, N.M., Manonmani, M. (2018). Causal relationship between trade & economic growth in India during post WTO period. Indian Journal of Industrial Relations, 54(1): 54-65. https://www.jstor.org/stable/26536512.
[28] Turan, G., Karamanaj, B. (2014). An empirical study on import, export and economic growth in Albania. Academic Journal of Interdisciplinary Studies, 3(3): 428-438. https://www.richtmann.org/journal/index.php/ajis/article/view/3442.
[29] Wall, D. (1968). Import capacity, imports and economic growth. Economica, 35(138): 157-168. https://doi.org/10.2307/2552129
[30] Bahmani-Oskooee, M., Alse, J. (1993). Export growth and economic growth: An application of cointegration and error-correction modeling. The Journal of Developing Areas, 27(4): 535-542. http://www.jstor.org/stable/4192260.
[31] Bouoiyour, J. (2003). Trade and GDP growth in morocco: Short-run or long-run causality? Brazilian Journal of Business and Economics, 3(2): 14-21. https://mpra.ub.uni-muenchen.de/28859/
[32] Kaushik, K.K., Klein, K.K. (2008). Export growth, export instability, investment and economic growth in India: A time series analysis. The Journal of Developing Areas, 41(2): 155-170. http://www.jstor.org/stable/40376182.
[33] Fullerton Jr, T.M., Kababie, K., Boehmer, C.R. (2012). International trade and economic growth in Mexico. Empirical Economics Letters, 11(9): 869-876. https://mpra.ub.uni-muenchen.de/42991/.
[34] Saaed, A.A.J., Hussain, M.A. (2015). Impact of exports and imports on economic growth: Evidence from Tunisia. Journal of Emerging Trends in Economics and Management Sciences, 6(1): 13. https://hdl.handle.net/10520/EJC179819.
[35] Bakari, S., Mabrouki, M. (2016). The relationship among exports, imports and economic growth in Turkey. MPRA Paper, No. 76044. https://mpra.ub.uni-muenchen.de/76044/.
[36] Bakari, S. (2018). Impact of exports and imports on economic growth in canada: Empirical analysis based on causality. International Academic Journal of Innovative Research, 5(1): 17-29. https://doi.org/10.9756/IAJIR/V5I1/1810003
[37] Panta, H., Devkota, M.L., Banjade, D. (2022). Exports and imports-led growth: Evidence from a small developing economy. Journal of Risk and Financial Management, 15(1): 11-24. https://doi.org/10.3390/jrfm15010011
[38] Sela, Y., Maksuti, B. (2015). The social, political and economic changes in the Western Balkans: Managing diversity. SEEU Review, 11(2): 109-128. https://doi.org/10.1515/seeur-2015-0032
[39] Montanari, M. (2005). EU trade with the balkans: Large room for growth? Eastern European Economics, 43(1): 59-81. http://doi.org/10.1080/00128775.2005.11041096
[40] Kastrati, A., Pugh, G., Toçi, V. (2017). Output gap in transition economies using unobserved component method: The case of Czech Republic, Estonia and Kosovo. Ekonomska Misao i Praksa/Economic Thought and Practice, 26(2): 477-500. https://hrcak.srce.hr/file/282065.
[41] Jusufi, G., Lubeniqi, G. (2019). An overview of doing business in Western Balkan: The analysis of advantages of doing business in kosovo and north macedonia. ILIRIA International Review, 9(2): 168. https://www.ceeol.com/search/article-detail?id=854000.
[42] Berthomieu, C., Cingolani, M., Ri, A. (2016). Investment for growth and development in the Western Balkans. STAREBEI Research Project, EIB Institute, University of Nice - Sophia Antipolis, France. https://institute.eib.org/wp-content/uploads/2019/02/STAREBEI-Sophiaall.pdf.
[43] Jusufi, G., Bellaqa, B. (2019). Trade barriers and exports between Western Balkan countries. Naše Gospodarstvo/Our Economy, 65(4): 72-80. https://doi.org/10.2478/ngoe-2019-0021
[44] Pere, E., Ninka, E. (2017). International trade in Western Balkan countries: Analysis based on the gravity model. The WIIW Balkan Observatory, Working Paper No. 126. https://wiiw.ac.at/international-trade-in-western-balkan-countries-analysis-based-on-the-gravity-model-p-4632.html.
[45] Omic, E., Handeland, C. (2021). Social infrastructure in the Western Balkans: Increasing the region’s economic resilience, enhancing human capital and counteracting the effects of brain drain. Research Papers Series, Council of Europe Development Bank, Paris, France. https://coebank.org/media/documents/Social_Infrastructure_in_the_Western_Balkans.pdf.
[46] World Bank (2021). Western Balkans regular economic report, No. 20, Fall 2021: Greening the Recovery. Washington, DC. http://hdl.handle.net/10986/36402.
[47] World Bank (2022). Western Balkans regular economic report, No. 21, Spring 2022: Steering Through Crises. Washington, DC. http://hdl.handle.net/10986/37368.
[48] European Union (2021). EU Candidate Countries’ & Potential Candidates’ Economic Quarterly (CCEQ). 1st Quarter 2021, European Economy Technical Paper 048. Luxembourg: Publications Office of the European Union. https://ec.europa.eu/info/publications/economic-and-financial-affairs-publications_en.
[49] Coe, D.T., Helpman, E. (1993). International R&D Spillovers. NBER Working Paper No. w4444. https://ssrn.com/abstract=227321.