Nicco Plamonia*![]() | Riardi Pratista Dewa
| Riardi Pratista Dewa![]() | Merri Jayanti
| Merri Jayanti![]() | Agung Riyadi
| Agung Riyadi![]() | Budi Rahayu
| Budi Rahayu![]() | Diyono
| Diyono![]() | Firman Laili Sahwan
| Firman Laili Sahwan![]() | Handy Chandra
| Handy Chandra![]() | Insan Nur Sulistiawan
| Insan Nur Sulistiawan![]() | Nana Sudiana
| Nana Sudiana![]() | Nur Hidayat
| Nur Hidayat![]() | Prasetiyadi
| Prasetiyadi![]() | Regina Dea Tilottama
| Regina Dea Tilottama![]() | Rony Irawanto
| Rony Irawanto![]() | Sri Wahyono
| Sri Wahyono![]() | Suprapto
| Suprapto![]() | Atie Tri Juniati
| Atie Tri Juniati![]() | I Nyoman Teguh Prasidha
| I Nyoman Teguh Prasidha![]()
© 2025 The authors. This article is published by IIETA and is licensed under the CC BY 4.0 license (http://creativecommons.org/licenses/by/4.0/).
OPEN ACCESS
Indonesia's relocation of its capital to IKN Nusantara presents significant challenges in establishing a sustainable and cost-effective water supply system. This study investigates the impact of hydraulic escalation, characterized by significant elevation differences, on production costs and economic feasibility in the new capital. Utilizing data from existing water utilities in Danum Taka and Tirta Mahakam, the research conducts a comprehensive analysis, including hydraulic gradient calculations, pressure requirements, and cost assessments. Key findings show that the elevation difference demands substantial energy for continuous pumping, increasing production costs by IDR 478.05 per cubic meter. The estimated production cost for IKN is IDR 3,313.5 per cubic meter. The projected base tariff is IDR 1,938 per cubic meter, with an average tariff of IDR 4,827 per cubic meter, yielding a positive margin of IDR 3,943.4 per cubic meter. To cover increased costs, the study recommends a tariff increase of 35%, raising the rate to IDR 6,516 per cubic meter. These results emphasize the need for optimized hydraulic design, energy-efficient practices, and strategic financial planning to ensure the sustainability and affordability of the water supply in IKN Nusantara. The study provides critical insights for policymakers and stakeholders, supporting the development of resilient water infrastructure and informing strategic planning for water supply management in the new capital.
IKN nusantara, hydraulic escalation, production costs, water tariffs, sustainable water management
Indonesia's decision to relocate its capital from Jakarta to IKN Nusantara is a monumental undertaking aimed at addressing urban challenges, including congestion, environmental degradation, and socio-economic disparities. The new administrative region spans five sub-districts from Kutai Kertanegara Regency and one sub-district from Penajam Paser Utara Regency, covering approximately 256,142 hectares of land and 68,189 hectares of marine area. This ambitious initiative is not merely an infrastructure project but a blueprint for sustainable urban development in the Global South solutions [1, 2]. Among the critical concerns, ensuring an adequate and affordable drinking water supply stands out as a key challenge, particularly in light of the region’s hydraulic complexities and topographical constraints [1, 3-5].
Previous studies have highlighted the challenges in integrating water supply systems in new urban developments. Elevation differences and associated hydraulic pressures [6], then significantly impact operational costs. Strategic planning in managing raw water sources is vital to optimizing production costs and ensuring a sustainable water supply system. These studies emphasize the need to consider both hydraulic and economic factors in water supply infrastructure planning.
International experiences also provide valuable insights. For example, the case of Brasilia, shows that how selecting water sources and efficiently managing water distribution can mitigate costs and improve coverage [7]. The importance of advanced modeling techniques in predicting and addressing challenges in water distribution networks. These lessons are crucial for planning and implementing the water supply system for IKN Nusantara to ensure reliable and affordable drinking water [8].
The water supply system for IKN Nusantara relies heavily on raw water sources from the Sepaku River and Sepaku Semoi Dam [9], which must traverse significant elevation differences to reach distribution points. These hydraulic escalations necessitate substantial energy inputs for pumping, leading to higher production costs and financial burdens on the system [6]. Hydraulic gradients, characterized by elevation disparities, directly impact energy consumption and operational efficiency [5, 10, 11]. Without addressing these factors, the economic feasibility and sustainability of water supply infrastructure in Nusantara may be jeopardized [8].
Population growth and urban expansion in Nusantara add further complexity to water resource management. As the capital develops, the demand for potable water will surge, placing significant strain on existing infrastructure [12, 13]. Moreover, the high hydraulic gradient in the region poses additional challenges, such as increased risks of water loss and system inefficiencies [14-16]. These issues necessitate a comprehensive approach to focusing on minimizing energy consumption, reducing water losses, and ensuring equitable access to resources [1, 17]. Advanced modeling and predictive analytics can play a vital role in anticipating future demands and optimizing system performance [4, 18-21].
The primary objective of this research is to investigate and analyze the hydraulic and financial challenges associated with delivering drinking water to Nusantara. Specific aspects examined include: (1) Hydraulic Gradient and Pressure; (2) Cost of Production. The research question to be answer as follow: “How does the hydraulic gradient and pumping requirements in IKN Nusantara affect production costs, economic feasibility, and tariff structures, and what technical and financial strategies can be implemented to improve cost efficiency and long-term sustainability?”. By addressing these objectives and answering the research question, this study aims to provide a comprehensive understanding of the hydraulic and cost factors involved in establishing a reliable drinking water supply system for Indonesia's new capital city.
Given the complexity of water distribution in regions with varying elevations, designing an efficient system requires a thorough understanding of both engineering and economic parameters. Elevation-induced pressure differentials significantly affect energy consumption for water transport, leading to increased operational costs. By evaluating the hydraulic gradient, pressure losses, and power requirements, this research identifies critical inefficiencies and proposes mitigation strategies to enhance system resilience. Furthermore, financial modeling based on cost production equations enables an in-depth assessment of water tariffs, ensuring economic feasibility while maintaining accessibility for end users.
The findings aim to inform policymakers and stakeholders on the best practices for implementing efficient and cost-effective water infrastructure systems in the new capital. Moreover, beyond its immediate implications for Nusantara, this research contributes to the broader discourse on sustainable urban development in emerging economies. The interplay between hydraulic engineering, environmental sustainability, and economic feasibility is a global concern, particularly in regions with challenging topographies worldwide [22-25]. By presenting actionable insights and context-specific solutions, this study seeks to position IKN Nusantara as a model for resilient and fostering knowledge transfer to similar projects worldwide.
This explanatory research examines the relationship between hydraulic escalation (independent variable) and cost of production (dependent variable). The study focuses on the impact of hydraulic elevation on production costs and the resulting tariffs. Given the complex interplay between hydraulic factors and economic viability, this study integrates both engineering and financial analyses to ensure a holistic understanding of water distribution challenges. The research employs a multi-variable approach to assess the impact of elevation differences, flow velocity, hydraulic pressure, and power consumption on production costs.
This study employs a combination of direct field measurements and analytical calculations. Primary data were collected through direct observation using various measuring tools, while secondary data were obtained from literature, interview, visiting the location). The methodology is structured as follows: (1) Section 2.1 describes the study location; (2) Section 2.2 explains the focus of the study; (3) Section 2.3 details the data collection process; (4) Section 2.4 elaborates on the analysis conducted; (5) Section 2.5 discusses the conceptual model; (6) Section 2.6 describes the outcome indicators; (7) Section 2.7 provides the evaluative criteria.
2.1 Study area
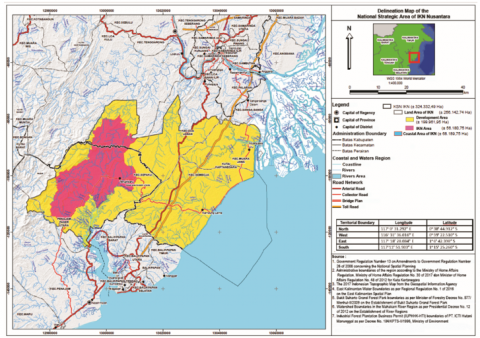
IKN region administratively lies within two existing regencies: Penajam Paser Utara Regency (Penajam and Sepaku sub-districts) and Kutai Kertanegara Regency (Loa Kulu, Loa Janan, Muara Jawa, and Samboja sub-districts). The IKN area is located north of Balikpapan City and south of Samarinda City, encompassing a land area of approximately 256,142 hectares and a marine area of approximately 68,189 hectares. The development of the IKN region is divided into three planning areas (see Figure 1).
Core Government Area (Indonesian: Kawasan Inti Pusat Pemerintahan or KIPP) covering approximately 6,671 hectares.
IKN Area (Indonesian: Kawasan IKN or KIKN) covering approximately 56,180 hectares.
IKN Development Area (Indonesian: Kawasan Pengembangan IKN or KP IKN) spanning 199,962 hectares.
The topography of IKN is characterized by diverse elevation levels, river basins [9, 26], and dense forested areas, which pose significant engineering challenges for infrastructure development, particularly in water distribution and hydraulic management. The Sepaku River and the Sepaku Semoi Dam serve as the primary raw water sources, requiring long-distance transmission pipelines and energy-intensive pumping mechanisms to supply water efficiently to the urban core. Given the region’s uneven terrain, elevation differences significantly influence hydraulic pressure and operational efficiency, making strategic planning essential for sustainable water supply management.
Climate variability and seasonal rainfall patterns significantly affect water availability and demand in the IKN region. Despite high annual precipitation, uneven distribution may cause shortages or excess runoff, impacting storage and distribution. To mitigate these risks, climate-resilient strategies such as reservoir optimization, adaptive pumping, and groundwater recharge are essential.
Rapid population growth and urban expansion further challenge water quality, service reliability, and infrastructure durability. Ensuring equitable access requires balancing supply, demand, and financial sustainability. Smart distribution systems, real-time monitoring, and predictive analytics are crucial for optimizing performance and minimizing water losses. Additionally, the integration of decentralized water treatment facilities can enhance system resilience by reducing reliance on a single supply source. Investing in energy-efficient pumping solutions can help reduce long-term operational costs while maintaining optimal water pressure across the distribution network.
Figure 1. Map of study location
Figure 2. A detailed map illustrating the water supply infrastructure for the new Indonesian capital, Nusantara. The map includes the Sepaku Semoi Dam, locations of water treatment plants, reservoirs, junctions, and distribution plans
2.2 Focus of the study
The planned raw water sources for Nusantara, which will be transported to the water treatment installation and then distributed through the distribution system (see Figure 2).
With the projected population expected to reach 1,542,000 by 2035, the production scenario for Nusantara from 2025 to 2035 will involve two raw water sources: (1) the Sepaku Semoi Dam (Location A); and (2) the Sepaku River Intake (Location B) [27].
From the Sepaku Semoi Dam (Location A), 2,500 liters per second of raw water will be extracted, with 350 liters per second delivered to KIPP (Location C), 1,650 liters per second reserved for further development, and 500 liters per second distributed to Balikpapan. While the Intake of the Sepaku River (Location B) 3,000 liters per second of raw water will be extracted, treated, and distributed in varying amounts: 900 liters per second to KIPP (Location C), and 2,100 liters per second reserved for the KIKN.
However, delivering raw water from the Sepaku Semoi Water Treatment Plant (Location A) to KIPP (Location C) requires a 16.84 km raw water pipeline (see Figure 3).
Figure 3. Elevation difference
The transmission system for Nusantara's water supply must address significant elevation differences and hydraulic challenges to ensure efficient delivery. The raw water collected from the Sepaku River and Sepaku Semoi Dam must be transported through an extensive pipeline network, requiring optimized hydraulic design to minimize energy losses and operational costs. Given the elevation variations between the intake points and the final distribution areas, a combination of gravity-fed and pumped transmission systems is essential to balance energy efficiency and pressure stability. Proper planning of storage reservoirs, booster stations, and pressure management zones will play a crucial role in ensuring a steady and reliable water supply for Nusantara’s growing population.
Pumping water against gravity presents significant economic and operational challenges, particularly in a system as large as Nusantara's raw water transmission network. The elevation differences between the Sepaku Semoi Water Treatment Plant and KIPP necessitate continuous pumping to overcome gravitational resistance, leading to substantial energy consumption. This increased energy demand translates directly into higher operational costs, making water distribution less cost-effective over the long term. Furthermore, pumping over long distances and steep inclines requires high-capacity pumps, which not only increase capital expenditures but also accelerate equipment wear and maintenance costs. If the system is not carefully optimized, rising energy and maintenance expenses could result in higher water tariffs [28], placing a financial burden. Overcoming these economic challenges requires strategic integration of gravity-fed sections where possible, along with energy-efficient pumping technologies to minimize electricity usage and reduce long-term costs.
2.3 Data collection
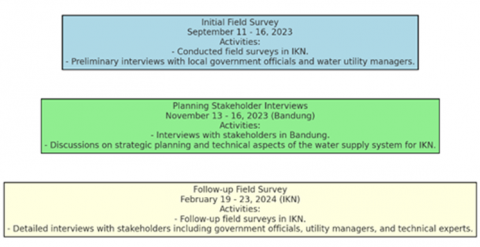
This study utilized both primary and secondary data collected during field surveys conducted on three separate occasions: (1) Initial Field Survey (September 11 - 16, 2023) conducted in the IKN region in the form of Preliminary interviews with local government officials and water utility managers; (2) interview with the Planning Stakeholder conducted between November 13 - 16, 2023, Bandung. The Interviews with the experts and planners involve in digging how they planning the drinking water supply system for IKN; (3) Follow-up Field Survey (February 19 - 23, 2024, IKN). Follow-up surveys in the IKN region, Detailed interviews with a broad range of stakeholders (Figure 4).
Figure 4. Field survey sequences
The key stakeholders involved in this study included representatives from various government and institutional bodies such as the Ministry of Public Works and Housing (Indonesian: Kementerian Pekerjaan Umum dan Perumahan Rakyat; abbreviated as Kemen PUPR), the Infrastructure and Facilities Deputy of the IKN Authority (Indonesian: Otorita Ibu Kota Nusantara; abbreviated as OIKN), and the Drinking Water Utilities (Indonesian: Perusahaan Daerah Air Minum or PDAM) of Kutai Kartanegara Regency and Penajam Paser Utara. Other important entities included the Kalimantan IV River Basin Organization (Indonesian: Balai Besar Wilayah Sungai or BBWS), the Meteorology, Climatology, and Geophysical Agency (Indonesian: Badan Meteorologi, Klimatologi, dan Geofisika; abbreviated as BMKG), and the Forestry Department (Indonesian: Dinas Kehutanan).
Additional stakeholders comprised the Environmental Agencies (Indonesian: Dinas Lingkungan Hidup) of North Penajam Paser Utara and Kutai Kartanegara, the Public Works and Spatial Planning Departments (Indonesian: Dinas Pekerjaan Umum dan Perencanaan Wilayah) of both regions, as well as technical centers such as the Hydraulic and Water Geotechnics Center (Indonesian: Balai Hidrolika dan Geoteknik Keairan) and the Directorate of Groundwater and Raw Water (Indonesian: Direktorat Air Tanah dan Air Baku) under the Directorate General of Water Resources (Indonesian: Direktorat Jenderal Sumber Daya Air) within the Ministry of Public Works and Housing.
2.4 Analytical approach
The analytical approach is divided into two sections: (1) Analysis of Hydraulic Escalation (Section 2.4.1); (2) Analysis of Cost Escalation (Section 2.4.2).
2.4.1 Hydraulic escalation
To design and optimize water distribution systems effectively, it is essential to consider the hydraulic principles governing flow behaviour, pressure loss, and energy requirements. These principles enable engineers to evaluate and address challenges such as friction-induced head loss, pressure gradients, and surge effects in pipelines. Accurate calculations of flow velocity, hydraulic pressure, and surge pressures (such as water hammer) are critical for ensuring system efficiency, reliability, and resilience. By integrating these calculations with hydraulic gradient analysis, engineers gain valuable insights into pressure demands, energy losses, and potential risks, forming the foundation for optimizing hydraulic infrastructure under diverse conditions.
The following assumptions are made when applying these equations:
Steady-State Flow: The fluid flow is assumed to be steady, meaning the flow rate and velocity are constant over time.
Incompressible Fluid: Water is considered incompressible, meaning its density remains constant.
Laminar or Turbulent Flow: The flow inside the pipe is assumed to be turbulent, which is typical for most large-scale water supply systems. The Darcy friction factor is calculated for turbulent flow.
Constant Pipe Diameter: The pipe diameter DDD is constant along the length of the pipe.
Roughness: The pipe surface is assumed to have a certain level of roughness, affecting the friction factor.
A Hydraulic Gradient is a critical parameter in pipeline systems, representing the slope or inclination of the hydraulic head along the pipe's length. It can be calculated using key equations such as the Darcy-Weisbach [29] (Eq. (1)), Power Loss equation (Eq. (2)), and Hydraulic Gradient equation (Eq. (3)), depending on the specific parameters of the system. The hydraulic gradient (I) can be either positive or negative, reflecting the relative positions of key points along the pipeline. A positive hydraulic gradient occurs when Position C (as depicted in Figures 2 and 3) is at a lower elevation than Position A, indicating downward flow that requires less energy to maintain. Conversely, a negative hydraulic gradient occurs when Position C is higher than Position A, increasing flow resistance and potentially necessitating additional pumping power to overcome the elevation difference. These calculations and principles are indispensable for effective planning, sustainable management, and the long-term reliability of water distribution systems. For more clarity, see the nine equations below:
(1) Darcy-Weisbach equation to determine head loss due to friction in the pipelines. The Darcy-Weisbach equation is utilized to determine the head loss ($h_f$) due to friction in the pipeline system, enabling an understanding of energy losses as water flows through.
$h_f=f \times\left(\frac{L}{D}\right) \times\left(\frac{V^2}{2 g}\right)$ (1)
where, $h_f=$ head loss (m); $f=$ friction factor (dimensionless); $L=$ length of the pipe (m); $D=$ diameter of the pipe $(\mathrm{m}) ; V=$ flow velocity $(\mathrm{m} / \mathrm{s}) ; g=$ acceleration due to gravity $\left(9.81 \mathrm{~m} / \mathrm{s}^2\right)$.
(2) Power loss is calculated to assess the energy required to maintain flow under varying conditions, particularly in regions with steep gradients [30]. Assessing the necessary pumping power to maintain adequate water pressure at different elevations:
$P_{loss}=\rho \times \mathrm{g} \times Q \times h_f$ (2)
where, $P_{\text {loss }}=$ power loss $(\mathrm{W}) ; \rho=$ density of the fluid $\left(\mathrm{kg} / \mathrm{m}^3\right)$; $Q=$ volumetric flow rate $\left(\mathrm{m}^3 / \mathrm{s}\right) ; h_f=$ head loss (m).
Assumed Density of Fluid (ρ) to be 1000 kg/m³ for freshwater, which is the standard density of water at ambient temperature (20-25℃). This assumption is critical for the accurate calculation of power loss as the density directly impacts the energy required to maintain water flow. The rationale behind this is that the density of water remains relatively constant under normal operational conditions, but variations could exist depending on the temperature and water quality, particularly in regions where significant changes in water properties are expected.
The volumetric flow rate Q is assumed to be based on the projected demand for water in each zone, and it is estimated at X m³/s (based on the water demand estimates for the new capital). This flow rate is subject to change based on population growth, seasonal demand fluctuations, and system efficiency. The rationale behind this is that the Flow rate is directly tied to water demand and affects the overall pumping energy required. The assumptions on Q ensure that the system's energy needs are accurately estimated.
Head loss $h_f$ is calculated using the Darcy-Weisbach equation, accounting for frictional losses and elevation changes in the water distribution network. An estimated value of $h_f$= X meters has been used, based on the hydraulic gradient calculated for each zone and the expected elevation differences across the network. The Head loss plays a significant role in determining the energy required to overcome friction in the system and to maintain flow under varying pressure conditions. Assumptions about pipe material, diameter, and length, as well as roughness coefficients, contribute to the accuracy of these estimates.
(3) Hydraulic Gradient (I)
$I=\frac{H_1-H_2}{L}$ (3)
where, $I=$ Hydraulic Gradient; $H_1=$ Height (m) $; H_2=$ Height (m) $L=$ length between $H_1$ and $H_2(\mathrm{~km})$.
(4) Flow Velocity (V) [31].
$V=\frac{4 \times Q}{\pi \times d^2}$ (4)
where, V= Velocity (m/s); Q= flow (m3/s); d = Diameter (m).
(5) Hydraulic pressure (p) [32, 33].
$p=\rho \times g \times H$ (5)
where, $\rho=1000 \mathrm{~kg} / \mathrm{m} 3 ; g=9,8 \mathrm{~m} / \mathrm{s}^2 ; H=I ; p=$ Hydraulic pressure $(\mathrm{Pa}) /(\mathrm{kPa}) /\left(\frac{\mathrm{N}}{\mathrm{m}^2}\right) /(Bar )$.
(6) Power Generated (P) [32].
$P_{\text {loss }}=\rho \times \mathrm{g} \times Q \times h_f$ (6)
where, $Q=$ Flow $\mathrm{m}^3 / \mathrm{s} ; p=$ Hydraulic pressure $(\mathrm{Pa}) /(\mathrm{kPa}) /$ $\left(\frac{\mathrm{N}}{\mathrm{m}^2}\right) /($ Bar $) ; P=$ power generated (Watt/KiloWatt/KVA).
This equation comes from the fundamental principle of energy conservation in fluid flow. When a fluid flows through a pipe, friction between the fluid and the pipe wall causes a loss of energy in the form of heat. The power loss is directly related to the head loss, which is the difference in pressure caused by the frictional forces.
Energy per unit mass is given by Energy =P/ρ, where ρ is the density of the fluid.
Power is the rate at which energy is used or transferred. In this case, it is the rate at which energy is being lost due to frictional losses as water moves through a pipe.
Flow Rate: The power loss is related to the volumetric flow rate Q, which is the amount of fluid passing through the pipe per second. This term is multiplied by the head loss $h_f$ to determine the total energy lost.
(7) Surge Pressure Velocity “Water Hammer” [34, 35],
$A P=\rho \times a \times \Delta v$ (7)
where, $A P=$ surge pressure ( Pa ); $\rho=$ density of the fluid $\left(1000 \mathrm{~kg} / \mathrm{m}^3\right) ; a=$ wave speed $(1400 \mathrm{~m} / \mathrm{s}) ; \Delta v=$ change in flow velocity (m/s)
AP represents the increase in pressure within the pipeline due to the sudden change in flow velocity. Water hammer is a sudden shock pressure that can cause pipe damage, valve failure, and other issues in water supply systems.
Density (ρ): This is the mass per unit volume of the fluid (water). For water at standard conditions, the density is (1000 kg/m³, but for other fluids, this value would change.
Wave Speed (a): This is the speed at which the pressure wave travels in the pipeline. For water, a typical value of 1400 m/s is used, but this can vary based on the type of fluid and pipe material.
Change in Flow Velocity (∆v): This represents the change in the velocity of the fluid within the pipe. It is the difference between the initial and final velocities of the water, caused by events like valve closures or pump failures.
The formula is used to assess the water hammer phenomenon in a pipeline system. When there is a sudden change in velocity (such as a valve closing too quickly), it generates a pressure spike, which can cause pipe bursts, damage to fittings, and other structural damage to the system. By calculating surge pressure, engineers can design systems with appropriate measures (e.g., surge tanks, slow-closing valves) to mitigate the effects of water hammer.
(8) Acceleration (a) [34],
$a=\frac{1400 N}{\sqrt{1+\frac{2,1 \times 10^9 \times d}{E \times t}}}$ (8)
where, Acceleration $(a)=1400 \mathrm{~N}\left(10 \mathrm{~m} / \mathrm{s}^2\right) ;(E)=2 \times 1011 \mathrm{N} / \mathrm{m}^2=200 \times 109 \mathrm{~N} / \mathrm{m}^2$; Penstock Diameter (d) (m); Thickness (t) (m).
(9) The height of a water hammer surge in a pipeline system) [32].
$h_{\text {surge }}=\frac{a \cdot v}{g}$ (9)
where, $h_{\text {surge }}=$ Surge head (meters of water column) (m); $a$ $=$ Wave speed $(\mathrm{m} / \mathrm{s}) ; g=9,8 \mathrm{~m} / \mathrm{s}^2$.
2.4.2 Cost escalation
This section delves into the financial implications of hydraulic escalation, focusing on the increased costs associated with pumping water to higher elevations and addressing the economic challenges of providing an efficient water distribution system. The analysis leverages comparative data from water utilities in Kutai Kartanegara and North Penajam Paser, as a dedicated water utility for IKN Nusantara has not yet been established. To assess the economic sustainability of water supply systems, the section integrates several critical financial equations that quantify production costs, tariffs, and profitability.
The Basic Cost of Production (BCP), calculated using Eq. (10), serves as the foundation for evaluating the minimum cost of producing each cubic meter of water, incorporating variable costs (VC), overhead costs (OC), production volume (VP), and volume losses (VL). Building on this, the Base Tariff (BT) in Eq. (11) evaluates the minimum tariff required to cover total operating costs (TOC), while accounting for water losses during distribution, assumed at 20% of production (WP).
To provide insights into revenue efficiency, the Average Tariff (AT) in Eq. (12) calculates the revenue generated per cubic meter of water delivered, based on total water revenue (TWR) and the volume of water delivered (WD). Finally, the Margin (M), as expressed in Eq. (13), measures the profitability of the water supply system by comparing the average tariff with the basic cost of production. Together, these equations form a comprehensive framework for analyzing the financial sustainability of hydraulic infrastructure, particularly in the context of elevation challenges and growing water demand in IKN Nusantara.
(1) Basic Cost of Production (BCP). BCP represents the minimum cost of producing a unit volume of water, factoring in variable costs, overhead costs, production volume, and losses. Determines the baseline cost for producing each unit of water after accounting for losses [36, 37].
$B C P=\frac{V C+O C}{V P-(V L \times V P)}$ (10)
where, $B C P=$ Basic Cost of Production $\left(\mathrm{IDR} / \mathrm{m}^3\right) ; V C=$ Variable Cost ($\mathrm{IDR} / \mathrm{m}^3$); $O C=$ Overhead Cost $\left(\mathrm{IDR} / \mathrm{m}^3\right) ; V P$ $=$ Volume of Production $\left(\mathrm{m}^3 / \mathrm{s}\right) ; V L=$ Volume Losses $\left(\mathrm{m}^3 / \mathrm{s}\right)$.
The Electricity Tariff used to estimate operational costs based on energy consumption is assumed to be IDR X per kWh, derived from local utility rates for water utilities. The rationale behind this that the electricity tariff is crucial for determining the cost of power loss as calculated in Eq. (2). The value of $P_{loss}$ (power loss) directly translates to an energy cost, and this cost impacts the overall economics of water supply and distribution.
The Energy Cost Assumption, to be specific, the efficiency of pumps and associated equipment is assumed to be X% (e.g., 85%), which reflects the real-world performance of modern centrifugal pumps. This efficiency directly influences the amount of energy required to achieve the desired flow rate. Rationale behind this is that the assumption of pump efficiency helps convert the calculated power loss into practical energy consumption. A higher efficiency reduces the energy required, while a lower efficiency increases energy costs.
(2) Base Tariff (BT). BT is the cost per cubic meter of water that covers total operating expenses. Helps determine the minimum tariff required to sustain operations, accounting for production losses
$B T=\frac{T O C}{W P-(20 \% * W P)}$ (11)
where, $B T=$ Base Tariff $\left(\mathrm{IDR} / \mathrm{m}^3\right) ; T O C=$ Total Operating Costs (IDR); $W P=$ Water Produce $\left(\mathrm{m}^3\right)$.
(3) Average Tariff (AT) [38]. The average price charged per unit of water delivered. Provides an overall measure of revenue generated relative to water delivery.
$A T=\frac{T W R}{W D}$ (12)
where, Average Tariff $(A T)\left(\mathrm{IDR} / \mathrm{m}^3\right) ; \mathrm{WR}=$ Total Water Revenue (IDR); WD = Water Delivered ($\mathrm{m}^3$).
(4) Margin (M). Margin is the profit or surplus per unit of water after covering basic production costs. Highlights the financial sustainability of the system by comparing revenue and production costs.
$M=A T-B C P=\frac{T W R}{W D}-\frac{V C+O C}{V P-(V L \times V P)}$ (13)
where, Average Tariff (IDR/m³); TWR = Total Water Revenue (IDR); WD = Water Delivered ($\mathrm{m}^3$).
This comprehensive approach ensures a clear understanding of the financial impacts of hydraulic escalation and informs economic sustainability assessments [39].
2.5 Conceptual model
The conceptual model presented in this study (Figure 5) examines the relationship between hydraulic escalation (independent variable) and production costs (dependent variable). Properly designed gravity-based water systems are hypothesized to reduce costs by eliminating unnecessary pumping expenses, thereby enhancing the system’s financial viability. This approach provides essential insights for decision-making in water provision, ensuring both technical optimization and economic sustainability in the development of Nusantara's water infrastructure.
Figure 5. Conceptual model
This article presents several novel contributions: (1) Comprehensive Multi-Aspect Analysis: research conducts a comprehensive analysis encompassing hydraulic gradient, pressure requirements, cost of production, infrastructure needs, and strategic management. (2) Context-Specific Solutions for a unique context of IKN Nusantara, considering the specific geographical, demographic, and infrastructural characteristics of the new capital. This context-specific focus ensures that the proposed solutions are practical and applicable, addressing the real-world challenges faced by the region. (3) Strategic Management Recommendations: The study not only identifies challenges but also provides strategic management recommendations to ensure the sustainability and accessibility of the water supply system. These recommendations are grounded in integrated water resource management principles, making them robust and forward-thinking.
2.6 Outcomes indicator
The outcomes are generated by the conjuncture of the outputs [40]. The outcome indicators presented in Table below. The outcomes are evaluated by comparing the planned targets and actual performance of the system and financial metrics. The evaluation criteria are detailed in the system performances, which are expected to impact the financial results.
2.7 Evaluation criteria
Evaluative criteria are used to judge the performance of the system [41] examining the potential impact of hydraulic escalation on system performance (see Table 1).
Table 1. Evaluative criteria and outcome indicator
|
No. |
Evaluation Criteria |
No. |
Outcome Indicator / Output |
Unit |
|
1 |
System Performance |
1. |
Hydraulic Gradient |
+ / - |
|
2. |
Flow Velocity |
m/s |
||
|
3. |
Pressure |
(N/m2)/(bar) |
||
|
4. |
Power Generate |
KVA |
||
|
5. |
Surge Pressure |
Pa |
||
|
2 |
Financial Performance |
6. |
Basic Cost of Production |
IDR/m3 |
|
7. |
Average Tariff |
IDR/m3 |
||
|
8 |
Margin |
IDR/m3 |
Section 2 provides a comprehensive analysis of the relationship between hydraulic escalation and production costs, emphasizing its role in determining water tariffs in IKN Nusantara. By integrating field data, analytical methods, and stakeholder inputs, the study highlights the impact of elevation challenges on cost and infrastructure planning. The conceptual model and supporting equations establish a framework for optimizing water distribution systems, ensuring both technical efficiency and economic sustainability.
The results of this study are derived from calculations using the formulas presented Section 2.4. The analysis encompasses various aspects of hydraulic and financial implications of the water supply system for IKN Nusantara. The findings are divided into several key areas: (1) Hydraulic Calculations for the main pipeline from Sepaku Semoi Dam to Sepaku River Intake and then to the Core Government Area (KIPP) are presented, and Detailed assessments of pressure requirements and potential issues such as water hammer are included (Section 3.1); (2) Cost Analysis consist of BCP, Base Tariff (BT), Average Tariff (AT), Margin (M). These costs are then compared to existing water tariffs to assess economic feasibility and sustainability (Section 3.2); (3) Section 3.3, which focuses on the impact of pumping costs.
3.1 Hydraulic escalation
This section presents a comprehensive analysis of the key hydraulic and financial parameters influencing the design, efficiency, and sustainability of the water distribution system in IKN Nusantara. These parameters, derived from earlier calculations, highlight critical challenges and propose necessary engineering solutions to maintain optimal system performance. The analysis focuses on hydraulic gradient, flow velocity, hydraulic pressure, power requirements, and water hammer risks, each serving as an independent variable impacting the overall system operation.
The subsequent analysis is structured into subsections 3.1.1 to 3.1.9, detailing each parameter and its implications in the context of IKN's water infrastructure development.
3.1.1 Head loss analysis
The Darcy-Weisbach equation was used to calculate the head loss due to friction in the primary pipeline. Where $f=$ 0.0114 (dimensionless); $L=16,840(\mathrm{m}) ; D=2.40(\mathrm{m}) ; V=$ $2.21(\mathrm{m} / \mathrm{s}) ; g=$ acceleration due to gravity $\left(9.81 \mathrm{m} / \mathrm{s}^2\right)$. Substituting these values into Eq. (1), result as follow:
$h_f=0.0114 \times\left(\frac{16,840}{2.40}\right) \times\left(\frac{2.21^2}{2 \times 9.81}\right)=4.95 \mathrm{~m}$
The calculation shows that a total head loss of 4.95 m occurs over the pipeline length. This indicates that friction in the pipeline contributes to a moderate energy loss, which must be considered in the pumping power calculations to maintain adequate pressure throughout the distribution network.
3.1.2 Assessing the pumping power requirement
To maintain adequate water pressure at different elevations, the power loss $\left(P_{\text {loss}}\right)$ due to head loss. Where $\rho=1000$ $\left(\mathrm{kg} / \mathrm{m}^3\right) ; Q=0.3\left(\mathrm{m}^3 / \mathrm{s}\right) ; h_f=4.95(\mathrm{m})$. Substituting these values into Eq. (2), result as follow:
$\begin{gathered}P_{\text {loss }}=1000 \times 9.81 \times 0.3 \times 4.95=14,566.35 \mathrm{~W} \\ =14.57 \mathrm{~kW}\end{gathered}$
The required pumping power loss to maintain flow at the given elevation and friction conditions is 9.7 kW. This value is critical for designing a sustainable pumping system to ensure stable water pressure distribution while minimizing energy consumption.
3.1.3 Hydraulic gradient calculation
The Hydraulic Gradient (I) represents the slope of the hydraulic head along the pipeline. where $\mathrm{H}_1=14(\mathrm{m}); \mathrm{H}_2=$ $140(\mathrm{m}); \mathrm{L}=16.84(\mathrm{km})$. Substituting these values into Eq. (3), result as follow:
$\mathrm{I}=\frac{14(\mathrm{~m})-140(\mathrm{~m})}{16840(\mathrm{~m})}=-0.00748 \mathrm{~m}=-7.48 \mathrm{~km}$
A negative hydraulic gradient indicates that the water must be pumped uphill, requiring additional energy to overcome the elevation difference. This calculation is crucial for pumping system design and optimizing energy efficiency in the water distribution network.
3.1.4 Flow Velocity (V)
The Flow Velocity (V) represents the speed at which water travels through the pipeline [42]. Given the parameters: Q= 0,2 m3/s; d= 1 m or 1000 mm. Substituting these values into Eq. (4), result as follow:
$V=\frac{4 \times Q}{\pi \times d^2}=\frac{4 \times 0.3}{3.14 \times(1)^2}=\frac{1.2}{3.14}=0.382 \mathrm{~m} / \mathrm{s}$
The calculated flow velocity of 0.382 m/s indicates the movement speed of water through the pipeline. This value is critical for evaluating hydraulic efficiency, ensuring optimal pipe sizing, and minimizing energy losses in the distribution system.
3.1.5 Hydraulic pressure (p)
The Hydraulic Pressure (p) quantifies the force exerted by water at a given elevation. Given the parameters: ρ=1000 kg/m3; g= 9.8 m/s2; H=-126. Substituting these values into Eq. (5) , result as follow:
$\begin{gathered}p=1000 \frac{\mathrm{~kg}}{\mathrm{~m}^3} \times 9.8 \times(-126)=-1234800 \mathrm{~Pa} =-12.348 \mathrm{Bar}\end{gathered}$
The negative hydraulic pressure of -12.348 Bar indicates a potential vacuum or suction condition within the system. This result is crucial for designing appropriate pumping mechanisms to prevent cavitation and ensure stable pressure regulation in the pipeline network.
3.1.6 Power Generated (P)
The Power Generated (P) represents the energy required to sustain water movement under specific hydraulic conditions. Where $\mathrm{Q}=0.3 \mathrm{~m}^3 / \mathrm{s} ; p=-1,235,000 \frac{\mathrm{~N}}{\mathrm{~m}^2}$. Substituting these values into Eq. (6), result as follows:
$P=Q \times p=0.3 \times 1,234,800$ watt $=370.44$
The calculated power of 370.44 kW indicates the energy required to maintain the water flow under the given hydraulic pressure. This value is essential for designing efficient pumping systems and ensuring adequate power supply in water distribution infrastructure.
3.1.7 Surge pressure velocity “Water Hammer”
The Surge Pressure Due to Water Hammer (ΔP) represents the sudden rise in pressure caused by abrupt changes in water velocity within the pipeline system. This phenomenon is critical for assessing the structural integrity of pipelines and designing mitigation strategies to prevent damage. Given the parameters: r = 1000 kg/m³; a = 1400 m/s.
Δv = 0.382 m/s. Substituting these values into Eq. (7), result as follows:
$\begin{gathered}\Delta \mathrm{P}=\rho \times \mathrm{a} \times \Delta \mathrm{v}=1000 \times 1400 \times 0.382=534,800 \mathrm{~Pa}= 5.348 \text {Bar.}\end{gathered}$
This result indicates that the water hammer effect causes a surge pressure of 5.348 Bar (534.8 kPa). Understanding and managing this pressure surge is crucial to preventing pipeline failure, selecting appropriate pipe materials, and implementing pressure relief systems to enhance the reliability of the water distribution infrastructure.
3.1.8 Acceleration (a) due to water tension constant
The acceleration a is derived based on the elasticity of the pipeline material and the influence of internal stress caused by sudden changes in flow conditions. This calculation is essential for understanding the dynamic response of pipelines to pressure surges. Given the parameters: Water Tension Constant = 1400 N; E = 2 × 10¹¹ N/m2 = 200 × 109 N/m2; d = 1 m or 1000 mm; t = 3.91 mm = 0.391 m. Substituting these values into Eq. (8), result as follow:
$a=\frac{1400 \mathrm{~N}}{\sqrt{1+\frac{2,1 \times 10^9 \times 1 \mathrm{~m}}{200 \times 10^9 \frac{\mathrm{~N}}{\mathrm{~m}^2} \times 0.391 \mathrm{~m}}}}=\frac{1400 \mathrm{~N}}{1,0133}=1,381 \mathrm{~m} / \mathrm{s}^2$
This calculated acceleration of 1381 m/s² highlights the dynamic forces acting within the system, which must be considered in pipeline design and surge protection strategies. Ensuring that materials and construction specifications can withstand these forces is critical to preventing failures due to water hammer effects.
3.1.9 The surge height $\left(\mathrm{h}_{\text {surge}}\right)$ due to water hammer effect
The surge height $\left(\mathrm{h}_{\text {surge}}\right)$ represents the pressure rise in the pipeline caused by a sudden change in flow velocity, commonly referred to as water hammer. This effect can lead to significant pressure surges, which may damage the pipeline system if not properly accounted for. Given the parameters: $\mathrm{a}=1,381 \frac{\mathrm{~m}}{\mathrm{~s}^2}$; $\mathrm{v}=0.38 \mathrm{~m} / \mathrm{s} ; \mathrm{g}=9,8 \frac{\mathrm{~m}}{\mathrm{~s}^2}$. Substituting these values into Eq. (9), result as follows:
$\mathrm{h}_{\text {surge }}=\frac{1,381 \frac{\mathrm{~m}}{\mathrm{~s}^2} \times 0.38 \mathrm{~m} / \mathrm{s}}{9,8 \frac{\mathrm{~m}}{\mathrm{~s}^2}}=53.57 \mathrm{~m}=5.25 \mathrm{bar}$
The calculated surge height of 53.57 m (5.25 bar) indicates a substantial pressure increase due to the water hammer effect. This result emphasizes the need for surge protection measures, such as: (1) Installing air chambers or surge tanks to absorb pressure fluctuations; (2) Implementing slow-closing valves to reduce abrupt velocity changes; (3) Using reinforced pipeline materials capable of withstanding pressure spikes. This analysis is crucial in pipeline system design, ensuring that hydraulic infrastructure remains resilient, reliable, and protected against sudden pressure surges.
The findings in Section 3.1 emphasize the critical role of hydraulic parameters in determining the efficiency, reliability, and cost-effectiveness of the water distribution system in IKN Nusantara. The hydraulic gradient of -0.00748 indicates insufficient gravitational head, necessitating additional pumping power for adequate water flow. The flow velocity of 0.382 m/s ensures stable water transport, balancing flow efficiency, system design, and maintenance needs.
However, the negative hydraulic pressure of -12.348 Bar highlights the substantial energy demand required to push water to higher elevations, reinforcing the need for optimized pumping infrastructure. The power requirement of 370.44 kW underscores the operational cost implications, necessitating energy-efficient solutions. Additionally, the high-water hammer risk, with a surge pressure of 5.348 Bar, demands effective mitigation strategies, such as surge tanks, air chambers, and slow-closing valves, to prevent pipeline damage.
Overall, hydraulic factors significantly impact system sustainability. Proper management of hydraulic gradient, velocity, pressure, power demands, and surge risks is essential for designing a robust, cost-efficient, and resilient water distribution network for IKN Nusantara.
3.2 Cost escalation
The cost of pumping water from different elevations will become a permanent component of production costs [43]. Low cost [44] or high cost pumping [45] lead to different situation.
To estimate the cost of production in IKN, we used an approach that averages the production costs of two water utilities that have been operating since before IKN was established. The cost of production is obtained by summing the variable costs and overhead costs. The total variable and overhead costs for producing drinking water for Danum Taka are IDR 1,444 per cubic meter, whereas for Tirta Mahakam, they are IDR 5,180 per cubic meter (Table 2).
Table 2. Cost escalation analysis of Danum Taka and Tirta Mahakam: The two nearest water utilities to IKN
|
No. |
Cost |
Unit |
Danum Taka |
Tirta Mahakam |
Nusantara |
|
1 |
Variable |
IDR/m3 |
1,158 |
1,219 |
1188.5 |
|
2 |
Overhead |
IDR/m3 |
289 |
3,961 |
2125 |
|
3 |
Cost of Production |
IDR/m3 |
1,447 |
5,180 |
3313.5 |
|
4 |
Volume of Production |
m3/s |
0.34 |
1,676 |
5 |
|
|
|
m3/year |
10,722,240 |
52,854,336 |
157,680,000 |
|
5 |
Production Efficiency |
Lps |
31% |
82.97% |
100% |
|
6 |
Volume of Production |
Lps |
105 |
1391 |
5000 |
|
|
|
m3/s |
0.11 |
1.39 |
5.00 |
|
|
|
m3/year |
3,323,894 |
43,853,243 |
157,680,000,000 |
|
7 |
Water Losses |
% |
35% |
32% |
5% |
|
|
|
Lps |
235 |
285 |
0 |
|
|
|
m3/s |
0.037 |
0.445 |
0.250 |
|
|
|
m3/year |
1,163,363 |
14,033,038 |
7,884,000 |
|
8 |
Basic Cost of Production |
IDR/m3 |
6,506 |
4561 |
883,6 |
|
9 |
Total Cost of Operation |
IDR |
14,052,306,000 |
135,606,380,000 |
244,482,079,377 |
|
10 |
Base Tariff |
IDR/m3 |
1,311 |
2,566 |
1,938 |
|
11 |
Average Tariff |
IDR/m3 |
4,977 |
4,677 |
4,827 |
|
12 |
Margin |
IDR/m3 |
-1,529 |
116 |
3,943.4 |
In Table 2, the significant cost difference is primarily due to varying overhead costs, while the variable costs remain relatively similar are presented. By averaging the total variable and overhead costs from both utilities, the estimated production cost for water utilities in IKN is IDR 3,313.5 per cubic meter. This suggests there is potential for cost adjustments depending on the overhead and variable cost components of the water utilities in IKN.
For IKN, predictions indicate a much-improved scenario due to the planned infrastructure. The cost of production is estimated at IDR 3,313.5 per cubic meter, derived from variable costs of IDR 1,188.5 per cubic meter and overhead costs of IDR 2,125 per cubic meter. The volume of production is expected to be significantly higher, at 5 m³/s or 157,680,000 m³/year, with a production efficiency of 100%. Water losses are projected to be only 5%, a marked improvement over the 35% and 32% losses seen in Danum Taka and Tirta Mahakam, respectively. These data for IKN are based on planned future operations and projections outlined in the table provided, which uses averages and estimations from the existing utilities to forecast performance in the new capital.
The base tariff is the fundamental cost required to produce one cubic meter of drinking water, regardless of whether each cubic meter is produced with high overhead costs (such as high employee salaries) or not. The total production costs for the two utilities are as follows: for Danum Taka, with a production capacity of 10,722,240 m³/year and an operational cost of IDR 14,052,306,000, the base tariff is IDR 1,311 per cubic meter. For Tirta Mahakam, with a production capacity of 52,854,336 m³/year and an operational cost of IDR 135,606,380,000, the base tariff is IDR 2,711 per cubic meter.
To estimate the base tariff for IKN, we used data from Danum Taka and Tirta Mahakam. By averaging the production costs of these two utilities, we derived an estimated production cost for IKN of IDR 3,313.5 per cubic meter. The operational costs were also averaged, resulting in an estimated base tariff for IKN. The calculations consider the projected production volume for IKN, which is significantly higher at 157,680,000 m³/year due to the expected efficiency of the new facilities and reduced water losses. The base tariff for IKN is estimated to be IDR 1,938 per cubic meter. This is calculated by considering the improved efficiency and reduced water losses compared to Danum Taka and Tirta Mahakam. The result suggests that the new infrastructure and efficient management planned for IKN will allow for a lower base tariff, making the water supply more cost-effective and sustainable.
The average tariffs are IDR 4,977 per cubic meter for Danum Taka and IDR 4,677 per cubic meter for Tirta Mahakam, with a predicted tariff of IDR 4,827 per cubic meter for IKN. This prediction assumes improved infrastructure, high operational efficiency, and that the water produced will meet drinking quality standards [46]. The base tariff for IKN is estimated to be IDR 1,938 per cubic meter. The margin, calculated as the difference between the average tariff and the basic cost of production, highlights the financial sustainability of the utility. For IKN, a margin of IDR 3,943.4 per cubic meter (average tariff minus production cost) indicates a favorable economic scenario.
Table 3. Cost escalation prediction for IKN Nusantara
|
No. |
Cost Escalation |
Parameter |
Result |
|
1 |
BCP |
$\begin{gathered}\mathrm{VC}=1188,5 \mathrm{IDR} / \mathrm{m}^3 ; \mathrm{OC}=2125 \\ \mathrm{IDR} / \mathrm{m}^3 ; \mathrm{VP}=5 \mathrm{~m}^3 / \mathrm{s} ; \mathrm{VL}=0,250 \\ \mathrm{~m}^3 / \mathrm{s}\end{gathered}$ |
$\begin{array}{r}B C P=\frac{1188,5 \frac{\mathrm{IDR}}{\mathrm{m}^3}+2125 \mathrm{IDR} / \mathrm{m}^3}{5 \frac{\mathrm{~m}^3}{\mathrm{~s}}-0,250 \frac{\mathrm{~m}^3}{\mathrm{~s}} \times 5 \frac{\mathrm{~m}^3}{\mathrm{~s}}} =883,6 \mathrm{IDR} / \mathrm{m}^3\end{array}$ |
|
2 |
Total Operating Costs (TOC) |
$\begin{aligned} B T & =1.938 \mathrm{IDR} / \mathrm{m}^3 ; \\ W P & =157.680 .000 \mathrm{~m}^3\end{aligned}$ |
$\begin{gathered}T O C=B T \times W P-(20 \% * W P)=1.938 \frac{\mathrm{IDR}}{\mathrm{m}^3} \times \\ \left(157.680 .000 \mathrm{~m}^3-(20 \% *\right. \left.\left.157.680 .000 \mathrm{~m}^3\right)\right)=244,903,680,000 \mathrm{IDR}\end{gathered}$ |
|
3 |
Average Tariff (AT) |
$\begin{gathered}A T_{\text {Danum Taka }}=4977 \mathrm{IDR} / \mathrm{m}^3 \\ A T_{\text {Tirta Mahakam }}=4677 \mathrm{IDR} / \mathrm{m}^3\end{gathered}$ |
$\begin{gathered}A T=\frac{A T_{\text {Danum Taka }}+A T_{\text {Tirta Mahakam }}}{2}=\frac{4977+4677}{2}=4.827 \mathrm{IDR} / \mathrm{m}^3\end{gathered}$ |
|
4 |
Margin (M) |
$A T=4.827 \mathrm{IDR} / \mathrm{m}^3$ |
$M=A T-B C P=4.827 \frac{\mathrm{IDR}}{\mathrm{m}^3}-883,6 \frac{\mathrm{IDR}}{\mathrm{m}^3}=3943,4 \frac{\mathrm{IDR}}{\mathrm{m}^3}$ |
The results are presented in Table 3. This analysis provides a comprehensive overview of the expected financial and operational metrics for the future water utilities in IKN Nusantara, forming a basis for strategic planning and decision-making in establishing a sustainable and cost-effective water supply system.
Table 3 calculations are crucial for understanding the economic viability of water supply in the new capital, providing a roadmap for efficient and sustainable water utility management. The detailed financial metrics outlined in Table 3 offer insights into the expected costs and revenues, highlighting the potential for a significant positive margin, ensuring the financial sustainability of the water supply system in IKN Nusantara.
3.3 Impact of pumping costs
The 126-meter elevation difference significantly impacts production costs, necessitating additional daily and annual pumping expenses. The breakdown of pumping costs is as follows:
(1) When (1) Power required for pumping $(P)\left(\frac{k W h}{d a y}\right)=$ $11,115 \frac{k W h}{d a y}$; (2) Electricity tariff $\left(C_{e l e c}\right)=1,114.74\left(\frac{I D R}{d a y}\right)$, then Daily energy cost $\left(E_{\text {daily}}\right)\left(\frac{I D R}{d a y}\right)$ calculates as follow:
$\begin{aligned} E_{\text {daily }}= & P \times C_{\text {elec }}=11,115 \times 1,114.74 =12,391,035.1 \frac{I D R}{d a y}\end{aligned}$
(2) When (1) Daily energy cost $\left(E_{\text {daily}}\right)\left(\frac{I D R}{d a y}\right)=$ $12,391,035.1 \frac{I D R}{d a y}$; (2) Number of days in a year is 365 days $\left(D_{\text {year }}\right)$, then the Annual Energy Cost $\left(E_{\text {annual}}\right)$ calculates as follow:
$\begin{gathered}E_{\text {annual }}=E_{\text {daily }} \times D_{\text {year }}=12,391,035.1 \times 365 =4,523,745,811.5 \mathrm{IDR} / \text { year }\end{gathered}$
(3) When (1) Daily energy cost $\left(E_{\text {daily}}\right)\left(\frac{I D R}{d a y}\right)=$ 12,391,035.1 $\frac{I D R}{d a y}$; (2) Daily pumped water volume $\left(m^3\right)\left(V_{\text {daily}}\right)=25,920 \frac{m^2}{d a y}$, then Pumping Cost per $\mathrm{m}^3$ $\left(C_{\text {pump}}\right)$ calculates as follow:
$C_{\text {pump }}=\frac{E_{\text {daily }}}{V_{\text {daily }}}=\frac{12,391,035.1 \frac{I D R}{\text { day }}}{25,920 \frac{\mathrm{~m}^3}{\text { day }}}=478.05 \frac{\mathrm{IDR}}{\mathrm{m}^3}$
(4) When (1) Base cost of production (BCP) $\left(\frac{I D K}{m^3}\right)=$ $883,6 \frac{\mathrm{IDR}}{\mathrm{m}^3}$; (2) Pumping Cost per $\mathrm{m}^3\left(C_{\text {pump}}\right)=478.05 \frac{I D R}{\mathrm{~m}^2}$, then Total Cost of Production $\left(C_{p u m p}\right)$ calculates as follow:
$\begin{aligned} C_{\text {total }}=\mathrm{BCP} & +C_{\text {pump }}=883,6 \frac{\mathrm{IDR}}{\mathrm{m}^3}+478.05 \frac{\mathrm{IDR}}{\mathrm{m}^3} =1,361.05 \frac{\mathrm{IDR}}{\mathrm{m}^3}\end{aligned}$
This analysis highlights the financial burden imposed by hydraulic escalation, emphasizing the need for energy-efficient solutions, such as optimized pipeline design, advanced pumping technology, and alternative energy sources. A strategic approach to infrastructure planning is essential to balance cost-effectiveness and sustainability, ensuring a reliable and affordable water supply for IKN Nusantara.
Pumping costs alone add IDR 478.05 per cubic meter, increasing the total production cost to IDR 1,361.05 per cubic meter. Total cost of water production for IKN Nusantara is IDR 1,361.05 per cubic meter, where 35% of the cost is attributed to pumping due to the high hydraulic gradient. The high hydraulic gradient requires substantial energy for water transport, directly influencing operational expenses. For water utility management, the only option is to increase the tariff by at least 35% above IDR 4,827 per cubic meter is IDR 6,516.45 per cubic meter.
In this section, the findings of the study are analyzed, interpreted (in Section 4.1 and Section 4.2), and compared with other relevant research (Section 4.3). in Section 4.3, the key results are discussed in terms of their implications for water supply management in IKN Nusantara. The challenges presented by hydraulic gradients are explored, with a focus on how these factors impact the economic feasibility and sustainability of the water supply system. Additionally, this section addresses strategies to optimize hydraulic design and reduce the production costs, drawing on both the study's findings and other similar research. This evaluation provides insights for policymakers and stakeholders as they plan the future water infrastructure for the new capital.
4.1 Interpretation of the results
The study found that the significant elevation difference in the IKN Nusantara region necessitates substantial power for continuous pumping, leading to elevated production costs. This high hydraulic gradient requires increased energy to overcome the elevation difference, resulting in an additional cost of IDR 478.05 per cubic meter. This additional cost underscores the financial challenges in providing a sustainable water supply in the new capital. Without addressing these challenges, the cost burden could be significant, impacting the affordability and accessibility of water for residents.
This elevation difference directly impacts the hydraulic gradient, necessitating increased energy consumption and infrastructure investment to maintain adequate water pressure and flow rates. Consequently, these factors drive up the overall cost of production, making it imperative to explore cost-effective and energy-efficient solutions for water supply management in the new capital. The high energy costs associated with pumping water to higher elevations can strain financial resources, necessitating careful planning and optimization of the water supply system.
Furthermore, the high production costs highlight the need for innovative solutions to reduce energy consumption and improve system efficiency. Implementing advanced pumping technologies and optimizing pipeline design can help mitigate some of these costs. The use of energy-efficient pumps and materials that reduce friction losses can significantly impact the overall cost of production. Additionally, exploring alternative energy sources, such as solar or wind power, could provide sustainable and cost-effective solutions for continuous pumping operations.
4.2 Comparison with other studies
These findings are consistent with previous studies on the impact of hydraulic gradients on water supply costs [47]. Research has shown that significant elevation differences lead to increased operational costs due to the need for more robust pumping systems and higher energy consumption and substantial financial burden imposed by high hydraulic gradients in water supply systems, reinforcing the need for strategic planning and resource management.
The similarity between this study's results and those of previous research highlights the universal challenge posed by elevation differences in water supply systems. Both studies underscore the importance of addressing hydraulic gradients to manage costs effectively. This alignment with existing literature reinforces the validity of the current study's findings and underscores the importance of addressing these challenges in the planning and implementation of water supply systems.
Additionally, high production costs could deter the economic feasibility of water supply projects. This finding aligns with the current study's results, which indicate that without efficient management, the high costs associated with hydraulic gradients could hinder the sustainability of the water supply system in IKN Nusantara. The alignment with previous studies suggests that the challenges identified in this study are not unique to IKN Nusantara but are common in regions with significant elevation differences.
Moreover, previous studies have suggested various mitigation strategies that can be applied to reduce the impact of hydraulic gradients on production costs. These include the use of gravity-fed systems where possible, optimizing pump operation schedules to reduce energy consumption, and incorporating renewable energy sources. Implementing such strategies in IKN Nusantara could help mitigate the high costs identified in this study and improve the overall sustainability of the water supply system.
4.3 In-depth analysis
The results underscore the importance of optimizing the hydraulic design to mitigate the negative impacts of elevation differences on production costs. Implementing advanced pumping technologies, enhancing pipeline materials, and adopting energy-efficient practices can help reduce operational expenses. For instance, the use of variable frequency drives (VFDs) [48] on pumps can optimize energy consumption by adjusting pump speed based on demand, thereby reducing energy costs.
Enhancing pipeline materials can also play a significant role in reducing friction losses [49] and improving overall system efficiency. Materials such as high-density polyethylene (HDPE) or ductile iron, which have lower friction coefficients, can help minimize energy losses during water transmission. Additionally, properly sizing pipelines to match the flow rates can prevent unnecessary pressure losses [50] and improve the efficiency of the water supply system [51].
Adopting energy-efficient practices involves not only using efficient equipment but also optimizing operational schedules. By strategically operating pumps during off-peak hours when energy costs are lower, it is possible to reduce overall energy expenses [52]. Additionally, regular maintenance and timely upgrades of pumping equipment can ensure that the system operates at peak efficiency, preventing energy wastage and reducing costs.
Furthermore, integrating renewable energy sources, such as solar or wind power, for pumping operations could provide long-term cost savings and environmental benefits. Solar-powered pumps, for example, can be particularly effective in reducing reliance on grid electricity and lowering operational costs. The use of renewable energy also aligns with sustainable development goals, contributing to a greener and more resilient water supply system.
Given the projected population growth and increased water demand in Nusantara, it is crucial to develop a comprehensive water management strategy that balances cost efficiency and sustainability [53]. This strategy should include regular maintenance of infrastructure, investment in modern technologies, and continuous monitoring of system performance to ensure reliable and affordable water supply for the residents of the new capital. By focusing on both immediate and long-term solutions, it is possible to address the challenges posed by the high hydraulic gradient and ensure a sustainable water supply system for IKN Nusantara.
4.4 Mitigation strategies for water hammer
One of the primary concerns in managing water hammer is the selection of appropriate mitigation techniques that align with the specific characteristics of the fluid system. Various factors, including pipeline material, flow velocity, pressure fluctuations, and system configuration, play a crucial role in determining the effectiveness of mitigation strategies [54]. The goal is to minimize sudden pressure surges while maintaining system efficiency and longevity. Among the widely adopted methods, surge tanks, air chambers, and pressure relief valves are commonly utilized to absorb excess pressure and prevent structural damage. The following sections will explore these strategies in detail, starting with the use of surge tanks as an effective solution for controlling transient pressure waves in fluid systems.
4.4.1 Surge tanks
Surge tanks are vertical vessels placed along the pipeline to absorb sudden pressure increases (surge pressures) caused by rapid changes in flow velocity [54]. When there is a water hammer event (e.g., sudden valve closure), the surge tank temporarily absorbs the excess energy, preventing the pressure spike from reaching damaging levels.
Surge tanks can be designed as either open or closed. In an open surge tank, the top is open to the atmosphere, and air is allowed to enter or exit freely, adjusting to pressure changes. In a closed surge tank, the tank is sealed and has a pressure relief valve to release excess pressure when necessary. The size and location of surge tanks depend on the pipeline characteristics and the expected surge pressures.
Surge tanks help in reducing the magnitude of the pressure surge, allowing for smoother transitions in pressure within the pipeline. This protection prevents the pipeline from experiencing damaging overpressures, reducing the risk of pipe bursts and system failures.
4.4.2 Slow-closing valves
Slow-closing valves are designed to close gradually rather than rapidly, which helps prevent the rapid deceleration of water in the pipeline [55]. By slowing the closing process, these valves reduce the pressure spike associated with the water hammer effect.
Slow-closing valves are often fitted with adjustable mechanisms that control the closing speed. This can be accomplished by using hydraulic or pneumatic control systems, which ensure that the valve closes at a controlled rate. Additionally, these valves are often installed in critical points of a pipeline, such as at pump stations or system junctions, to manage flow changes.
These valves provide a controlled approach to managing flow changes, which can significantly reduce the likelihood and severity of water hammer. By preventing sudden stops or starts in flow, slow-closing valves reduce the potential for damage to pipelines and associated infrastructure.
4.4.3 Air chambers or air vessels
Air chambers or vessels act as shock absorbers in the pipeline [56]. They are typically installed at high points in the system or at locations where the flow velocity may change abruptly. Air in the chamber absorbs the shock from pressure surges by compressing when a surge pressure occurs and slowly releasing the pressure as the system stabilizes.
These chambers are designed to trap air and allow it to expand or contract in response to pressure changes. They are commonly used in conjunction with surge tanks to provide additional support in high-risk areas of the water distribution system.
The primary advantage of air chambers is their ability to quickly absorb energy from a surge, reducing the immediate impact on the system. They are especially useful in smaller or less complex systems where full-scale surge tanks may not be feasible.
4.4.4 Water hammer arrestors
Water hammer arrestors are devices installed in pipelines that act as a buffer between sections of the system that may experience water hammer [57]. They work by allowing water to enter an internal chamber, which has either a spring or air cushion, to absorb the shock from pressure waves.
Water hammer arrestors are typically installed near valves or pumps where rapid changes in velocity are likely to occur. They are designed to function automatically when a surge occurs and to provide a quick response to the pressure change.
These devices are cost-effective and easy to install in pipelines, especially in areas with intermittent or minor water hammer issues. They are particularly useful for addressing localized pressure spikes caused by rapid valve closure or pump shutdown.
4.4.5 Pipeline sizing and material selection
Proper pipeline design, including adequate sizing and material selection, can help mitigate water hammer by ensuring that the pipeline can handle expected pressure surges without excessive deformation [58]. Using materials with high strength, such as ductile iron or steel, and choosing larger diameter pipes can reduce the likelihood of water hammer.
The diameter of the pipeline should be selected based on flow requirements and expected pressure conditions. Larger pipes have lower velocity and can reduce the impact of sudden flow changes. Additionally, the use of flexible or durable materials can improve the pipeline’s ability to absorb pressure surges.
Proper sizing and material selection help to ensure that the pipeline system can withstand normal operating conditions and occasional water hammer events. It also reduces the need for excessive mitigation measures in the system.
4.5 Comparison with other projects facing hydraulic gradient challenges
This comparison section helps provide a broader understanding of the challenges associated with hydraulic gradients and presents potential solutions that have been successfully implemented in other urban projects. Perhaps strengthen the argument by demonstrating the universal nature of the issue and offering practical approaches that could benefit IKN Nusantara.
4.5.1 Amman, Jordan
Amman, the capital of Jordan, is situated approximately 1,000 meters above sea level, while its primary water sources are located at much lower elevations [59]. This significant elevation difference necessitates the use of extensive pumping systems to transport water uphill, leading to high energy consumption and operational costs.
The water supply infrastructure in Amman includes the Disi Water Conveyance Project, which extracts water from the fossil Disi aquifer located 325 km south of Amman. This project involves pumping water over a height difference of 1,200 meters to reach the city, highlighting the challenges associated with managing hydraulic gradients in urban water supply systems.
4.5.2 Metro West Water Supply Tunnel, Boston, USA
The Metro West Water Supply Tunnel is an advanced underground aqueduct designed to supply potable water to residents of much of Greater Boston [60]. The tunnel traverses’ areas with varying topography, requiring careful management of hydraulic gradients to ensure efficient water distribution.
The tunnel starts at the John J. Carroll Water Treatment Plant in Marlborough and ends at an MWRA terminal in Weston, Massachusetts. It is about 17.6 miles (28.3 km) long and constructed mostly in bedrock, with several vertical shafts used to make connections throughout the system. The design considerations for managing hydraulic gradients in this tunnel are detailed in its construction and operational reports.
4.5.3 Qanat systems in Iran
Qanats are traditional underground aqueducts developed in ancient Iran to transport water from aquifers in highland areas to arid regions [61]. The construction of qanats involves managing significant elevation differences to ensure a steady flow of water over long distances without the need for pumping.
Qanats are constructed as a series of well-like vertical shafts connected by a gently sloping tunnel, allowing water to drain by gravity from an upland aquifer to a lower elevation. This system efficiently delivers large amounts of subterranean water to the surface without the need for pumping, effectively managing hydraulic gradients in arid regions.
4.6 Policy implications and strategic management
The study's findings have significant policy implications for the planning and management of water supply systems in IKN Nusantara. Policymakers need to consider the impact of hydraulic gradients on production costs when designing and implementing water infrastructure projects. By incorporating the study's recommendations, such as optimizing hydraulic design and adopting energy-efficient practices, policymakers can develop strategies that enhance the sustainability and affordability of water supply systems.
Strategic management of water resources involves not only technical solutions but also effective governance and stakeholder engagement [62]. Engaging local communities, water utilities [46], and government agencies in the planning process can ensure that the water supply system meets the needs of all stakeholders. Transparent communication and collaborative decision-making can foster a sense of ownership and responsibility among stakeholders, leading to more effective and sustainable water management practices.
Furthermore, policymakers should prioritize investments in modern technologies and infrastructure upgrades to enhance the efficiency and resilience of the water supply system [63]. Funding for research and development of innovative solutions, such as smart water management systems and advanced treatment technologies, can drive continuous improvement and adaptation to changing conditions. Policies that incentivize the adoption of renewable energy and energy-efficient technologies can also support the transition to a more sustainable water supply system.
Regulatory frameworks should be established to ensure that water utilities operate within defined efficiency and sustainability standards [64]. These frameworks can include performance benchmarks, regular audits, and accountability mechanisms to monitor and evaluate the performance of water utilities. By setting clear standards and expectations, regulators can drive improvements in operational efficiency and cost management, ultimately benefiting consumers and the environment.
After evaluating the hydraulic design and production costs for the water supply system in IKN Nusantara, the study has provided valuable insights into the impact of hydraulic gradients and pumping requirements on system efficiency and cost. The findings underscore the importance of addressing these factors for a sustainable and cost-effective water supply. In this section, we will summarize the key findings of the study and discuss their implications for the future development of water infrastructure in the new capital. Additionally, recommendations for improving energy efficiency and reducing operational costs will be presented
5.1 Impact of hydraulic gradient and pumping requirements on production costs
The study confirms that the 126-meter elevation difference in IKN Nusantara significantly increases production costs due to higher energy consumption for pumping. The key findings include:
High Energy Demand: The daily power requirement for pumping is 11,115 kWh/day, leading to an annual energy cost of IDR 4.52 billion (USD 284,000).
Pumping Costs: The additional pumping cost is IDR 478.05 per cubic meter, making up 35% of total production costs.
Total Cost of Production: When including variable costs and overhead, the final production cost is IDR 1,361.05 per cubic meter.
These findings illustrate that hydraulic escalation directly increases production costs, requiring efficient energy use and financial adjustments to maintain feasibility. Particularly regarding the high production costs due to the hydraulic gradient and other technical challenges in IKN Nusantara, underscore the need for a comprehensive policy and financing strategy. While tariff increases provide one avenue for managing the costs, they may not be sufficient to ensure the affordability of water services for all residents, especially in the early phases of the capital's development. Thus, exploring alternative financing mechanisms becomes crucial. Alternative Financing Mechanisms as follow:
5.1.1 Government subsidies
Role in Reducing Consumer Costs: Government subsidies can be a critical tool in ensuring that the water tariffs remain affordable for residents, particularly during the initial stages of development [65]. By covering a portion of the water production and distribution costs, subsidies can buffer the economic strain on consumers while allowing the water supply system to remain financially viable.
Targeted Support: Subsidies could be targeted at low-income households, ensuring equitable access to water. This approach would align with broader social goals of inclusivity and affordability.
5.1.2 Private sector investments
Public-Private Partnerships (PPP): Engaging the private sector through public-private partnerships (PPP) can attract investment in water infrastructure, alleviating the financial burden on public finances. Private sector involvement can bring in efficiency, innovation, and additional capital to finance projects such as advanced pumping technologies or infrastructure upgrades.
Incentives for Investment: To attract private investors, the government can offer financial incentives, such as tax breaks or guaranteed returns on investment for water supply projects. This will encourage private capital flow into public infrastructure, ensuring long-term sustainability.
5.1.3 International funding
Development Banks and NGOs: The government could also seek funding from international development banks (e.g., World Bank) or non-governmental organizations (NGOs) focused on sustainable infrastructure. These sources of capital often offer favorable interest rates or grants for projects aimed at achieving the Sustainable Development Goals (SDGs).
Green Bonds: Given the growing interest in environmental sustainability, issuing green bonds could be an innovative way to raise funds for water infrastructure projects that meet environmental and energy efficiency standards.
5.1.4 Strategic financial management
The study's findings suggest that innovative financial strategies [66], such as combining tariff increases with subsidies or external investments, can create a balanced funding model for IKN Nusantara's water infrastructure. This combined approach could help reduce the financial strain on both residents and the government while ensuring long-term sustainability for water supply management.
5.2 Economic feasibility and tariff adjustments
The economic feasibility of the water supply system depends on the ability to cover operational costs while maintaining affordability. The study finds that:
Current Base Tariff (IDR 4,827/m³) is Insufficient: Given the high pumping costs, maintaining the existing tariff would lead to financial losses for the utility.
Tariff Increase Required: To offset additional costs, a minimum tariff increase of 35% is necessary, raising the tariff to IDR 6,517/m³.
Potential Financial Risks: If these costs are not managed, financial sustainability is at risk, potentially requiring government subsidies or alternative funding mechanisms.
Thus, tariff restructuring is crucial to ensure economic viability while maintaining equitable access.
5.3 Strategies for cost optimization and long-term sustainability
To address the economic burden of high hydraulic gradients, a combination of technical and financial strategies is required:
Technical Strategies:
Gravity-Based Distribution Optimization by Utilizing gravity-fed systems where possible to reduce dependence on energy-intensive pumping.
Energy-Efficient Pumping Systems by Implementing variable-speed pumps to optimize energy consumption and upgrading to high-efficiency motors to reduce operational costs.
Pipeline Optimization by Reducing friction losses through optimized pipe materials and diameter selection and Implementing pressure zoning to enhance energy efficiency.
Renewable Energy Integration by using solar or wind power to offset electricity costs for pumping stations.
The study confirms that the high hydraulic gradient in IKN Nusantara significantly increases water production costs, requiring tariff adjustments and optimized infrastructure. To ensure long-term sustainability, a combination of energy-efficient pumping, pipeline optimization, and financial restructuring is needed. Implementing these strategies will reduce costs, enhance system resilience, and provide a sustainable water supply for IKN Nusantara.
The findings of this study highlight the critical challenges posed by the high hydraulic gradient in the water distribution system of IKN Nusantara. The significant elevation differences (126 meters) necessitate high energy consumption for pumping, leading to increased operational costs and economic feasibility concerns. Without strategic interventions, the financial sustainability of the water supply system could be at risk.
This section provides recommendations and policy implications to address the identified challenges. The focus is on technical solutions, financial strategies, and governance mechanisms to optimize cost efficiency while ensuring long-term sustainability. These recommendations aim to guide decision-makers, policymakers, and water utilities in designing a resilient, efficient, and financially viable water supply system for Indonesia’s new capital.
The following analysis answers the research question by examining how hydraulic escalation affects production costs and economic feasibility, while outlining strategies to mitigate these challenges.
The study was funded by RIIM-3 2023 LPDP, Indonesia (Indonesia Endowment Fund for Education) for financing the research, and BRIN, Indonesia (Badan Riset and Innovation National, Indonesia) for providing office and discussion.
[1] Pérez-Vidal, A., Escobar-Rivera, J.C., Torres-Lozada, P. (2020). Development and implementation of a water-safety plan for drinking-water supply system of Cali, Colombia. International Journal of Hygiene and Environmental Health, 224: 113422. https://doi.org/10.1016/j.ijheh.2019.113422
[2] Zhang, Y., Deng, J., Qin, B., Zhu, G., Zhang, Y., Jeppesen, E., Tong, Y. (2023). Importance and vulnerability of lakes and reservoirs supporting drinking water in China. Fundamental Research, 3(2): 265-273. https://doi.org/10.1016/j.fmre.2022.01.035
[3] Rautu, R.S., Racoviteanu, G., Dinet, E. (2017). Use of benchmarking for the improvement of the operation of the drinking water supply systems. Procedia Engineering, 209: 180-187. https://doi.org/10.1016/j.proeng.2017.11.145
[4] Tan, L., Yang, G., Zhu, Q., Wan, R., Shi, K. (2023). Optimizing payment for ecosystem services in a drinking water source watershed by quantifying the supply and demand of soil retention service. Journal of Environmental Management, 331: 117303. https://doi.org/10.1016/j.jenvman.2023.117303
[5] Wang, C., Ran, Q., Wu, Y.S. (2019). Robust implementations of the 3D-EDFM algorithm for reservoir simulation with complicated hydraulic fractures. Journal of Petroleum Science and Engineering, 181: 106229. https://doi.org/10.1016/j.petrol.2019.106229
[6] Sarkar, S., Nag, A.K., Kumar, R. (2023). An overview of small-scale hydropower and its recent development. Renewable Energy Production and Distribution, 2: 249-314. https://doi.org/10.1016/B978-0-443-18439-0.00009-4
[7] Dias, R., Daam, M.A., Diniz, M., Mauricio, R. (2023). Drinking water treatment residuals, a low-cost and environmentally friendly adsorbent for the removal of hormones-A review. Journal of Water Process Engineering, 56: 104322. https://doi.org/10.1016/j.jwpe.2023.104322
[8] Dadebo, D., Obura, D., Kimera, D. (2023). Hydraulic modeling and prediction of performance for a drinking water supply system towards the achievement of sustainable development goals (SDGs): A system case study from Uganda. Groundwater for Sustainable Development, 22: 100951. https://doi.org/10.1016/j.gsd.2023.100951
[9] Said, N.I., Hernaningsih, T., Sudinda, T.W., Yudo, S., Widayat, W., Plamonia, N., Santoso, A.D., Setiyono, Wahyono, H.D., Rifai, A., Setiadi, I., Sulaeman, O. (2024). Forecasting and sustainability of raw water supply for Indonesia’s new capital. International Journal of Sustainable Development and Planning, 19(1): 197-207. https://doi.org/10.18280/ijsdp.190118
[10] Ekwueme, B.N., Ibeje, A.O. (2023). Comparison of monte Carlo schemes in the modeling of extreme flood in tropical rain forest basins. Hydraulic Engineering, 27(12): 175-5189. https://doi.org/10.1007/s12205-023-0980-5
[11] Schleiss, A.J., Franca, M.J., Juez, C., De Cesare, G. (2016). Reservoir sedimentation. Journal of Hydraulic Research, 54(6): 595-614. https://doi.org/10.1080/00221686.2016.1225320
[12] Bulqis Muzakar, F. (2022). Green infrastructure intervention to improve waste and water system in urban areas. Smart City, 3(1): 5. http://doi.org/10.56940/sc.v3.i1.5
[13] Persson, I.M.L. (2009). Designing a sustainable system for water supply and sanitation in rural Peru. Diseño de Un Sistema Sostenible de Agua Potable y Saneamiento En Zonas Rurales de Peru, January.
[14] Hao, L., Sun, G., Liu, Y., Qian, H. (2015). Integrated modeling of water supply and demand under management options and climate change scenarios in Chifeng city, China. Journal of the American Water Resources Association, 51(3): 655-671. https://doi.org/10.1111/1752-1688.12311
[15] Tarigan, S., Tukayo, R. (2013). Impact of land use change and land management on irrigation water supply in northern Java coast. Jurnal TANAH TROPIKA (Journal of Tropical Soils), 18(2): 169-176-176. https://doi.org/10.5400/jts.2013.18.2.169
[16] Wang, Q., Ding, W., Wang, Y. (2018). Optimization of multi-reservoir operating rules for a water supply system. Water Resources Management, 32(14): 4543-4559. https://doi.org/10.1007/s11269-018-2063-9
[17] Spencer, K.L., Deere, N.J., Aini, M., Avriandy, R., et al. (2023). Implications of large-scale infrastructure development for biodiversity in Indonesian Borneo. Science of the Total Environment, 866: 161075. https://doi.org/10.1016/j.scitotenv.2022.161075
[18] Bruns, B., Bandaragoda, D.J., Samad, M., Bandaragoda, J.D. (2001). Integrated water-resources management in a river-basin context: Institutional strategies for improving the productivity of agricultural water management. In Proceedings of the Regional Workshop, Malang, Indonesia. http://ageconsearch.umn.edu/bitstream/118403/2/H030265.pdf.
[19] Dobriyal, P., Badola, R., Tuboi, C., Hussain, S.A. (2017). A review of methods for monitoring streamflow for sustainable water resource management. Applied Water Science, 7(6): 2617-2628. https://doi.org/10.1007/s13201-016-0488-y
[20] Mojarabi-Kermani, A., Shirangi, E., Bordbar, A., Kaman Bedast, A.A., Masjedi, A. (2019). Stochastic optimal reservoir operation management, applying group conflict resolution model. Water Resources Management, 33(8): 2847-2865. https://doi.org/10.1007/s11269-019-02271-2
[21] Zhang, X., Vesselinov, V.V. (2017). Integrated modeling approach for optimal management of water, energy and food security nexus. Advances in Water Resources, 101(505): 1-10. https://doi.org/10.1016/j.advwatres.2016.12.017
[22] Jalilov, S.M., Kefi, M., Kumar, P., Masago, Y., Mishra, B.K. (2018). Sustainable urban water management: Application for integrated assessment in Southeast Asia. Sustainability (Switzerland), 10(1): 122. https://doi.org/10.3390/su10010122
[23] Jundiani, Fadli, M., Qurbani, I.D., Kurniaty, R., Hulwanullah, H. (2024). Urban green space regulation: Challenges to water resources conservation in Indonesia and Australia. Journal of Human Rights, Culture and Legal System, 4(1): 169-193. https://doi.org/10.53955/jhcls.v4i1.128
[24] Luvizotto Junior, E., Rabah Felicetti Novarini, B. (2015). Study and analysis of water consumption patterns for demand forecasting of the urban water supply system. Anais Do Congresso de Iniciação Científica Da Unicamp, XXIII(Ic): 37072. https://doi.org/10.19146/pibic-2015-37072
[25] Sakellari, I., Makropoulos, C., Butler, D., Memon, F.A. (2005). Modelling sustainable urban water management options. Proceedings of the Institution of Civil Engineers: Engineering Sustainability, 158(3): 143-153. https://doi.org/10.1680/ensu.2005.158.3.143
[26] Plamonia, N., Anjani, R., Amru, K., Sudaryanto, A. (2024). Exploring effective institutional models for piped drinking water management: a comparative study of Jakarta and Kuala Lumpur and proposal of a new model for Indonesia’s new capital city. Water Practice and Technology, 19(12): 4734-4753. https://doi.org/10.2166/wpt.2024.291
[27] Dewa, R.P., Aryantie, M.H., Amru, K., Anjani, R., Plamonia, N. (2025). Analysis of the quality of raw water sources to meet drinking water needs in the capital city of the archipelago. Jurnal Teknologi Lingkungan, 26(1): 082-089. https://ejournal.brin.go.id/JTL/article/view/4037.
[28] Rahman, H.Z., Juniati, A.T., Miraj, P., Zuna, H.T., Plamonia, N. (2024). Evaluating consumer insights in water services: Perspectives on health benefits, pricing tolerance, and continuous service demand. Water Practice & Technology, 19(4): 1135-1147. https://doi.org/10.2166/wpt.2024.064
[29] White, F.M., Majdalani, J. (2006). Viscous Fluid Flow (Vol. 3). McGraw-Hill New York.
[30] Furlani, E.P. (2016). Fluid mechanics for inkjet printing. In Fundamentals of Inkjet Printing: The Science of Inkjet and Droplets. pp. 13-56. http://doi.org/10.1002/9783527684724.ch2
[31] Suryanto, S., Apollo, A., Muhammad, J.H., Titiek, I. (2019). Analisis Perancangan Penstock PLTMH di Eremerasa Kabupaten Bantaeng Dengan Menggunakan ANSYS. Sinergi, 17(1): 16. http://doi.org/10.31963/sinergi.v17i1.1588
[32] Harvey, A. (1993). Micro Hydro Design Manual: A Guide to Small-Scale Water Power Schemes. Rugby, UK: Practical Action Publishing.
[33] Yang, F., Li, Z., Yuan, Y., Lin, Z., Zhou, G., Ji, Q. (2022). Study on vortex flow and pressure fluctuation in dustpan-shaped conduit of a low head axial-flow pump as turbine. Renewable Energy, 196: 856-869. https://doi.org/10.1016/j.renene.2022.07.024
[34] Tijsseling, A.S., Anderson, A. (2006). The Joukowsky Equation for Fluids and Solids. Technische Universiteit Eindhoven.
[35] Zhang, Y., Miao, M., Ma, J. (2010). Analytical study on water hammer pressure in pressurized conduits with a throttled surge chamber for slow closure. Water Science and Engineering, 3(2): 174-189. https://doi.org/https://doi.org/10.3882/j.issn.1674-2370.2010.02.006
[36] Gaiffe, M., Dross, C., Malembaka, E.B., Ross, I., Cumming, O., Gallandat, K. (2023). A fuzzy inference-based index for piped water supply service quality in a complex, low-income urban setting. Water Research, 243: 120316. https://doi.org/10.1016/j.watres.2023.120316
[37] Plamonia, N. (2020). Improving the coverage area of drinking water provision by using build operate and transfer investments in Indonesia. An institutional analysis. University of Twente. https://phddata.org/improving-the-coverage-area-of-drinking/.
[38] Hendri, E., Oktariansyah, Keren, K.H.H., (2023). Analisis perhitungan harga pokok produksi air sebagai dasar penetapan harga jual air pada PDAM Tirta Betuah Kabupaten Banyuasin. JAE (Jurnal Akuntansi dan Ekonomi) 8(1): 92-100. http://doi.org/10.29407/jae.v8i1.19612
[39] Alexander, K.V, Giddens, E.P. (2008). Optimum penstocks for low head microhydro schemes. Renewable Energy, 33(3): 507-519. https://doi.org/10.1016/j.renene.2007.01.009
[40] McGinnis, M.D. (2011). An introduction to IAD and the language of the Ostrom workshop: A simple guide to a complex framework. In Policy Studies Journal (Vol. 39, Issue 1). Wiley Periodicals, Inc.
[41] Ostrom, E. (2005). Understanding Institutional Diversity. Princeton University Press. https://doi.org/10.2307/j.ctt7s7wm
[42] Plamonia, N., Saputra, E.R.A., Said, N.I., Hernaningsih, T., Widayat, W., Hanif, M., Adi, P.D., Yohanitas, W.A., Niode, N., Dewa, R.P. (2024). Penstock pipe’s hydraulic design for the mini hydropower plant at Besai Kemu, Bukit Kemuning, Lampung, Indonesia. IOP Conference Series: Earth and Environmental Science, 1388(1): 012057. https://doi.org/10.1088/1755-1315/1388/1/012057
[43] Paraschiv, S., Paraschiv, L.S., Serban, A. (2023). An overview of energy intensity of drinking water production and wastewater treatment. Energy Reports, 9(11): 118-123. https://doi.org/10.1016/j.egyr.2023.08.074
[44] Kaunda, C.S., Kimambo, C.Z., Nielsen, T.K. (2014). A technical discussion on microhydropower technology and its turbines. Renewable and Sustainable Energy Reviews, 35: 445-459. https://doi.org/10.1016/j.rser.2014.04.035
[45] Shao, Y., Yao, F., Liu, J., Yu, T., Chu, S. (2023). Global energy and leakage optimization in water distribution systems from water treatment plants to customer taps. Resources, Conservation and Recycling, 194: 107003. https://doi.org/10.1016/j.resconrec.2023.107003
[46] Amru, K., Anjani, R., Plamonia, N., Dewa, R.P. (2025). Environmental carrying capacity study based on water availability and demand in the capital city of the archipelago. Jurnal Teknologi Lingkungan, 26(1): 75-81. https://ejournal.brin.go.id/JTL/article/view/4471.
[47] Dellinger, G., Simmons, S., Lubitz, W.D., Garambois, P.-A., Dellinger, N. (2019). Effect of slope and number of blades on Archimedes screw generator power output. Renewable Energy, 136: 896-908. https://doi.org/10.1016/j.renene.2019.01.060
[48] Bose, B.K. (1993). Variable frequency drives-technology and applications. In ISIE’93-Budapest: IEEE International Symposium on Industrial Electronics Conference Proceedings, Budapest, Hungary, pp. 1-18. https://doi.org/10.1109/ISIE.1993.268822
[49] Salman, H.S., Mansour, M.M., Lafta, A.M., Shkarah, A.J. (2024). Modification design and process of pipeline to reduce erosion rate and deposited. International Journal of Computational Methods and Experimental Measurements, 12(2): 165-173. https://doi.org/10.18280/ijcmem.120206
[50] Antaki, G.A. (2003). Piping and Pipeline Engineering: design, Construction, Maintenance, Integrity, and Repair. CRC Press.
[51] Vilanova, M.R.N., Balestieri, J.A.P. (2014). Energy and hydraulic efficiency in conventional water supply systems. Renewable and Sustainable Energy Reviews, 30: 701-714. https://doi.org/10.1016/j.rser.2013.11.024
[52] EPA, U. (2013). Strategies for saving energy at public water systems. https://www.epa.gov/sites/default/files/2015-04/documents/epa816f13004.pdf.
[53] Liu, G., Chen, L., Wang, W., Wang, M., Zhang, Y., Li, J., Lin, C., Xiong, J., Zhu, Q., Liu, Y. (2023). Balancing water quality impacts and cost-effectiveness for sustainable watershed management. Journal of Hydrology, 621: 129645. https://doi.org/10.1016/j.jhydrol.2023.129645
[54] Lahlou, Z.M. (2003). Water hammer. Tech Brief-National Drinking Water Clearing House.
[55] Toumi, A., Sekiou, F. (2024). Optimal valve closing law for improved water hammer control: A case from a water supply pipeline in Guelma, Algeria. AQUA—Water Infrastructure, Ecosystems and Society, 73(2): 200-216. http://doi.org/10.2166/aqua.2024.265
[56] Hayashi, D., Zylla, C., Amaro, E., Colin, P., Klause, T., Lopez, B., Williamson, D. (1991). The HAMMER: High altitude multiple mission environmental researcher. https://ntrs.nasa.gov/citations/19920012206.
[57] Cunefare, K., Ramsey, D., Pedigo, N., Toothman, M. (2019). Performance Demonstration of an In-Line Syntactic-Foam Water Hammer Arrestor. In INTER-NOISE and NOISE-CON Congress and Conference Proceedings, 260(1): 622-632.
[58] Ghidaoui, M.S., Zhao, M., McInnis, D.A., Axworthy, D.H. (2005). A review of water hammer theory and practice. Applied Mechanics Reviews, 58(1): 49-76. https://hydraulics.unibs.it/hydraulics/wp-content/uploads/2012/04/A_review_of_water_hammer_theory_and_practice.pdf.
[59] Dababneh, S. (2014). Comment on “high naturally occurring radioactivity in fossil groundwater from the middle east.” Environmental Science & Technology, 48(16): 9943-9945. https://pubs.acs.org/doi/pdf/10.1021/es5005736.
[60] Taylor, D.I. (2016). Boston harbor water quality. Massachusetts Water Resources Authority. https://www.mwra.com/media/file/boston-harbor-wq-1994-2015-2016-08.
[61] Mostafaeipour, A. (2010). Historical background, productivity and technical issues of qanats. Water History, 2: 61-80. http://doi.org/10.1007/s12685-010-0018-z
[62] Adom, R.K., Simatele, M.D. (2022). The role of stakeholder engagement in sustainable water resource management in South Africa. Natural Resources Forum, 46(5): 410-427. http://doi.org/10.1111/1477-8947.12264
[63] Minsker, B., Baldwin, L., Crittenden, J., Kabbes, K., Karamouz, M., Lansey, K., Malinowski, P., Nzewi, E., Pandit, A., Parker, J. (2015). Progress and recommendations for advancing performance-based sustainable and resilient infrastructure design. Journal of Water Resources Planning and Management, 141(12): A4015006. https://doi.org/10.1061/(ASCE)WR.1943-5452.0000521
[64] Jarvis, D.S.L., Sovacool, B.K. (2011). Conceptualizing and evaluating best practices in electricity and water regulatory governance. Energy, 36(7): 4340-4352. https://doi.org/10.1016/j.energy.2011.04.007
[65] Ma, W., Li, X. (2023). Impact of government subsidy on the optimal strategies of improving water use efficiency for a high-water-consumption manufacturer. Kybernetes, 52(6): 2092-2117. https://doi.org/10.1108/K-09-2021-0805
[66] Niwagaba, A. (2016). Operations management and performance of national water and sewerage corporation. Faculty of Business Administration and Management, Uganda Martyrs University. http://dissertations.umu.ac.ug/xmlui/handle/123456789/856.