Nakije Kida![]() | Remzi Smajli*
| Remzi Smajli*![]() | Medain Hashani
| Medain Hashani![]() | Vesa Morina
| Vesa Morina![]() | Julinda Morina
| Julinda Morina![]() | Florije Miftari
| Florije Miftari![]()
© 2025 The authors. This article is published by IIETA and is licensed under the CC BY 4.0 license (http://creativecommons.org/licenses/by/4.0/).
OPEN ACCESS
This study examines the impact of imports, exports, and final consumption on GDP growth in Kosovo, utilizing the Cobb-Douglas model transformed into an empirical OLS model. Data from 2007-2023, sourced from the World Bank in USD, were processed using SPSS 25, with validation conducted through Granger Causality, Two-Sample KS, Breusch-Pagan, PCA, and KS tests. Using the theoretical Cobb-Douglas model and both empirical model MLR and 2SLS models. Result/The MLR model shows a moderate impact of the independent variables on GDP, with an R value of 52.2%. However, the R² value of 27.2% indicates that only a small portion of GDP variation is explained by imports (IMP), final consumption (FCE), and exports (EXP), suggesting the influence of other factors. While imports positively affect GDP, final consumption and exports have a negative contribution. The model concludes that 29% of GDP growth is explained by the variables, with 71% explained by other unconsidered factors. The 2SLS model with time lags reveals that imports have the most significant impact on GDP (16.9% per 1% increase), highlighting Kosovo’s dependency on imports. Exports have a minor effect on GDP growth (1.9%), while final consumption has the largest impact (70.3% per 1% increase), indicating the economy's reliance on domestic demand. Spearman's correlation shows a weak relationship between GDP and final consumption (r = 0.310; p = 0.002), a strong relationship between GDP and imports (r = 0.583; p = 0.000), and no significant relationship between GDP and exports (r = 0.055; p = 0.589). Kosovo should invest in improving export conditions and diversifying international markets, stimulate domestic demand through tax reductions and policies that encourage consumption and investment in strategic sectors, particularly in technology and services, to diversify the economy and reduce dependence on imports. The originality of this study lies in its use of advanced models, such as MLR and 2SLS with time lags, to analyze the impact of imports, final consumption, and exports on GDP growth in Kosovo, providing a clear and in-depth understanding of the economic dynamics.
GDP growth rate, imports, exports, consumption, MLR and 2SLS model, Pearson rho
This study examines the economic factors influencing GDP growth in Kosovo, focusing on the impact of imports, exports, and final consumption. The primary issue is the lack of a comprehensive understanding of how these economic variables affect GDP growth. The research aims to fill this gap by empirically assessing whether these variables significantly contribute to economic growth and whether there is a statistical relationship between them. The goal is to provide valuable insights for policies and the improvement of Kosovo’s economic structure to support sustainable growth. Kosovo's economy has demonstrated accelerated growth in recent years, with real GDP expanding by 3.3% in 2023 and reaching 4.9% in the first half of 2024. This expansion was largely driven by the services sector, particularly trade and tourism linked to the diaspora. In contrast, industry and construction made smaller contributions to overall growth. However, discrepancies in sectoral value-added data raise concerns about the accuracy and reliability of economic indicators [1]. From a demand perspective, economic growth was supported by a recovery in private consumption, which benefited from declining inflation, rising wages, social transfers, and increased fixed investments. Despite these positive developments, net exports negatively impacted growth as imports of goods and services outpaced exports. This imbalance led to an expansion of the current account deficit by €150 million, reaching approximately 7% of GDP in the first half of 2024. Meanwhile, Foreign Direct Investment (FDI) continued its upward trajectory, accounting for 15% of GDP [2]. The fiscal balance for 2023 exceeded expectations, creating fiscal space for more expansionary policies in 2024. Inflation, which peaked at 14.2% in July 2022, saw a significant decline to 0.4% in October 2024 and further stabilized at 1.1% in December 2024. Data from the first three quarters of 2024 indicate that the government maintained fiscal discipline, with public revenues increasing to 31% of GDP in 2024 from 29% in 2023. Simultaneously, government expenditures were controlled, ensuring that the budget deficit remained moderate, between 0.5% and 1% of GDP [2]. Exports of goods and services experienced notable growth in 2024, driven by increased demand for Kosovo’s products from the EU and neighboring countries, alongside an expansion in domestic production. The first nine months of 2024 recorded a 3.4% increase in domestic production compared to the previous year. Despite these improvements, the current account deficit widened due to the faster growth of imports. Furthermore, unemployment remained above 10%, even as it showed a downward trend. In October 2024, the minimum monthly wage in Kosovo was doubled to €350; however, it remains among the lowest in the EU and the region [2]. The economy continues to be dominated by the services sector, which contributes 45.5% to GDP, while industry and agriculture account for 27.6% and 7.4%, respectively [3]. Employment patterns mirror this distribution, with the services sector employing 72% of the workforce, while industry and agriculture employ 23.9% and 4%, respectively [4]. Kosovo’s labor market has made notable progress, characterized by declining unemployment and an increase in formal employment. Between 2020 and 2022, the unemployment rate fell from 25.9% to 12.6%, with youth unemployment showing a particularly sharp decline from 49.8% in 2020 to 21.4% in 2022 [5]. Additionally, formal employment grew by 2.8%, and average wages increased by 11.7% during the same period [6]. Personal remittances have played a crucial role in supporting the economy, growing from 21.1% of GDP in 2009 and 14.8% in 2016 to 17.5% in 2023 [7]. Foreign exchange reserves also saw significant growth, reaching €1.19 billion in 2022 [8]. Kosovo's economy has demonstrated resilience and steady progress, with improvements in areas like fiscal management, foreign investment, and employment. However, challenges persist, particularly in balancing trade, reducing unemployment, and ensuring sustainable wage growth. Addressing these issues is vital for maintaining economic stability and fostering long-term prosperity. This analysis examines the influence of exports, imports, and final consumption on Kosovo's GDP growth, drawing on classical, neoclassical, and Keynesian economic theories. Exports boost production and external demand, imports offer access to foreign goods, and final consumption, driven by household spending, represents domestic demand. However, the relationship between these factors and GDP growth is multifaceted. Economic theories emphasize various facets of the trade-growth relationship. Helpman and Krugman [9] argue that exports enhance global competitiveness, while Stiglitz [10] emphasizes the importance of final consumption in maintaining economic stability, facilitated by well-managed investments and policies. Ricardo [11] highlighted trade’s role in growth, with nations leveraging comparative advantages, where the value of goods is tied to labor hours invested [12, 13]. Carbajal-De-Nova [14] further underscores the significance of export diversification, especially for developing nations. Furthermore, trade openness boosts productivity and innovation, key drivers of economic growth. Studies show that trade liberalization increases industry productivity and improves resource allocation [15, 16]. Lower tariffs and reduced input costs improve competitive advantages [17], while agreements like the Canada-US FTA have led to productivity growth in export sectors [18]. Studies show that trade liberalization and openness can reduce long-term unemployment [19]. Additionally, trade liberalization lowers prices and increases product variety, improving real household incomes [20]. This leads to reductions in poverty and inequality [21]. Trade can bring economic benefits, but the distribution of these benefits is uneven, causing losses and challenges for some industries and workers, and requiring support for their adjustment [22]. Empirical studies offer various insights on GDP growth. Akermi et al. [23] found no causal link between final consumption, exports, imports, and growth in Albania. Carrasco and Tovar-García [24] revealed that, while export diversification is insignificant, high-tech and capital goods imports positively impact growth. Mankiw et al. cited in the studies of Bernanke [25], Solow [26], and Swan [27] emphasize that long-term growth depends on capital accumulation, technological advancement, and human capital investment, which align with Kosovo’s need to improve trade policies to foster GDP growth. However, some critics argue that additional factors may affect growth [28], with consumption being one of the key elements. Using classical and neoclassical trade theories, along with the Cobb-Douglas model, we seek to examine how imports, exports, and final consumption contribute to GDP growth. Our focus is to understand whether exports significantly impact Kosovo's economic growth, while also analyzing the influence of domestic consumption and imports on capital accumulation. It is also essential to consider other factors, such as Kosovo's economic structure and development policies, which may influence future growth prospects. According to the Kosovo Agency of Statistics [29], exports have a limited impact, whereas imports and final consumption play a more substantial role. This highlights the need for further exploration using the Cobb-Douglas model [30] and empirical analysis via Ordinary Least Squares (OLS) to assess their historical effects on GDP growth and long-term potential. The research questions will guide the analysis, helping to test the study's hypotheses through empirical and statistical methods:
i) How do imports, exports, and final consumption impact the annual GDP growth in Kosovo?
ii) Is there a statistically significant and positive correlation between annual GDP growth and imports, exports, and final consumption in Kosovo?
The study employs a quantitative research methodology, utilizing secondary data spanning the last decade. The Ordinary Least Squares (OLS 1SLS) and used the two-stage least squares (2SLS) estimation method. Stage Least Squares (2SLS) models are used to assess the impact of imports, exports, and final consumption on GDP growth. Additionally, the Spearman’s rho correlation test and other statistical analyses are applied to evaluate the statistical relationship between these variables. The analysis is conducted using SPSS 25, ensuring the reliability and validity of results. Findings are compared with classical and neoclassical economic theories to derive policy recommendations for Kosovo’s long-term economic growth.
The paper is organized into five sections. The first section introduces the study. The second section presents a critical review of the literature on economic growth, consumption, and trade openness. The third section outlines the methodology used in the study. The fourth section presents the empirical findings from the econometric analysis, and the final section provides the conclusion and recommendations.
This chapter reviews the literature on trade, consumption, and GDP growth in Kosovo, analyzing the key factors influencing the country's economic development and its challenges in integrating into global markets. In the WIIW report for 2025, trade and consumption are key factors in GDP growth in Kosovo, where private consumption, driven by remittances, helps increase demand, but challenges such as high unemployment and dependence on imports negatively affect the trade balance and economic stability, while exports play an important role in economic growth, but difficulties related to underdeveloped infrastructure and lack of product diversification hinder this opportunity, while sectors such as agriculture and services offer further opportunities for trade development and economic growth [2]. Kosovo's economic progress can be analyzed through classical and neoclassical economic theories. Ricardo [11] argued that nations specialize in producing goods where they have a productivity advantage, leading to increased consumption and enhanced global welfare. While neoclassical theory emphasizes the effect of trade on wage inequality across sectors, newer theories focusing on strong heterogeneity examine its impact on wage distribution within sectors and occupations [31]. Heckscher and Ohlin [32] also analyzed trade, suggesting that countries tend to export goods that rely on abundant domestic factors of production, while importing goods that require relatively scarce resources. He emphasized the role of abundant factors, arguing that countries with more resources would export goods that require intensive use of these factors [33]. Krugman’s [34] new trade theory offers two main insights: first, trade depends on the similarity of countries' factor endowments, with countries becoming more similar engaging in intra-industry trade. Second, when intra-industry trade dominates, the benefits of market expansion will outweigh distributional effects, benefiting both scarce and abundant factor owners. Firms with different productivity levels coexist in an industry due to initial uncertainty about their productivity before making an irreversible investment. Entering the export market is costly, but the decision to export is made after firms gain knowledge about their productivity [35]. Empirical studies, such as those by Sachs and Warner [36], confirm a positive relationship between trade openness and economic growth, which includes increased productivity and the creation of new employment and consumption opportunities. Trade openness can stimulate economic growth by allowing countries to exploit comparative advantages and increase productivity through specialization [37]. Increased competition from trade can also drive innovation and improvements in government policies and institutions [38]. Firms can benefit from market expansion beyond national borders, leveraging economies of scale and increasing investment in research and development. For instance, the East Asian Tigers utilized exports to achieve rapid capital growth and improvements in capital-intensive industries during the 1970s and 1980s [39]. Empirical evidence supports the net benefits of trade, including productivity growth, innovation, and technological improvements through specialization and comparative advantages [40]. The data analysis shows that during the period from 1950 to 1998, countries that liberalized their trade regimes experienced average annual growth rates about 1.5 percentage points higher than before liberalization. Investment levels increased by 1.5-2.0 percentage points after liberalization, confirming that liberalization stimulates growth partly through its effect on physical capital accumulation. Additionally, liberalization raised the trade-to-GDP ratio by about 5 percentage points, indicating that trade policy liberalization effectively increased the level of openness in these countries [41]. Trade is a key driver of productivity and growth, and its impact depends on its relative importance in the overall economic activity [42]. However, some critics suggest that other factors may also influence growth [28], including consumption as a key factor. Based on classical and neoclassical trade theories and the Cobb-Douglas model, we can analyze the impact of imports, exports, and final consumption on GDP growth. In this context, we aim to determine whether the growth of exports has a significant impact on Kosovo's economic growth, while also examining the role of domestic consumption and imports in capital accumulation. However, it is important to also consider other factors, such as Kosovo's economic structure and its development policies, which could play a crucial role in future growth. Kosovo's economy, while showing progress in macroeconomic stability and GDP growth, faces challenges such as high unemployment 17.2% in 2023, trade imbalances, and dependence on remittances around 17% of GDP in 2023 [43], which require a strategic approach grounded in classical and neoclassical economic theories and the Cobb-Douglas model to address structural issues and unlock growth opportunities. Kosovo should focus on developing export-oriented sectors like agriculture, IT, and renewable energy, but challenges such as low labor productivity €10,542 per worker in 2023, and since 1 January 2024, holders of Kosovo passports enjoy visa-free travel to the EU [6] and limited industrial development (12% of GDP) hinder its competitiveness [44]. According to data from the Central Bank of Kosovo (2007-2024, September), around 7 billion euros have been brought to Kosovo. The countries that have invested the most in Kosovo are Germany (19.8%), Switzerland (9.9%), the United States (7.3%), Albania (6.6%), Austria (5.2%), the Netherlands (4.7%), Turkey (3.9%), France (3.7%), and Slovenia (3.6%), while other countries contribute 47.2% of the total foreign direct investment in Kosovo. Only in 2024, investments have been brought to Kosovo with the aim of improving infrastructure to ensure sustainable growth [45]. The Solow-Swan neoclassical growth model highlights that capital accumulation, labor force growth, and technological advancements are key drivers of GDP expansion, which is reflected in Kosovo's 4.5% GDP growth in early 2024 [46]. This growth, supported by remittances, consumption, investments, and credit expansion, shows the importance of these factors in fostering economic development. However, challenges such as limited production diversification and a 2.75% current account deficit in 2024 emphasize the need to improve domestic production and reduce reliance on imports [47-49]. The Cobb-Douglas Model (Factor Contribution) represents economic output as a function of capital (K) and labor (L), explaining their impact on GDP growth. The rise in private sector lending, which grew at 13.2% in 2023 [47], along with investments and consumption, demonstrates how capital and labor contribute to economic expansion. However, high unemployment, informality (which accounts for approximately 30% of the economy [50]), and slow productivity growth limit efficiency and prevent the economy from reaching its full potential. To improve Total Factor Productivity (TFP), Kosovo should focus on technological advancements, workforce skill development, and investment in high-value sectors. Economic sustainability can be achieved through well-structured economic policies that integrate comparative advantage, capital accumulation, and production efficiency. By addressing these structural issues and focusing on key sectors, Kosovo can achieve long-term growth and stability. Kosovo can benefit from classical and neoclassical economic theories to improve its development. According to Ricardo [11], countries should specialize in sectors where they have a comparative advantage, focusing on areas such as agriculture, information technology, and renewable energy [51, 52]. Ruffin [53] emphasizes the importance of integrating into global trade and utilizing the labor force and natural resources, while George Stigler connects competition and market efficiency to sustainable economic development [54]. Kuznets [55] suggests that development requires structural changes, shifting the economy from consumption and imports to production and exports [56]. Solow [56] highlights the role of capital, labor force, and technology for sustainable growth, and Romer [57] expands this by emphasizing the importance of innovation and knowledge. Stiglitz [10] stresses strengthening institutions and reducing inequalities for equitable development, while Keynes [58] advocates for government intervention to manage demand and avoid instability. Finally, Krugman [59] links economic development to scale and specialization in sectors where competitive advantages can be achieved. This combination of theories is essential for guiding Kosovo's economic development. For Kosovo, the most appropriate theories are those that emphasize comparative advantage, the importance of developing strategic sectors, and the need for structural reforms to transition from a consumption and import-based economy to one focused on production and exports. David Ricardo's Theory of Comparative Advantage is particularly relevant for Kosovo, as it offers a framework for identifying sectors where the country could have a competitive advantage, such as agriculture, information technology, and renewable energy. This focus could help boost exports and strengthen trade ties with other countries. Furthermore, the Solow-Swan neoclassical growth model and Romer's growth theory are also important, as they highlight the need for investment in capital, infrastructure, and technology to increase productivity and foster long-term growth. In this context, combining these theories could be beneficial for Kosovo, focusing efforts on increasing competition, diversifying production, and targeting sectors that can generate comparative advantages and promote export growth.
2.1 The impact of exports on GDP
The Exports are widely regarded as a key driver of economic growth, boosting production, creating jobs, and increasing national income. In Kosovo, however, exports have remained modest, contributing minimally to GDP growth. The country's mining, energy, and agriculture sectors, which could provide comparative advantages, remain underdeveloped, hindering its potential as an export-driven economy. A narrow export base, dominated by low-value-added goods, reflects Kosovo’s failure to fully utilize Smith’s concept of specialization and competitive advantage. Neoclassical trade theory highlights that exports increase demand for a country's products in international markets, driving GDP growth. Balassa [60] argued that exports optimize resource allocation, utilize economies of scale, and stimulate technological advancements in response to global competition. These processes also help address surplus labor and support employment growth. Feder [61] analyzed semi-industrialized countries from 1964 to 1973, showing that productivity is significantly higher in export sectors due to cross-sectoral externalities. He concluded that reallocating resources from less efficient sectors to export-oriented ones could enhance growth beyond traditional inputs like labor and capital. Trabelsi and Kachout [62] found that agricultural exports have a negative and insignificant impact on economic growth in both the short and long term. Other exports negatively and significantly impact growth, while imports positively influence long-term economic growth. These findings suggest the need to focus on promoting specific sectors to drive growth. Bakari et al. [63] analyzed Peru's economy and concluded that domestic investments, exports, and imports do not significantly affect economic growth in the short or long term. They attribute this to poor economic organization, indicating that trade openness and domestic investment are not primary growth drivers in the Peruvian context. In contrast, Bakari et al. [64] examined Brazil’s economy from 1970 to 2017 using VECM methodology. They found that in the short run, imports, exports, and domestic investment positively contribute to economic growth, demonstrating their causal role in Brazil's economic expansion. According to Ninka and Pere [65], the gravity model of exports for the Western Balkan region shows that exports are positively influenced by shared language, common borders with third countries, trade with the European Union, and trade with large, highly industrialized countries. However, factors like distance and the region's per capita GDP have a negative impact on exports.
These studies collectively highlight the varied effects of trade, investment, and exports across different economies, emphasizing the importance of tailored economic strategies for growth.
2.2 The impact of imports on GDP
Imports can have both positive and negative effects on GDP. While they meet consumption and production needs and can enhance technological efficiency, excessive imports leading to trade deficits can harm economic growth. Krugman [59] argued that East Asia's rapid growth between 1965-1990 was driven by innovation, contrasting it with the stagnation of the Soviet Union, suggesting that Asia's growth is not a model for the West. He also noted that countries relying heavily on consumer goods imports face slower long-term growth. Kim et al. [66] found that imports positively affect productivity growth, especially through competition and technology transfers from developed nations. They argued that import liberalization can promote growth in certain circumstances. In Kosovo, Vardari [67] observed that exports were crucial for economic growth but their impact became insignificant when imports were included in the model, highlighting the significant role of imported intermediate goods in driving growth. Trade plays a crucial role in economic growth by fostering job creation, reducing poverty, and expanding economic opportunities, especially in developing nations [68]. This dynamic is reflected in the Albanian experience over the past decade, where a positive correlation between trade volume growth and GDP highlights the crucial role of trade in fostering economic growth and development [69]. Despite these benefits, trade flows in the region remain largely shaped by traditional economic ties rather than new initiatives like Open Balkan, which has yet to establish itself as a significant regional center of gravity [70]. Syzdykova et al. [71] analyzed Kazakhstan's economic data from 2000 to 2017, finding that both exports and imports contributed to GDP growth, although imports had a stronger short-term impact. Awokuse [72] reported similar findings in Eastern European countries, showing that both exports and imports positively influenced growth. In contrast, Trabelsi and Kachout [62] found that agricultural exports had a negative impact on growth, while other exports were negatively significant, with imports positively affecting long-term economic growth. These studies reveal a complex relationship between imports and GDP. Countries that import technological and capital goods can improve productivity and long-term growth. However, excessive imports without corresponding export capacity can lead to trade imbalances and hinder GDP growth, as seen in Kosovo's economy.
2.3 The impact of final consumption on GDP
When discussing the limitations of traditional economic indicators, Deaton [73] highlights growing concerns about the use of GDP as a measure of economic progress. Although there are no statistical issues with using GDP or GDP per capita, argues that the overemphasis on these measures by the media can undermine public confidence in national accounts. Instead, he advocates focusing on individuals' disposable income and consumption. This perspective is particularly relevant in Kosovo, where final consumption, including both government and private sector spending, plays a crucial role in GDP. In 2012, consumption was USD 6.19 billion and grew to USD 10.1 billion by 2023 [74], primarily driven by remittances from the diaspora [43]. However, despite this growth, poverty remains an issue, with GDP per capita at only USD 5 per day in 2023 and 19% of the population living in poverty in 2018 [74]. Furthermore, government spending makes up 12.5% of GDP, but the annual growth rate of Household Consumption Expenditure, which was 7.3% in 2021, slowed to 3.1% in 2023 [74], signaling a decline in the pace of household spending. While remittances stabilize consumption (USD 1.35 billion in 2024), they also create structural problems as they depend on the economic conditions of the host countries and do not reflect domestic productivity [75]. According to the neoclassical model, consumption should increase with higher productivity and income per capita. However, in Kosovo, remittances finance consumption without stimulating domestic production, limiting sustainable growth. Keynesian economics (1937) emphasizes that consumption drives aggregate demand, thus stimulating GDP in the short term. Increased disposable income leads to higher consumption, which stimulates domestic production. In Kosovo, where consumption is a large share of GDP, policies to increase purchasing power are crucial for growth. However, consumption growth exceeds domestic production, leading to increased imports and dependence on external factors, which hampers sustainable growth and weakens the trade balance. Milton Friedman's consumption theory suggests that individuals base consumption not only on current income but also on expectations for the future [76]. Folbre [77] explores the impact of time use on income and consumption inequality, examining empirical research on time distribution, leisure time, household production, and its implications for policy [77]. In Kosovo, remittances play a critical role in supporting consumption, but their uncertainty due to reliance on the economic conditions of host countries remains a challenge. To achieve more sustainable growth, Kosovo must develop competitive industries, increase exports, and reduce dependence on imports. Sudibyo [78] analyzed the contribution of consumption to economic growth in ASEAN3+ countries and the United States during 1960-2020, finding that consumption has a positive and significant effect on economic growth, while the Consumer Price Index (CPI) has a negative impact. Similarly, research on the impact of household consumption expenditures, government spending, and income per capita on economic growth in the Sidoarjo region, using secondary data for 15 years (2007-2021), shows that while household consumption expenditures and income per capita significantly affect economic development, government spending does not have a significant impact [79]. Studies also show that final consumption has a multiplier effect on GDP growth. Akermi et al. [23] demonstrated this effect, where increased consumption leads to further economic activity. Bakari et al. [64] found a positive relationship between consumption and growth in the U.S., while Perrotta [80] showed that this relationship is stronger in low- and middle-income countries. In a study by Almasifard and Saeedi [81], using panel regression, the authors found that the lagged value of final consumption expenditure as a percentage of GDP has a significant impact on the share of consumption in GDP in eight Central and Eastern European countries (1993-2010). Kosovo's focus on final consumption, primarily financed by remittances and imports, aligns with the theory that low-income economies allocate a large share of GDP to consumption. However, consumption theory criticizes such an economy for relying on unsustainable income sources that do not create a strong foundation for domestic investment in production. Kosovo's economy exhibits a mix of Keynesian elements through its dependence on consumption and possible government interventions, while also showing features of a liberal market economy, emphasizing trade liberalization and private sector development. Thus, the trajectory is not merely Keynesian or liberal but a hybrid model that responds to the needs of a developing economy. The country's high dependence on imports and remittances suggests reliance on external factors, but domestic policies aim to promote market liberalization for long-term growth.
The methodology connects theoretical economic concepts with empirical analysis through the use of the Ordinary Least Squares (OLS) and two-stage least squares (2SLS) estimation method econometric model. The theoretical basis is derived from classical and neoclassical economic theories, with an emphasis on the Cobb-Douglas Production Function, which provide basic knowledge about the drivers of GDP growth, including imports, exports and final consumption in Kosovo during the period 2007-2023. The use of the term economic growth is suitable for measuring the annual growth of GDP. GDP growth shows how much the economic production of a country increases for a certain period, usually a year. Secondary data obtained from the World Bank were used. The variable of economic growth (Y) is represented by the annual growth rate of GDP with the method of expenses at fixed prices in 2015. All variables are in percentage of annual growth. The variables exports, imports and final consumption are at fixed prices of 2015 (Table 1).
Table 1. Summary of data on GDP growth, imports, exports, and final consumption ($US from WDI, 2024)
|
No. |
Variable |
Type |
Explanation |
Description |
Source |
|
1 |
Annual GDP Growth Rate (Y) |
Dependent |
GDP (Annual growth rate of nominal GDP) |
GDP growth (% annual growth, constant 2015 US$) |
World Bank Indicators |
|
2 |
Final Consumption (FC) |
Independent |
Final consumption (Annual growth rate) |
Final consumption expenditure (% annual growth, constant 2015 US$) |
World Bank Indicators |
|
3 |
Export (XM) |
Independent |
Exports (Annual growth rate) |
Exports of goods and services (% annual growth, constant 2015 US$) |
World Bank Indicators |
|
4 |
Import (IM) |
Independent |
Imports (Annual growth rate) |
Imports of goods and services (% annual growth, constant 2015 US$) |
World Bank Indicators |
Source: WDI (2024) https://databank.worldbank.org/source/world- development-indicators.
The data base is the World Bank, estimated in US$ (https://databank.worldbank.org/).
Other data from the Statistics Agency of Kosovo (https://ask.rks-gov.net/) and the Central Bank of Kosovo were also used (http://www.bqk-kos.org/).
The purpose of the study is: The research trajectory goes towards the purpose of the study to measure the impact of import, export and final consumption on the annual GDP growth in Kosovo, offering a critical analysis based on economic theory and relationship between the study variables.
The objectives of the research are: The objectives of the research are: Assessing the impact of imports, exports, and final consumption on the GDP growth rate of the country, using OLS and 2SLS models; Evaluating the relationship between annual GDP growth and the variables of import, export, and final consumption using the Spearman's rho model; Comparing the results with well-known economic theories, both classical and neoclassical; Determining political recommendations that can help improve the structure of the economy and long-term economic growth in Kosovo, based on secondary data from the past decade.
Two hypotheses have been formulated in the study to provide a structured framework for testing the relationship between key economic variables and GDP growth in Kosovo. Their main goal is to empirically verify whether imports, exports, and final consumption significantly influence GDP growth and whether these variables have a statistically significant relationship with it.
H1: The impact of imports, exports, and final consumption on annual GDP growth in Kosovo is positive and statistically significant.
H2: The relationship between annual GDP growth in Kosovo and the variables of imports, exports, and final consumption is statistically significant and positive.
3.1 Theorical framework and study model
The theoretical framework for the neoclassical model of economic growth, starting from Coob and Douglas [30] and Solow [26] and Swan [27], provides a solid basis for understanding the relationships between production factors and the growth of the Gross Domestic Product (GDP). To measure the impact of exports, imports, final consumption, on economic growth in Kosovo, the neoclassical theoretical model of economic growth with the Cobb-Douglas function (1928) has been adopted, which represents a simplified version of the production function, but with a special characteristic: It contributes more to the elasticity of production factors (capital and labor). This model estimates the share of each input in production through elasticities.
a) The Model Cobb-Douglas function is (Cobb-Douglas function, 1928):
Y = A Ka Lβ
where,
Y represents GDP (total production);
A (technological progress) is represented by imports, especially when imports include technology and goods that improve productivity.
K (capital) is replaced by exports since exports represent an important economic investment in a country and increase the value of capital.
L (labour force) is replaced by final consumption, since internal consumption helps in the use of human resources and in increasing the demand for production.
Here, α, β are the respective elasticities that show how much each variable affects the growth of GDP and the calculation with the OLS regression method (using historical data on imports, exports and consumption constitutes a good representation to estimate GDP growth for the years of study.
In this context, Exports represent the capital the country earns from foreign trade, while Imports contribute to the development of technology and the improvement of infrastructure, including capital goods and advanced technologies, thereby impacting productivity. On the other hand, Final Consumption reflects domestic purchasing power, including domestic spending by households and the private sector, and serves as an indicator of aggregate demand. The neoclassical model that describes economic growth in the long term is the Solow-Swan function (1955), which shows the relationship between capital, labor and technology in the general production of the economy.
Solow's neoclassical growth model follows the neoclassical tradition of economic growth (Y) through the production function containing factors, labor (L), capital (K) and the level of technology (A), diminishing marginal returns to labor (ß) and capital (1-ß) in relation to production [26], the Solow Swan function serves to analyze the data dynamically:
Y=Kß(AL)1-ß
This function represents an economy with constant returns to scale, which means that a proportional increase in capital and labor leads to a proportional increase in production. Symbol A - technology in this model is external and grows exogenously over time.
The difference between the Cobb and Douglas model and the Sollow-Swan model is that the Sollow-Swan model focuses on long-term growth and technological progress as key factors for economic growth, while the Cobb Douglas model includes a more balanced approach to capital and labor, explaining the division of the contribution to each output. So, in the Cobb-Douglas function, the import, export and final consumption variables are included instead of capital and labor, considering their elasticity in relation to GDP. In this case, to analyze the variables of this study, import, export and final consumption, we can replace capital and workforce with these variables, to measure their effect on GDP, therefore the Cobb-Douglas production function was used by transforming it the data in the OLS model. The next step is to empirically test the effects of changing capital (imports and exports) and labor (represented by final consumption) on GDP. This is done through the Ordinary Least Squares (OLS) hypothesis testing method.
b) Model Simple Linear Regression
The formulation of the OLS equation through Simple Linear Regression is, Norman R. Draper [82] and Harry Smith (1998) and VSNi (2024) [83]:
$y=a+\beta x$
where, coefficients (a) and (b) are the intercept and slope of the regression line, respectively. The intercept (a) is the value of (y) when (x) is zero. The slope (b) is the change in (y) for each unit change in (x). When the correlation is positive, the slope (b) of the regression line will be positive and vice versa.
While to make Eq. (1) suitable for our empirical research in the OLS model, an explanatory variable is added ($\beta 3$) Final Consumption - FC in the Multiple Linear Regression method (MLR). Regression coefficients, (a) the ($\beta 1, \beta 2, \beta 3$) are estimated by least squares. This results in a regression line that minimizes the sum of squared residuals.
c)Model Multiple Linear Regression Equation, Norman R. Draper and Harry Smith (1998):
$y=a+\beta x 1+\beta x 2+\beta x 3+\varepsilon i$ (1)
To determine the degree of influence in percentage of exports, imports and final consumption on the annual growth of GDP based on the theoretical model, by fitting the variables of the study in the following equation, similar to, CFI (2024):
$\begin{aligned} & {GDPgr}(Y t)=\beta 0+\beta 1 \mathrm{Xi} 1(\text {Import})+\beta 2 \mathrm{Xi} 2(\operatorname{Exp})+\beta \mathrm{pXip} +\varepsilon \mathrm{t}\end{aligned}$
where,
Y represents GDP growth;
IM represents the Import variable;
XM represents the Export variable;
β p Xip (final consumption) or FC, represents the specific variable Final Consumption as β 3 Xi3;
t represents the time period (t = 2007-2023);
ε is random error term.
The annual GDP growth rate is represented by the dependent symbol (Y), and the independent variables, Import x1_IM1, Export x2_XM2, Final Consumption x3_ FC3, as independent variables.
Emphasis is placed on the constant β0 and on the coefficients, import (β1), export (β2) and final consumption (β3) that show the contribution of each variable to the growth of GDP and which would show one of the above signs as follows: The null hypothesis H0 is that the coefficients β1, β2 and β3 are all zero, indicating no effect of export, import and final consumption on GDP growth. The alternative Hypothesis H1 is that at least one of these coefficients is non-zero.
The purpose of Multiple Linear Regressions (MLR) is to model the linear relationship between explanatory (independent) variables and response (dependent) variables. Basically, multiple regression is the extension of OLS regression because it involves more than one explanatory variable and in our situation there are 3 independent variables XM, IM and FC [84].
The independent variables are continuous and the dependent variable is measured on a continuous scale. Before fitting the regression model, multicollinearity is checked, which is tested with the help of two essential techniques, VIF- A measure that is commonly available in software to help diagnose multicollinearity is the variance inflation factor (VIF), the following equation [84]:
$VIFweight =\frac{{Var}( {bweight})}{{Var}( {bweight}) min }=\frac{1}{1-R^{2{weight}}}$
Interpretation of VIF: VIF Status of independent variable or predictor;
VIF=1 There is no connection; 1< VIF = 5 Average correlation; VIF > 5 up to 10 High correlation.
In general, a VIF above 5 or tolerance below 0.25 indicates that multicollinearity may exist, and further investigation is required. When the VIF is greater than 10 or the tolerance is lower than 0.1, there is significant multicollinearity that needs to be corrected. A Multiple Linear Regression model can then be fitted to the available data.
d) Model 2-Stage Least Squares (2SLS)
In the 2SLS method, instruments are used to replace the endogenous variable by providing a correlation with the problematic predictor without being influenced by the error term in the model.
Next, Two-Stage Least Squares (2SLS) regression analysis as a statistical technique to analyze structural equations [85, 86]:
It is a statistical method used to address "endogeneity" in econometric models, when the independent variables are correlated with the errors of the model. In the first stage, a regression is performed to create predictions for the independent variables, using instruments that are correlated with those variables but not with the errors [87]. In the second stage, these predictions are used as independent variables in another regression to estimate the coefficients. This method helps ensure accurate and unbiased results by eliminating the problems caused by "endogeneity" [88]. Formula për 2-Stage Least Squares (2SLS) [86] and Julius [88]:
i) The first stage regression aims to predict the values of the Instrumental variables.
$X=\gamma_0+\gamma_i Z+\mathrm{u}$ (2)
where, X is the endogenous independent variable; Z are the instruments that are correlated with X but not with the errors u. While, γ0, γi are the regression coefficients of the first stage. Whereas, u are the residuals from the regression.
ii) The Second Phase used the predictions of the first phase $\widehat{\mathrm{X}}$ to perform the second regression [86]:
$Y=a+\beta \widehat{\mathrm{X}}+\epsilon$ (3)
where, Y is the dependent variable; $\widehat{\mathrm{X}}$ are the predictions from the first stage regression; And, α, β are the second-stage regression coefficients.
To facilitate the measurement of GDP growth, Eq. (2) and Eq. (3) are converted into a log (log) model by Gujarati cited in the study of Orji et al. [89]. This transformation enhances numerical accuracy. The modified equation is expressed as follows:
$\log \mathrm{GDPt}=\beta \mathrm{o}+\beta 1 \log \mathrm{FC}+\beta 2 \log \mathrm{IM}+\beta 3 \log \mathrm{XM}+\mu \mathrm{t}$
This equation outlines the general structure of the model, where both the dependent and independent variables may be endogenous, thus correlated with the error terms. This correlation could potentially affect the accuracy of OLS estimates. To address this issue, the study applies the Two-Stage Least Squares (2SLS) method, utilizing the Log or in values of the variables as instruments, as suggested by Scott and Holt [90].
The study incorporates two models - OLS and 2SLS - chosen carefully to achieve the research objectives. The econometric analysis has been structured to consider the critical components of the models. Recognizing the potential simultaneity between Final Consumption (FC), Imports (IM), Exports (XM), and GDP growth, the 2SLS estimation method is used to mitigate endogeneity concerns.
Diagnostic tests have been conducted to evaluate the stochastic properties of the models, with both OLS and Instrumental Variables (IV)/2SLS estimations employed to address potential endogeneity. In cases of endogenous regressors, the IV estimator provides a more accurate and consistent result compared to OLS, as it remains unbiased [91, 92].
e) Model Spearman's Correlation
Model Spearman's correlation is a measure of the strength and direction of the monotonic relationship between two variables. This method is used when the data are ordinal or do not meet the requirements for using Pearson's correlation. Spearman's correlation measures the relative ranking of the two variables and does not require the data to be on a specific scale (e.g., it does not need to be normally distributed). Theoretical formula for Spearman's Correlation (ρ) [93]:
$p=1-\frac{6 \sum d_i^2}{n\left(n^2-1\right)}$
where, di the difference between the rankings of the variables for each pair of observations (the rank difference for each data value). While, n is the number of observations.
a) The PCA (Principal Component Analysis) test, as outlined by Jolliffe [94], was conducted preliminarily to reduce dimensions [95], eliminate multicollinearity, and improve the efficiency of instruments in 2SLS (see Section 4) [95]. The Principal Component Analysis (PCA) test was performed using SPSS. The first step was "Analysis," the second was "Dimension Reduction," and the third was "Factor" [95, 96]. The variables were analyzed in SPSS to reduce total variance to the shared variance, using the "Eigenvalue" option to assess the contribution of each component. Positive eigenvalues indicate a valid model, while values near zero suggest multicollinearity, focusing key information on the first components.
The Data Matrix has been created – matrix X, which contains the data of n × p, where n is the number of observations and p is the number of variables (dimensions), and the Covariance Matrix – the calculation of the covariance matrix C, which is a p × p matrix [95]:
$C=\frac{1}{n-1} X^T X$
Finding the Eigenvalues and Eigenvectors: The eigenvalues (λ1, λ2, ..., λp) and eigenvectors (v1, v2, ..., vp) for the covariance matrix C are calculated. The eigenvalue and eigenvector satisfy the following equation [94]:
$C v=\lambda v$
where, v is the eigenvector and lambda, λ is the eigenvalue. The principal components are selected based on the eigenvectors with the largest eigenvalues, as they explain more variance in the data, and the data can be projected onto the space of these components using the selected eigenvectors [95]:
$Z=X V$
where, V is the matrix of eigenvectors and Z is the projection matrix that contains the principal components. In this way, PCA reduces the dimensionality of the data while preserving as much variance as possible.
b) ADF test
Action: Analyze → Regression → Linear; Set, Dserie = serie − LAG(serie,1)
D_serie (the first difference of the series, GDP) as the "Dependent Variable." Next, LAG(serie,1) is set as the "Independent Variable FC," clicked OK, and the regression is executed, with the residuals saved. If the residuals of the regression are stationary, then the time series is cointegrated or becomes stationary after differencing, and this process is continued for all independent variables.
i) The Granger Causality test
Granger causality is an econometric test that assesses whether one time series can predict another, provided the data is stationary [98]. The Granger Causality test is used to evaluate potential predictive relationships between independent variables. For modeling and forecasting purposes, a time series regression approach is applied, considering lagged information on reported cases and genetic diversity in other regions. Originally developed by Granger [99, 100] and later expanded that this test determines whether one variable has the ability to predict another [101]. Studies further defined causality based on two key principles [102, 103]: (a) the cause precedes the effect, and (b) the cause contains unique information about the future values of its effect.
Granger Causality is tested using the following regression models [99]:
$\begin{aligned} & Y_t=a+\sum_{i=1}^p \beta_i Y_{t-1}+\sum_{i=1}^p \beta_i \gamma \mathrm{i} X_{t-1}+\epsilon \mathrm{t} \\ & X_t=\delta+\sum_{i=1}^p \theta \mathrm{i} X_{t-1}+\sum_{i=1}^p \phi_i \mathrm{Y}_{t-1}+\eta \mathrm{t}\end{aligned}$
where,
Yt$~$and Xt$~$are the two time series.
p is the number of lags.
βi, γi, θi, ϕi are the regression coefficients.
ϵt and ηt are error terms.
The Granger Causality test includes several methods to assess this hypothesis, such as [104]:
The null hypothesis H0 states that Xt does not Granger-cause Yt, meaning that the coefficients γi= 0 for all (i) [104].
If the null hypothesis is rejected (p-value < 0.05), then Xt Granger-causes Yt.
This test helps determine whether past values of X provide statistically significant information in predicting Y.
ii) Two – Sample KS test [105]
The null hypothesis assumes that the two samples come from the same distribution [106]. The K-S (Kolmogorov- Smirnov) test is a non-parametric test [107], because of this it no longer requires assumptions about the shape or parameters of the underlying distributions that are contrasted [108]. This makes it a useful option for parametric controls, in conjunction with the T-test or ANOVA. It is assumed that if the p-value is high (e.g., > 0.05), the data follow a normal distribution because a low p-value suggests outliers.
The formula for the Two-Sample Kolmogorov-Smirnov (KS) Test, as given by Massey [105], is:
$\operatorname{Dn}, \mathrm{m}=\sup \mid \operatorname{Fn}(\mathrm{x})-\operatorname{Gm}(\mathrm{x})$
where, Dn, m are the KS test statistic.
$F n(x)$ and $\mathrm{Gm}(\mathrm{x})-\mathrm{Gm}(\mathrm{x})$ are the empirical cumulative distribution functions (ECDFs) of the two samples. (sup) denotes the supremum (maximum) of the absolute differences between the two ECDFs over all values of (x). This test measures the largest difference between the two ECDFs to assess whether they come from the same distribution.
iii) Breusch-Pagan-Godfrey test
The Breusch-Pagan test, developed in 1979 by Trevor Breusch and Adrian Pagan, detects heteroskedasticity in a linear regression model [109]. It checks if the variance of the error term is related to the predictor variables, indicating the presence of heteroscedasticity [110].
The test statistic is calculated as:
Test statistic = N x R2
where n = is the number of observations 11, R2 is the coefficient of determination of the regression of squared residuals from the initial regression, and k = is the number of independent variables 3 [110].
This test, along with others like PCA, KS, Granger Causality, and ADF, enhances the accuracy and reliability of the model by addressing issues like multicollinearity, causal relationships, data fit, and stationarity.
This section presents empirical regression results and explores the impact and relationship of imports, exports and final consumption on annual GDP growth, using a time series data analysis for Kosovo, period 2007-2023. Descriptive statistical analysis presents the arithmetic mean and standard deviation (Table 2) of GDP annual growth, import, export and final consumption.
4.1 The descriptive statistic
The descriptive statistics are presented in Table 2 for the following indicators: GDP, FCE, EXP, and IMP (2007-2023).
Table 2. Descriptive statistics
|
|
N |
Minimum |
Maximum |
Mean |
Std. Deviation |
|
LagGDP |
17 |
-11.17 |
10.8 |
2.1 |
4.4 |
|
LagFCE |
17 |
71.36 |
106.6 |
83.6 |
8.5 |
|
LagIMP |
17 |
23.93 |
104.7 |
54.0 |
21.1 |
|
LagEXP |
17 |
17.00 |
99.3 |
47.1 |
24.6 |
|
N |
17 |
|
|
|
|
The analysis of the mean and standard deviation helps us understand the performance and variability of economic factors:
- LagGDP: The mean (2.15) indicates moderate economic growth, while the standard deviation (4.47) shows moderate fluctuations, suggesting stable growth but with periods of uncertainty.
- LagFCE: The mean (83.63) reflects steady and high spending, while the standard deviation (8.52) indicates moderate variability, possibly linked to factors like inflation.
- LagIMP: The mean (54.06) reflects average imports, and the standard deviation (21.13) suggests considerable fluctuations, likely influenced by international factors such as prices and trade policies.
- LagEXP: The mean (47.12) indicates average exports, and the standard deviation (24.65) shows high variability, reflecting changes in international demand and trade policies.
Overall, these statistics suggest an economy with moderate growth but significant variability in international trade.
4.1.1 The descriptive statistic
In recent years, Kosovo's economy has been impacted by external demand slowdown and rising inflation, but in 2024, economic activity grew by 4.5%, primarily driven by public investments, consumption, and service exports, while net exports had a negative effect on GDP growth, and inflation slowed to 1.6 % [111].
Study variables that also shape the economic profile of Kosovo (https://bqk- kos.org/statistikat/serite-kohore/):
While the real GDP in 2022 was 7.499 million Euros or 6% lower than the nominal GDP and this trend continued in 2023 and Q1/2024. With Eq. (4) below, the changes in GDP for Kosovo are calculated. Even the real GDP growth rate in % (GDP Real growth rate) for 2021 was 10.7%, in 2022 it decreased to 4.3%, while in 2023 it was 3.23% measured by quarters. The year 2024, the period January-March, has an economic growth of 5.6% [44].
Elasticity or change in GDP for the country (j) is measured by Eq. (4):
$\Delta \mathrm{GDP}=\frac{G D P_t^J}{G D P_{t-1}^J}-1$ (4)
where, $\Delta$ GDP is a change in GDP between time $t$ and $t-1$, $G D P_t^J$ is GDP for country j at time ( t ) and $G D P_{t-1}^J$ is GDP for country jat time t-1.
The real GDP growth in Kosovo is an average of 4.5% for almost 2 decades [111].
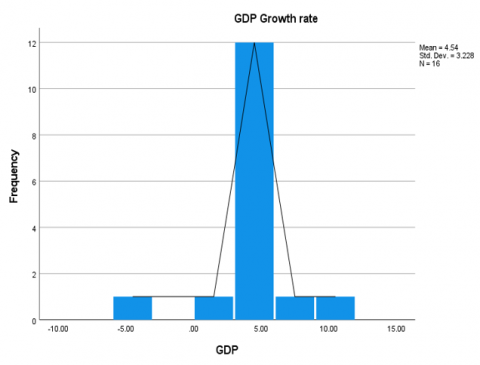
The inverted "V" shaped histogram shows that most values are concentrated at the extremes, with a low peak around the mean 4.54% (Figure 2). This suggests that there were years with both high and low GDP growth, while years of moderate growth were fewer. The data distribution shows significant variations, reflecting extreme economic events affecting GDP. The import of goods for 2014 was €2.5 billion, while a year later (2015) with €2.6 billion, in 2016 it was €2.8 billion, while in 2017 with €3.0 billion import.
Figure 2. GDP growth rate 2008-2024
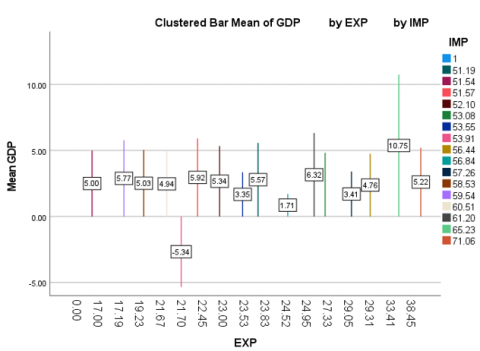
Kosovo's economy (2008-2022) (Figure 3), Cluster Bar Mean of GDP shows GDP fluctuations between -5% and 10%, influenced by global crises, political uncertainty, and low investments. High imports (€51-71 billion) indicate dependence on foreign markets, while limited exports (€17-38.4 million) create a significant trade deficit. Structural improvements and increased production are essential for economic balance.
Figure 3. Cluster Bar Mean of GDP (2008-2022)
In Figure 4, slow import growth continues in 2018 with €3.3 billion, for 2019 it was €3.5 billion and for 2020 it was €3.2 billion. The import of goods for the year 2021 increased by €4.6 billion, while the year 2022 was €5.6 billion. The increase and decrease are also in 2023 with only €5.9 billion. The forecast of imports is expected to be around 6 billion euros, emphasizing Kosovo's dependence on imports. While the real GDP in 2022 was 7.499 million Euros or 6% lower than the nominal.
Final consumption expenditures in Kosovo have steadily increased from 2007 to 2023, reflecting higher household and government spending on goods and services, with significant growth between 2020 and 2023 due to post-pandemic recovery, government spending, and economic normalization after COVID-19 lockdowns. The overall trend shows moderate annual growth, particularly accelerating in recent years, driven by inflation, domestic spending, and recovery [111].
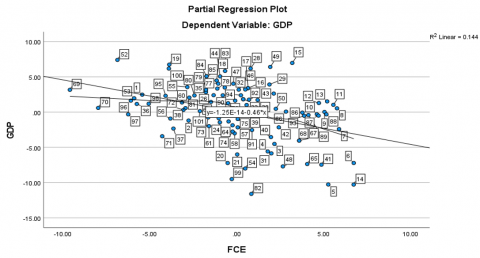
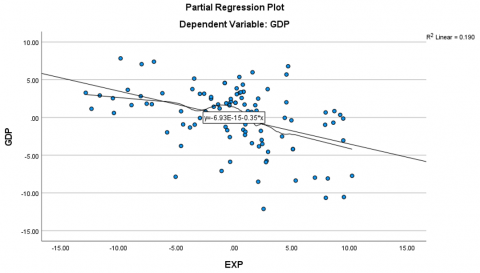
The Partial Regression Plot (Figure 5) analysis examines the relationship between GDP and final consumption (FCE) as dependent and independent variables.
From the regression equation:
y= −1.25×10⁻¹⁴−0.46⋅X
It shows a negative correlation between final consumption and GDP, where an increase in final consumption tends to lead to a decrease in GDP. However, this relationship is relatively weak, as R² = 0.144, indicating that only 14.4% of the variance in GDP can be explained by changes in final consumption. This result suggests that final consumption is not a dominant factor in explaining GDP movements and that other factors have a greater impact on the economy.
Figure 5. Partial Regression Plot for GDP and final consumption
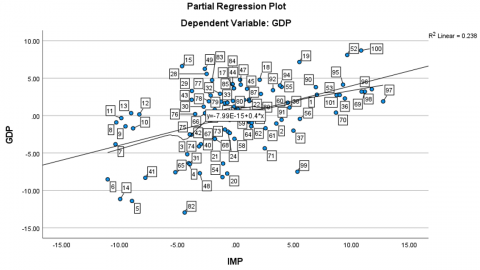
Figure 6. Analysis Partial Regression Plot for PBB and imported
In this Partial Regression Plot, (Figure 6) the relationship between GDP and Imports has been analyzed. The regression equation is:
y=7.99×10 −15+0.4⋅X
This equation shows a positive relationship, where an increase in imports may lead to an increase in GDP.
However, R² = 0.238 suggests that only 23.8% of the changes in GDP can be explained by changes in imports, indicating a moderate impact of imports on the economy. This suggests that other factors also play a significant role in GDP growth.
In the Partial Regression Plot, Figure 7 examines the relationship between GDP and Exports, the regression equation is given by:
y=6.93×10⁻¹⁵−0.35⋅X
This equation indicates a negative relationship between exports and GDP, meaning that an increase in exports might correlate with a decrease in GDP, though the impact appears to be weak. The R² value of 0.190 suggests that only 19% of the variance in GDP can be explained by changes in exports, indicating a modest and potentially insignificant role of exports in driving GDP growth in this case. Other factors are likely influencing GDP more significantly.
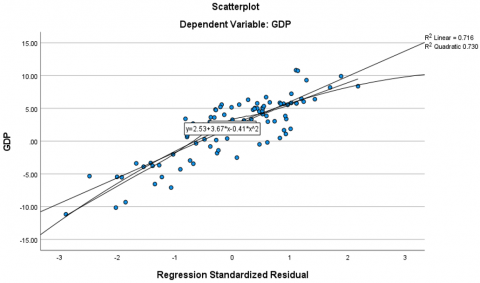
This econometric analysis Figure 8, uses a scatter plot to examine the impact of several factors on GDP growth in Kosovo. The quadratic regression takes the form:
y = 2.53 + 3.63⋅X − 0.41⋅X
Figure 7. Analysis of the Partial Regression Plot for GDP and exports
Figure 8. The impact of exports, imports and FC on annual GDP growth in Kosovo
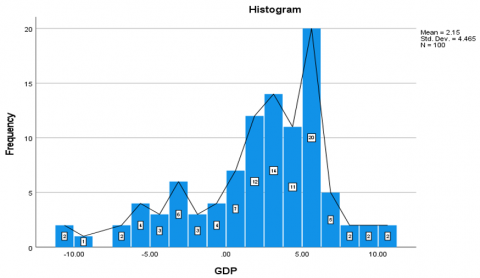
Figure 9. Histogram (Mean, Std.Dev., for impact of XM, IM and FC on GDP growth
The horizontal axis shows standardized residuals ranging from -3 to +3, while the vertical axis displays GDP values ranging from -15 to +15. The R² value is 0.716, indicating that 71.6% of the GDP variance is explained by the variables in the model. When the quadratic term is included, R² increases to 0.730, suggesting that the quadratic model is more appropriate. This shows that the relationship between various factors such as exports, imports, and final consumption with GDP is complex and better explained by a non-linear model. This analysis helps in formulating policies for the sustainable economic development of Kosovo.
The histogram (Figure 9) analyzes the relationship between imports, exports, consumption, and GDP. With a mean of 2.15 and a standard deviation of 4.465, the data shows significant variations from month to month. The vertical axis represents the frequencies, while the horizontal axis represents GDP. This graph helps in understanding the impact of economic factors on GDP, suggesting that there are substantial variations concerning the variables that influence Kosovo's GDP (Table 3).
Table 3. Olaps cube
|
|
FCE |
Total |
EXP |
Total |
IM |
Total |
|
|
Sum |
N |
Mean |
Std. Deviation |
% of Total Sum |
% of Total N |
|
GDP |
74.30 |
17 |
4.53 |
2.90 |
100.0% |
100.0% |
Source: By authors
The OLAP cubes for FCE (Final Consumption Expenditures), EXP (Exports), IMP (Imports), and GDP offer insights into Kosovo's economic performance over 17 years. The GDP Sum is 74.30 %, representing total GDP growth, with a Mean of 4.53% and a Std. Deviation of 2.90%, showing moderate growth with considerable yearly fluctuations. The % of Total Sum for GDP is 100%, indicating all data points relate to GDP.
High mean values in EXP suggest export-driven growth, while high FCE values emphasize the importance of domestic consumption. Std. Deviation values highlight volatility, especially in trade. Analyzing these cubes helps understand Kosovo's economic dynamics and the contribution of consumption, trade, and GDP growth.
4.2 The statistic tests
This test is well known for its use in time series models to verify whether a change in one time series can predict a change in another series. Granger Causality test [104]. The Granger Causality test assesses whether the past values of one time series can predict the current values of another time series (Table 4).
Table 4. Granger causality results for FC, IM, and XM on GDP for Kosovo
|
Null Hypothesis |
P-Value |
Lag |
|
Consumption Granger-causes GDP |
0.01 |
1 |
|
Exports Granger-causes GDP |
0.04 |
1 |
|
Imports Granger-causes GDP |
0.00 |
1 |
This table presents the results of the Granger Causality test for the effect of consumption, exports, and imports on GDP, using a lag of 1 time period. The p-values from the test are all below 0.05, so we conclude that (X - imports, exports, and final consumption) Granger-causes an increase or decrease in (Y - GDP).
Table 5. Kolmogorov- Smirnov statistic test
|
Variables |
KS: Statistic |
P-Value |
|
GDP annual growth |
0.89 |
2.08 |
|
Final Consumption |
0.88 |
6.59 |
|
Export |
0.76 |
1.12 |
|
Import |
0.69 |
1.95 |
The statistic (Table 5) indicates a relatively large discrepancy between the two sampling distributions. In our case, the p-value is below the chosen level of significance (usually 0.05), the null hypothesis is rejected. Both samples come from different distributions (p=value for each variable is, 2.08; 6.5; 1.12; and 1.95, and KS statistics are, from 0.89; 0.88; 0.76 and 0.69).
The results of the Kolmogorov-Smirnov test make sense because the distribution is random - whatever factor caused a value to be too high or too low affects only that value.
Autocorrelation data between GDP and independent variables helps in identifying lagged correlation and assessing data reliability (Table 6).
Table 6. Tests autocorrelations
|
Series: GDP |
|||||
|
Lag |
Autocorrelation |
Std. Errora |
Box-Ljung Statistic |
||
|
Value |
df |
Sig.b |
|||
|
1 |
-.253 |
.130 |
5.000 |
1 |
.025 |
|
2 |
-.127 |
.138 |
6.581 |
2 |
.037 |
|
3 |
.155 |
.140 |
8.843 |
3 |
.031 |
|
4 |
-.102 |
.143 |
9.944 |
4 |
.041 |
|
5 |
-.138 |
.144 |
11.911 |
5 |
.036 |
|
6 |
.077 |
.147 |
12.477 |
6 |
.052 |
|
7 |
-.052 |
.147 |
12.753 |
7 |
.078 |
|
8 |
-.007 |
.148 |
12.758 |
8 |
.120 |
|
9 |
.017 |
.148 |
12.787 |
9 |
.172 |
|
10 |
.041 |
.148 |
12.952 |
10 |
.226 |
|
11 |
-.128 |
.148 |
14.500 |
11 |
.207 |
|
12 |
-.046 |
.150 |
14.749 |
12 |
.255 |
|
13 |
.062 |
.150 |
15.274 |
13 |
.291 |
|
14 |
-.109 |
.150 |
16.857 |
14 |
.264 |
|
15 |
.176 |
.152 |
21.518 |
15 |
.121 |
|
16 |
.043 |
.155 |
21.753 |
16 |
.151 |
a. The underlying process assumed is MA with the order equal to the lag number minus one.
The Bartlett approximation is used.
b. Based on the asymptotic chi-square approximation.
The measurement of autocorrelation at Lag 1 and Lag 2 indicates that the correlations are statistically significant (p < 0.05), but negative and weak. From Lag 3 to Lag 16, the correlations are small and statistically insignificant (p > 0.05), suggesting that over longer periods, the correlation between GDP and the independent variables becomes negligible. Meanwhile, the Box-Ljung statistic shows that autocorrelation is prominent in shorter periods (p < 0.05 for Lag 1-5), but decreases for longer periods (p > 0.05 after Lag 5). Negative autocorrelations in the shorter periods may indicate external influences, while after Lag 3, the impact becomes insignificant, suggesting that the data is reliable for longer periods.
Table 7. KMO and Bartlett’s
|
KMO and Bartlett's Test |
||
|
Kaiser-Meyer-Olkin Measure of Sampling Adequacy. |
.287 |
|
|
Bartlett's Test of Sphericity |
Approx. Chi-Square |
303.387 |
|
df |
6 |
|
|
Sig. |
.000 |
|
The results of the Kaiser-Meyer-Olkin (KMO) test (Table 7) and Bartlett's Test of Sphericity indicate that PCA might be suitable for this data set. While the KMO value is 0.287 (below 0.5, suggesting poor suitability), the Bartlett's p-value (0.000) is very low, indicating that the variables are correlated and PCA can be used.
Table 8. Communalities
|
Variables |
Initial |
Extraction |
|
Gross Domestic Product (GDP) |
1.000 |
.734 |
|
Final Consumption (FCE) |
1.000 |
.693 |
|
Exports (EXP) |
1.000 |
.959 |
|
Imports (IMP) |
1.000 |
.833 |
|
Extraction Method: Principal Component Analysis. |
||
The Communalities results in Table 8 show that variables such as GDP, FCE, EXP, and IMP have high percentages of variance explained by the principal components, with extraction values ranging from 0.693 (FCE) to 0.959 (EXP), suggesting that all the variables contribute significantly to the formation of the principal components.
Table 9. Total variance explained
|
Component |
Initial Eigenvalues |
Extraction Sums of Squared Loadings |
||||
|
Total |
% of Variance |
Cumulative % |
Total |
% of Variance |
Cumulative % |
|
|
1 |
2.18 |
54.70 |
54.703 |
2.188 |
54.703 |
54.7 |
|
2 |
1.03 |
25.75 |
80.458 |
1.030 |
25.755 |
80.4 |
|
3 |
.756 |
18.90 |
99.361 |
|
|
|
|
4 |
.026 |
.639 |
100.00 |
|
|
|
The Total Variance (Table 9), Explained results show that the two main components explain over 80% of the total variance of the data, with the first component explaining 54.7% and the second 25.8%. The other components have a very small impact on the total variance.
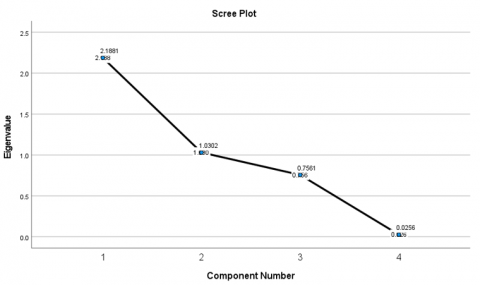
Figure 10. Principal Component Analysis (PCA)
The results Scree plot or Figure 10, explained show that the first two principal components are important for explaining the variance in the data. PCA1 (2.18) explains the largest portion of variance and represents the most significant variable or combination of variables. PCA2 (1.03) still holds important information about variations among variables. PCA3 (0.756) and PCA4 (0.026) have very low values, especially PCA4, indicating minimal impact. Most of the dataset’s information can be reduced to PCA1 and PCA2, as the third and fourth components do not have a significant effect.
This result indicates that the PCA has successfully reduced the dimensionality of the data while preserving essential information.
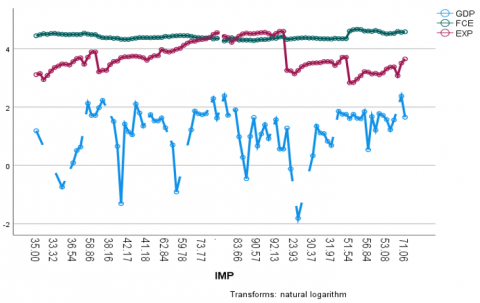
The natural logarithm (Figure 11), transformation for the effect of imports on GDP, exports, and consumption helps improve economic analysis by reducing heteroskedasticity and clarifying the relationships between these variables. The graph shows imports on the horizontal axis, with values ranging from 35 to 71 Billion euro, and their effects on GDP, exports, and consumption on the vertical axis. This transformation aids in measuring elasticities and provides a clearer understanding of the economic impacts.
Figure 11. The impact of natural logarithm transformation on imports and economic variables
The Total Variance Explained results show that the two main components explain over 80% of the total variance of the data, with the first component explaining 54.7% and the second 25.8%. The other components have a very small impact on the total variance.
Table 10. Breusch - Pagan test
|
Test |
Chi-Square (χ²) |
P-Value |
Interpretation |
|
Breusch-Pagan Test |
73.9 |
0.1816 |
A p-value greater than 0.05 suggests that the null hypothesis cannot be rejected, and heteroscedasticity is not present in the model. |
In Table 10, a small chi-square value (along with an associated small p-value) indicates that the null hypothesis is true (i.e., the variances are all equal). In our case Chi-square χ2= 73.9 and p-value for Breusch-Pagan test: 0.1816. If the p-values of the coefficients are below a certain threshold (usually 0.05), this suggests that heteroscedasticity is present in the original model. Prob > chi2, is the p-value corresponding to the Chi-Square test statistic, in this case, it is 0.181. Since this value is greater than 0.05, we cannot reject the null hypothesis and conclude that heteroscedasticity is not present in our data.
4.3 The result of the OLS
We assess whether import, export and final consumption (3 continuous variables, measured in years) are potential confounders, testing the following hypothesis:
H1: The impact of imports, exports, and final consumption on annual GDP growth in Kosovo is positive and statistically significant.
Table 11 resents a Model Summary of the regression model, where GDP is the dependent variable and IMP, FCE, and EXP are the independent variables. The regression model shows a moderate relationship between the independent variables and GDP, with an R value of 0.522. The R² value is 0.272, indicating that only 27.2% of the variation in GDP can be explained by the included variables. The Adjusted R² is 0.250, accounting for the model's complexity. The standard error is 3.86774, suggesting some inaccuracy in the predictions, while the Durbin-Watson value of 1.756 indicates no significant autocorrelation in the residuals.
Table 11. Model summaryb
|
Model |
R |
R Square |
Adjusted R Square |
Std. Error of the Estimate |
Durbin-Watson |
|
1 |
.522a |
.272 |
.250 |
3.86774 |
1.756 |
|
a. Predictors: (Constant), IMP, FCE, EXP |
|||||
|
b. Dependent Variable: GDP |
|||||
This suggests that the model may need improvement for more accurate predictions. Overall, this model indicates that the variables IMP, FCE, and EXP have a moderate impact on GDP, but there is room for improvement in the accuracy of predictions, as the model does not explain a significant portion of GDP variation.
Table 12. ANOVAa
|
Model |
Sum of Squares |
df |
Mean Square |
F |
Sig. |
|
|
1 |
Regression |
537.726 |
3 |
179.242 |
11.982 |
.000b |
|
Residual |
1436.105 |
13 |
14.959 |
|
|
|
|
Total |
1973.832 |
16 |
|
|
|
|
|
a. Dependent Variable: GDP |
||||||
|
b. Predictors: (Constant), IMP, FCE, EXP |
||||||
To calculate the percentage of variation explained by the regression (R²), the formula used is:
Using the values from the ANOVA table R² = Regression Sum of Squares (SSR) 537.726/ Total Sum of Squares (SST) 1973.832 × 100 =27%
The ANOVA (Table 12) indicates that the variables IMP, FCE, and EXP account for 27% of the changes in GDP, while 73% of the variation remains unexplained. This suggests that other factors, such as fiscal policies and international influences, play a role in economic development. The high F-statistic (11.982) and low p-value (0.000) confirm that the variables are statistically significant. However, modeling only these factors is not sufficient to fully explain economic performance, highlighting the need to include additional important factors.
The Mumultiple Linear Regression Model (Table 13) analyzes the impact of three independent variables – Final Consumption Expenditure (FCE), Exports (EXP), and Imports (IMP) – on GDP growth. The equation is:
Annual GDP growth = 29.165 - 0.379 FC - 0.309 XM + 0.355 IM = 29 %
The model shows that a 1% increase in final consumption results in a 0.379% decrease in GDP, indicating a negative impact. This suggests that increased domestic consumption may not directly contribute to long-term economic efficiency. Similarly, exports have a negative coefficient of -0.309, suggesting that higher exports can lead to a decrease in GDP, possibly due to external factors limiting export growth. On the other hand, imports show a positive relationship, with a coefficient of 0.355, meaning an increase in imports leads to a 0.355% increase in GDP, possibly due to improvements in productivity and efficiency. The analysis of multicollinearity reveals that FCE has low multicollinearity (VIF of 3.000), while EXP and IMP show moderate multicollinearity, but none of the variables exhibit problematic levels. The PCA was used to reduce multicollinearity and retain essential information.
Table 13. Coefficientsa
|
Model |
Unstandard. Coefficients |
Stand.Coefficients |
t |
Sig. |
Correla. |
Collinearity Statistics |
|||||
|
B |
Std. Error |
Beta |
Zero-Order |
Partial |
Part |
Tolerance |
VIF |
||||
|
1 |
(Constant) |
29.1 |
7.59 |
|
3.84 |
.000 |
|
|
|
|
|
|
FCE |
-.379 |
.091 |
-.722 |
-4.14 |
.000 |
-.040 |
-.390 |
-.361 |
.250 |
3.00 |
|
|
EXP |
-.309 |
.064 |
-1.70 |
-4.86 |
.000 |
.158 |
-.445 |
-.423 |
.041 |
5.28 |
|
|
IMP |
.355 |
.063 |
1.68 |
5.67 |
.000 |
.305 |
.501 |
.494 |
.056 |
6.58 |
|
|
a. Dependent Variable: GDP |
|||||||||||
In conclusion, the results suggest that economic policy could focus on increasing imports to stimulate GDP growth, while more attention should be given to managing final consumption and exports for sustainable development.
The testing of the first hypothesis using the Two-Stage Least Squares (2SLS) model.
H1.: The impact of imports, exports, and final consumption on annual GDP growth in Kosovo is positive and statistically significant.
H1.1.1: The impact of imports on annual GDP growth in Kosovo is positive and statistically significant.
The Two-Stage Least Squares (2SLS) model analyzes the impact of Imports (Log_IM), Exports (XM), and Final Consumption (Log_FC) on the growth of Log_GDP in Kosovo with a time lag (regression Eqs. (5)-(7)) is as follows (Table 14):
Table 14. 2SLS estimate of GDP and IM
|
Variables |
2SLS_IM |
|
1_Cons Log_GDP |
1.282 |
|
(Cons) sig. Log_IM Coefi_β |
.005 0.169 |
|
p-value |
.002** |
|
r2 |
.576 |
|
r_adj, |
.557 |
|
r |
.675 |
|
Cons_Beta |
1.996 |
|
Con.Coef.Sta.Error |
4.996 |
|
F_statistic |
13.971 |
|
Log-likelihood |
85.682 |
|
N |
10 |
|
Legend |
p<0.05** |
2SLS Model: LogGDP_annual growth $=\widehat{a}+$ $\widehat{\beta} \widehat{\mathrm{X}}+\epsilon=\log \operatorname{GDP}=1.282+0.169 \mathrm{IM}$ (5)
Imports have a positive and statistically significant impact on GDP, with an effect of 16.9% for every 1% increase in imports. With R² = 0.576 and a p-value = 0.002, the model shows that imports explain a large portion of the variation in GDP. This highlights Kosovo's economy's dependency on imports for production and consumption. Research and Information System for Developing Countries, Prebisch [112] argued that developing countries rely heavily on imports and have difficulty developing their export industries [113].
H1.1.2: The impact of exports on annual GDP growth in Kosovo is positive and statistically significant.
2SLS Model:
$\begin{aligned} &{LogGDP} P_{{annual}} {growth}=\widehat{\mathrm{a}}+\widehat{\beta} \widehat{\mathrm{X}}+\epsilon=\text { LogGDP }=1.246+0.019 \mathrm{XM}\end{aligned}$ (6)
Exports have a positive but limited impact on GDP, where every 1% increase in exports leads to only a 1.9% increase in GDP (Table 15). With R² = 0.369 and a p-value = 0.005, the model is valid and statistically significant. This indicates that Kosovo's economy remains more dependent on imports than exports.
Table 15. 2SLS estimate of GDP and XM
|
Variables |
2SLS_XM |
|
1_Cons Log_GDP |
1.246 |
|
(Cons) sig. Log_XM Coefi_β |
0.005 0.019 |
|
p-value |
0.005** |
|
r2 |
.369 |
|
r_adj, |
.564 |
|
r |
.663 |
|
Cons_Beta |
1.246 |
|
Cons.Coef.Sta.Error |
3.992
|
|
F_statistic |
17.289 |
|
Log-likelihood |
99.121 |
|
N |
10 |
|
Legend: |
p<0.05 ** |
H1.1.3: The impact of Final Consumption on annual GDP growth in Kosovo is positive and statistically significant.
2SLS Model:
$\begin{aligned}{LogGDP}_{{annual}} & {growth}=\widehat{\mathrm{a}}+\widehat{\beta} \widehat{\mathrm{X}}+\epsilon =\operatorname{LogGDP} =1.890+0.703 \mathrm{FC}\end{aligned}$ (7)
Final consumption has the greatest impact on GDP, with an effect of 70.3% for every 1% increase (Table 16). With an R² of 57.6% and a p-value of 0.002, the model confirms its significance. This result indicates that Kosovo's economy relies mainly on domestic demand rather than exports.
Table 16. 2SLS Estimate of GDP and FC
|
Variables |
2SLS_FC |
|
1_Cons Log_GDP |
1.890 |
|
(Cons) sig. Log_FC Coefi_β |
.000 .703 |
|
p-value |
.002** |
|
r2 |
.576 |
|
r_adj |
.557 |
|
r |
.675 |
|
Cons_Beta |
1.690 |
|
Coef.Sta.Error |
4.890 |
|
F_statistic |
131.713 |
|
Log-likelihood |
75.682 |
|
N |
10 |
|
Legend: |
p<0.05 ** |
According to these results, Kosovo's economy is characterized by a strong dependence on final consumption and imports, while exports play a secondary role. The 2SLS model analysis with lag for each variable (log) shows that final consumption (FC) has the largest impact on GDP, confirming that economic growth is primarily driven by domestic demand. Imports (IM) also significantly influence GDP, reflecting a high reliance on foreign goods and services. Meanwhile, exports (XM) have a smaller impact on GDP, which reflects the lack of a strong export sector in the economy. This economic reality makes Kosovo vulnerable to external factors and limits sustainable growth due to a weak export sector and high dependence on imports.
To improve the situation, Kosovo needs to increase production and exports, diversify its economy to reduce dependence on imports, and encourage investments. This would help shift from a consumption-based economy to a productive and export-oriented economy, ensuring more sustainable growth and reducing vulnerability to external shocks.
Verification of the first hypothesis (Table 17):
Table 17. Verification of the H1 - Kruskal-Wallis Test
|
Hypothesis |
Test Type |
P-Value |
Decision |
|
The distribution of GDP is the same across categories of FCE. |
Independent-Samples Kruskal-Wallis Test |
0.001 |
Reject the null hypothesis |
|
The distribution of GDP is the same across categories of EXP. |
Independent-Samples Kruskal-Wallis Test |
0.003 |
Reject the null hypothesis |
|
The distribution of GDP is the same across categories of IMP. |
Independent-Samples Kruskal-Wallis Test |
0.002 |
Reject the null hypothesis |
The analysis shows that GDP varies significantly across FCE, EXP and IMP categories, as all tests result in a significance level of less than 0.05. This suggests that these factors have a significant impact on GDP, reinforcing the need for further analysis on the nature and extent of this impact.
Figure 12. Legend information impact final consumption in GDP with time delay (2007-2023)
The histogram analyzes the relationship between imports, exports, consumption, and GDP. With a mean of 2.15 and a standard deviation of 4.465, the data shows significant variations from month to month. The vertical axis represents the frequencies, while the horizontal axis represents GDP. This graph helps in understanding the impact of economic factors on GDP, suggesting that there are substantial variations concerning the variables that influence Kosovo's GDP (Figure 12).
Figure 13. Legend information impact import in GDP with time delay (2007-2023)
The XGRAPH chart highlights the impact of imports on Kosovo's GDP from 2007 to 2023. The vertical axis, LagFC, represents final consumption expenditures, a key component driving GDP growth. Variations in LagFC (71.3 to 92.4) suggest a link between consumption and GDP growth both in the short and long term. Changes in LagGDP (from -1.4 to 5.77) show how past economic activity influences future GDP growth (Figure 13).
Figure 14. Legend information impact export in GDP with time delay (2007-2023)
Figure 14 provides insight into the impact of exports on Kosovo's GDP from 2007 to 2023, helping analyze aspects of economic growth acceleration and the effects of exports. Variations in LagXM (from 17 to 80.6) suggest a link between exports and GDP growth in both the short and long term. Changes in LagGDP (ranging from -11 to 5.77) indicate how past economic activities influence future GDP growth, suggesting that while exports may have an immediate impact on Kosovo’s economy, there may also be delays in their effect on GDP.
H2: The relationship between annual GDP growth in Kosovo and the variables of imports, exports, and final consumption is statistically significant and positive.
Table 18 presents Spearman's rho correlation coefficients between four variables: GDP, Final Consumption Expenditure (FCE), Exports (EXP), and Imports (IMP). The significance level (Sig. 2-tailed) is also provided, indicating whether the correlation is statistically significant.
The results of the Spearman’s rho analysis for the Correlations between the variables Lag_GDP, LagFCE, LagIMP, and LagEXP reveal different relationships among these economic factors:
The correlation between Lag_GDP and LagFCE is 0.310, indicating a moderately weak but statistically significant positive relationship (p = 0.002), suggesting that an increase in GDP may stimulate growth in consumption expenditures. Meanwhile, Lag_GDP and LagIMP have a correlation of 0.583, showing a strong and statistically significant positive relationship (p = 0.000), confirming that GDP growth is closely linked to import growth, a common phenomenon in expanding economies. Finally, the correlation between Lag_GDP and LagEXP is 0.055, indicating a very weak and insignificant relationship (p = 0.589), suggesting that GDP has no notable impact on exports.
Table 18. Correlations
|
|
Lag_GDP |
LagFCE |
LagIMP |
LagEXP |
||
|
Spearman's rho |
LagGDP |
Correlation Coefficient |
1.000 |
.310** |
.583** |
.055 |
|
Sig. (2-tailed) |
. |
.002 |
.000 |
.589 |
||
|
N |
100 |
100 |
100 |
100 |
||
|
LagFCE |
Correlation Coefficient |
.310** |
1.000 |
-.093 |
-.573** |
|
|
Sig. (2-tailed) |
.002 |
. |
.358 |
.000 |
||
|
N |
100 |
100 |
100 |
100 |
||
|
LagIMP |
Correlation Coefficient |
.583** |
-.093 |
1.000 |
.700** |
|
|
Sig. (2-tailed) |
.000 |
.358 |
. |
.000 |
||
|
N |
100 |
100 |
100 |
100 |
||
|
LagEXP |
Correlation Coefficient |
.055 |
-.573** |
.700** |
1.000 |
|
|
Sig. (2-tailed) |
.589 |
.000 |
.000 |
. |
||
|
N |
100 |
100 |
100 |
100 |
||
|
**. Correlation is significant at the 0.01 level (2-tailed). |
||||||
The correlation between LagFCE and LagIMP is -0.093, indicating a very weak negative and statistically insignificant relationship (p = 0.358), suggesting that final consumption expenditures have no significant impact on imports. Meanwhile, LagFCE and LagEXP have a correlation of -0.573, representing a moderately strong and statistically significant negative relationship (p = 0.000), where an increase in domestic consumption may reduce the demand for exported goods. Lastly, the correlation of 0.700 between LagIMP and LagEXP indicates a strong positive relationship, suggesting that an increase in imports may contribute to export growth through imported goods.
These results indicate that Kosovo’s economy has a strong relationship between GDP growth and imports, while the link between GDP and exports is very weak. The increase in consumption expenditures has a negative correlation with exports but a weak correlation with imports. Imports and exports are closely interconnected, reflecting the impact of international trade on Kosovo’s economy.
The discussion of the study's results examines the findings in relation to existing literature, revealing both supporting evidence and contrasting views. The results offer valuable insights into the role of imports, final consumption, and exports in driving Kosovo's GDP growth, highlighting key implications for economic policy. The analysis using the 2SLS model shows that final consumption has the largest impact on GDP, confirming that economic growth is predominantly fueled by domestic demand. Imports also have a significant influence on GDP, suggesting a strong reliance on foreign goods and services. However, exports have a smaller effect, reflecting the underdeveloped export sector in Kosovo's economy. This situation makes Kosovo vulnerable to external factors and limits its ability to achieve sustainable growth, as it faces high import dependence and a weak export base.
Imports as a Key Factor in GDP Growth: This study finds that a 1% increase in imports leads to a 16.9% rise in GDP, aligning with Carrasco et al. [24], who highlight the importance of imports in economic development, particularly capital goods and technology. Dominance of Final Consumption in GDP: The study shows that a 1% increase in final consumption impacts GDP by 70.3%, consistent with Keynes [59], who emphasized the role of consumption in stimulating production and employment. Stiglitz [10] underscores that well-managed consumption is crucial for economic stability. Studies by Sudibyo [78] confirm the link between domestic consumption and economic growth in Eastern Europe, while Almasifard and Saeedi [81] also find significant impacts in various regions. Limitation of Exports on GDP Growth: Unlike traditional theories, this study finds exports have a limited effect (1.9%) on Kosovo's GDP. This aligns with Akermi et al. [23], who found no significant relationship between exports and economic growth in Albania. Similar findings are reported by Bakari et al. [64] for Kazakhstan, and Awokuse [72] for Eastern Europe, where imports have a greater effect than exports.
Exports as a Key Factor for Economic Growth- Ninka and Pere [65] applied the gravity model to the Western Balkans and found that exports were positively influenced by trade with the EU and industrialized countries, suggesting a more significant role of exports in economic development. Mançellari and Xhepa [69] identified a strong correlation between trade volume growth and GDP in Albania, implying that exports may be more important than indicated in Kida’s study. Helpman and Krugman [9] emphasize that open trade enhances productivity and innovation, making exports a crucial driver of economic growth. Weak Link Between Final Consumption and Economic Growth- Lestari and Ignatia [79] analyzed household consumption, government expenditures, and per capita income in the Sidoarjo region, finding that government spending had no significant impact on economic growth, challenging Kida’s assertion of consumption dominance in economic expansion. Folbre [77] argues that inequality in income and time distribution affects how consumption translates into economic growth, indicating a more complex effect rather than a simple linear increase. Rodriguez and Rodrik [28] stress that economic growth cannot rely solely on consumption, as sustainable investment and innovation are necessary. Imports as a Negative Factor for Economic Development- Zeneli et al. [70] examined trade in the Balkans and found that agreements like Open Balkan have failed to establish a stable trade gravity center, suggesting that reliance on imports may not be a successful long-term strategy for economic growth. Felbermayr et al. [19] argue that high import dependence can lead to increased unemployment and economic vulnerability, contradicting this study conclusions on the positive impact of imports. Topalova [22] found that excessive reliance on imports can result in chronic trade deficits and slow the development of domestic production sectors in developing countries like Kosovo.
In conclusion, the study highlights the significant role of final consumption in driving Kosovo's GDP growth, with imports also playing a notable part in economic development. However, the limited impact of exports indicates the need to strengthen the export sector for sustainable growth. Kosovo should focus on improving the competitiveness of domestic sectors and promoting investments in technology and human capital to diversify growth sources and reduce dependence on imports.
Kosovo's economy has shown rapid growth in recent years, primarily supported by the services sector, especially trade and tourism linked to the diaspora. However, industry and construction have contributed less to this growth. The increase in private consumption and fixed investments has helped support this development, while imports have had a negative impact, outpacing exports and widening the current account deficit. The study shows that imports and final consumption have a significant impact on GDP growth, while exports have a smaller effect.
The model most aligned with the findings of this study is a combination of Keynesian theory and the Prebisch-Singer hypothesis: i) Kosovo's economy is based on consumption and imports (Keynesian Model); ii) Exports do not play a major role in economic growth (Challenge to Ricardo, cite, Research and Information System for Developing Countries [112] argued that developing countries rely heavily on imports and have difficulty developing their export industries. iii) Kosovo is dependent on external sources such as remittances and imports (Dependency Theory). Kosovo relies on external sources like remittances and imports and needs policies that stimulate domestic production and export sector development to achieve sustainable economic growth.
This analysis strengthens the argument of this study for the need for balanced policies that foster investments and technological development to enhance Kosovo's economic structure. Lestari and Ignatia [79] also highlight the importance of policies that encourage exports through improved productivity and strategic investments. Additionally, Rudrappa and Veerabhadrappa [68] recommend that countries with small economies implement strategies to diversify their export markets in order to decrease reliance on imports and promote economic growth.
In this study, imports and final consumption have been identified as important factors for GDP growth, while exports have a smaller impact. This is in line with the Cobb-Douglas theory, which suggests that consumption (as a component of aggregate demand) and imports (as external factors influencing the domestic economy) can have a significant impact on economic growth. However, one feature of the Cobb-Douglas model is that production factors, such as capital and labor, have a more direct impact on production, and in this context, the study should have also considered other variables, such as the importance of investments in production and the development of domestic sectors, in order to achieve more sustainable and balanced growth.
In conclusion, addressing these structural challenges requires policy reforms that encourage innovation, domestic investments, and export-led growth. By reducing reliance on imports and leveraging its resources for competitive advantages, Kosovo can pave the way for more sustainable economic development.
6.1 Recommendations for Kosovo
i) Strengthening the Export Sector: Diversifying export products: Kosovo should focus on developing and diversifying its export products, especially in sectors such as agriculture, renewable energy, and IT, to increase export opportunities. Improving export infrastructure: Expanding trade opportunities and enhancing the quality of products can help boost competitiveness in international markets. Supporting small and medium-sized enterprises (SMEs): This sector has opportunities to increase exports of local products and create partnerships with international companies.
ii) Enhancing Domestic Competitiveness: Support for innovation and technology: Kosovo needs to invest in the development of new technologies to increase productivity and competitiveness in local industries. Improving investment conditions: Creating more favorable conditions for both foreign and local investors, including easing bureaucracy and providing fiscal and tax incentives. Developing workforce skills: Schools and higher education institutions should focus on developing new skills aligned with market demands, especially in fields that contribute to economic development, such as engineering and IT.
iii) Reducing Import Dependence: Encouraging domestic production: Kosovo could focus on strengthening domestic industries, especially in sectors with growth and competitive potential, such as agriculture and renewable energy production. Improving regional market linkages: Leveraging regional trade agreements to increase internal trade and boost export opportunities for Kosovar businesses.
iv) Investing in Human Resources and Technological Capacities: Support for research and development (R&D): Kosovo should create programs to support scientific research and technological development, providing opportunities for innovations that can contribute to the growth of various sectors. Improving access to finance for startups and innovators: By creating funds and opportunities to finance new ideas and product developments, Kosovo can benefit from modern technologies and create job opportunities.
v) Policies for Economic Stability and Reducing Consumption Dependence: Developing a sustainable growth model: Kosovo needs to develop policies that encourage sustainable investments, as well as include strategies that improve financial systems and create opportunities for revenue diversification. Increasing government transparency and accountability: Strengthening the role of institutions overseeing economic policy and increasing trust in institutions to encourage sustainable investments.
These recommendations are essential for developing a sustainable and balanced economy for Kosovo, increasing domestic competitiveness, and reducing dependence on external factors.
6.2 Study limitations
The potential limitations of this study include several important aspects that may affect the interpretation and application of the results. The use of a short time period (2007-2023) may not fully capture the impacts of global economic crises or changes in domestic policies that occurred before 2007 or after 2023. A longer period might have provided a more accurate picture of current developments. Additionally, while variables such as imports, final consumption, and exports are included, there may be other factors influencing GDP, such as foreign direct investments, technology, human resource development, or government policies, which were not considered in this study. Furthermore, although MLR and 2SLS models are useful for assessing the impact of various variables, they may not fully reflect the dynamic and complex relationships between these variables and GDP. A model like Fixed and Random Effects could have been a better choice for capturing these influences in more detail. Lastly, the study focuses primarily on the sectors of imports, exports, and final consumption, leaving out other significant sectors of the economy, such as services, industry, or technology, which may also have a substantial impact on GDP growth. These limitations may influence the accuracy and application of the study’s findings, but they also present opportunities for further research and the development of other models that could include a broader range of factors and longer time periods.
Nakije Kida, Remzi Smajli, Medain Hashani, Vesa Morina, Julinda Morina, Florije Miftari: Validation, Supervision, Writing – original draft, Methodology. Nakije Kida, Remzi Smajli, Medain Hashani, Vesa Morina, Julinda Morina, Florije Miftari: Writing – review and editing, Nakije Kida, Vesa Morina dhe Julinda Morina; Writing – original draft, Visualization. Remzi Smajli, Medain Hashani, Vesa Morina and Julinda Morina, Nakije Kida, Florije Miftari: Software, Sources, Project administration, Conceptualization. Nakije Kida, Julinda Morina, Remzi Smajli and Vesa Morina: Methodology, Investigation, Formal analysis, Data curation.
Our gratitude to the AAB College for funding the scientific article.
[1] European Bank for Reconstruction and Development. (2024). Navigating policy industrial: 2024-25 transition report. https://www.ebrd.com/publications/transition-.
[2] WIIW. (2025). Kosovo economic indicators. https://wiiw.ac.at/kosovo-overview-ce-.html#:~:text=We%20estimate%20that%20in%202024,2023%20to%201.6%25%20in%202024.
[3] The World Bank. (2024). World development indicators. https://databank.worldbank.org/source/world-development-indicators, accessed on Jan. 15, 2025.
[4] ILOSTAT. (2022). Country profiles: Kosovo. https://ilostat.ilo.org/data/country profiles/?ref_area=KOS, accessed on Jan. 14, 2025.
[5] World Bank. (2024). Personal remittances, paid (current US$) – Kosovo. https://data.worldbank.org/indicator/BM.TRF.PWKR.CD.DT?locations=XK.
[6] European Commission. (2024). EU candidate countries’ and potential candidates’ economic quarterly (CCEQ) Q4 2023. https://economyfinance.ec.europa.eu/document/download/00bb7307-1694-4c7e-99de-5c3e662b2172_en?filename=tp070_en.pdf.
[7] World Bank. (2024). World development indicators and are measured in constant 2015 US dollars. https://databank.worldbank.org/source/world-development-indicators.
[8] FRED. (2023). U.S. Dollars to Euro Spot Exchange Rate. https://fred.stlouisfed.org/series/AEXUSEU.
[9] Helpman, E., Krugman, P. (1987). Market Structure and Foreign Trade: Increasing Returns, Imperfect Competition, and the International Economy. MIT Press.
[10] Stiglitz, J.E. (1994). Economic growth revisited. Industrial and Corporate Change, 3(1): 65-110. https://doi.org/10.1093/icc/3.1.65
[11] Ricardo, D. (1817). On the Principles of Political Economy and Taxation. John Murray.
[12] American Economic Association. (2017). Journal Economic Perspective. https://www.aeaweb.org/journals/jep.
[13] Adam Smith Institute. (2024). David Ricardo, among the brightest and best – and richest. https://www.adamsmith.org/blog/david-ricardo-among-the-brightest-and-best-and-riche.
[14] Carbajal-De-Nova, C. (2024). Cobb-Douglas simulation: United States and Mexico. Análisis Económico, 39(101): 99-119. https://www.scielo.org.mx/scielo.php?script=sci_arttex&pid=S2448-66552024000200099&lng=pt&nrm=iso.
[15] Harrison, A., Rodríguez-Clare, A. (2010). Trade, foreign investment, and industrial policy for developing countries. Handbook of Development Economics, 5: 4039-4214. https://doi.org/10.1016/B978-0-444-52944-2.00001-X
[16] De Loecker, J., Goldberg, P.K. (2014). Firm performance in a global market. Annual Review of Economics, 6(1): 201-227. https://doi.org/10.1146/annurev-economics-080113-104741
[17] Ahn, J., Dabla‐Norris, E., Duval, R., Hu, B., Njie, L. (2019). Reassessing the productivity gains from trade liberalization. Review of International Economics, 27(1): 130-154. https://doi.org/10.1111/roie.12364
[18] Trefler, D. (2004). The long and short of the Canada-US free trade agreement. American Economic Review, 94(4): 870-895. https://doi.org/10.1257/0002828042002633
[19] Felbermayr, G., Prat, J., Schmerer, H.J. (2011). Trade and unemployment: What do the data say? European Economic Review, 55(6): 741-758. https://doi.org/10.1016/j.euroecorev.2011.02.003
[20] Costinot, A., Rodríguez-Clare, A. (2014). Trade theory with numbers: Quantifying the consequences of globalization. In Handbook of International Economics. Elsevier, 197-261. https://doi.org/10.1016/B978-0-444-54314-1.00004-5
[21] Khandelwal, A., Fajgelbaum, P. (2013). Measuring the Unequal Gains from Trade. In 2013 Meeting Papers (No. 456). Society for Economic Dynamics. https://ideas.repec.org/p/red/sed013/456.html.
[22] Topalova, P. (2007). Trade liberalization, poverty and inequality: Evidence from Indian districts. In Globalization and Poverty. University of Chicago Press, pp. 291-336.
[23] Akermi, N., Ben Yedder, N., Bakari, S. (2023). Impact of final consumption, domestic investment, exports, and imports on economic growth in Albania. In Theoretical and Applied Economics. Spring, pp. 231-252.
[24] Carrasco, C.A., Tovar-García, E.D. (2021). Trade and growth in developing countries: The role of export composition, import composition and export diversification. Economic Change and Restructuring, 54(4): 919-941. https://doi.org/10.1007/s10644-020-09291-8
[25] Bernanke, B.S. (2001). NBER Macroeconomics Annual 2000. MIT Press.
[26] Solow, R.M. (1956). A contribution to the theory of economic growth. The Quarterly Journal of Economics, 70(1): 65-94.
[27] Swan, T.W. (1956). Economic growth and capital accumulation. In Palgrave Studies in the History of Economic Thought. Palgrave Macmillan, Cham. https://doi.org/10.1007/978-3-031-23807-9_17
[28] Rodriguez, F. (2000). Trade Policy and Economic Growth: A Skeptic’s Guide to the Cross-National Evidence. NBER Macroeconomics Annual/MIT Press.
[29] Kosovo Agency of Satatistic. (2024). Foreign Trade. https://askdata.rks-gov.net/pxweb/sq/ASKdata/ASKdata__External%20trade__Yearly%20indicators/tab04.px/.
[30] Cobb, C.W., Douglas, P.H. (1928). A theory of production. The American Economic Review, 18(1): 139-165. https://msuweb.montclair.edu/~lebelp/CobbDouglasProdAER1928.pdf.
[31] Helpman, E., Itskhoki, O., Muendler, M.A., Redding, S.J. (2016). Trade and inequality: From theory to estimation. The Review of Economic Studies, 84(1): 357-405. https://academic.oup.com/restud/article-abstract/84/1/357/2669956
[32] Heckscher, E., Ohlin, B. (1933). International and Inter-Regional Trade.
[33] Huang, D., Yenina, M., Hossain, M.E. (2020). Kazakhstan in China’s belt and road initiative: An empirical analysis of extensive and intensive margins of trade. Chinese Studies, 10(1): 1. https://doi.org/10.4236/chnstd.2021.101001
[34] Krugman, P.R. (1981). Intraindustry specialization and the gains from trade. Journal of political Economy, 89(5): 959-973.
[35] Melitz, M.J. (2003). The impact of trade on intra‐industry reallocations and aggregate industry productivity. Econometrica, 71(6): 1695-1725.
[36] Warner, A., Sachs, J. (1995). Economic reform and the process of global integration. Brookings Papers on Economic Activity, 1: 1-118.
[37] Krueger, A.O. (2008). The political economy of the rent-seeking society. In 40 Years of Research on Rent Seeking 2. Springer, Berlin, Heidelberg.
[38] Tong, H., Wei, S.J. (2014). Does trade globalization induce or inhibit corporate transparency? Unbundling the growth potential and product market competition channels. Journal of International Economics, 94(2): 358-370. https://doi.org/10.1016/j.jinteco.2014.08.004
[39] Ventura, J. (1997). Growth and interdependence. The Quarterly Journal of Economics, 112(1): 57-84. https://doi.org/10.1162/003355397555127
[40] Krugman, P. (1994). The myth of Asia’s miracle. Foreign Affairs, 73(6): 62-78. https://doi.org/10.2307/20046929
[41] Wacziarg, R., Welch, K.H. (2008). Trade liberalization and growth: New evidence. The World Bank Economic Review, 22(2): 187-231. https://doi.org/10.1093/wber/lhn007
[42] J Singh, T. (2010). Does international trade cause economic growth? A survey. The World Economy, 33(11): 1517-1564. https:///doi.org/10.1111/j.1467-9701.2010.01243.x
[43] Kosovo Agency of Satatistic. (2024).Time series. https://askdata.rks-gov.net/pxweb/sq/ASKdata/ASKdata__External%20trade__Yearly%20indicators/tab04.px/.
[44] Central Bank of Kosovo. (2024). Foreign direct investments: The countries that have invested the most in Kosovo, 2007-2022. https://bqk-kos.org/edu/wp-content/uploads/2024/09/IHD-pdf-2.pdf.
[45] Central Bank of Kosovo. (2024). Time series. Financial and monetary statistic. https://bqk-kos.org/statistikat/serite-kohore/.
[46] Kosovo Agency of Statistics. (2024). Harmonized Index of Consumer Prices. (HICP). https://ask.rks-gov.net/Releases/Details/8171.
[47] Central Bank of Kosovo. (2024). Statistical function of CBK. https://bqk-kos.org/statistikat/?lang=en.
[48] Central Bank of Kosovo. (2024). Departament of i Statistics.
[49] IMF. (2024). Datamapper: GDP, current prices. https://www.imf.org/external/datamapper/profile/BIH, accessed on Apr. 12, 2024.
[50] Kosovo Agency of Statistics. (2024). Harmonized Index of Consumer Prices. (HICP). https://ask.rks-gov.net/Releases/Details/8171.
[51] Ricardo. (1965). From the principles of political economy and taxation. World Scientific-Connecting Great Minds. https://doi.org/10.1142/9789812701275_0014
[52] Britannica Money. (2025). David Ricardo, British Economist. https://www.britannica.com/money/David-Ricardo#ref138680.
[53] Ruffin, R.J. (2017). Ricardo and international trade theory. In Ricardo and International Trade. Routledge, pp. 20-32.
[54] Stigler, G.J. (1952). The Ricardian theory of value and distribution. Journal of Political Economy, 60(3): 187-207. https://doi.org/10.1086/257208
[55] Kuznets, S. (1955). Economic growth and income inequality. American Economic Review. https://assets.aeaweb.org/asset-server/files/9438.pdf.
[56] Solow, R.M. (1956). A contribution to the theory of economic growth. The Quarterly Journal of Economics, 70(1): 65-94. https://doi.org/10.2307/1884513
[57] Romer, P.M. (1986). Increasing returns and long-run growth. Journal of Political Economy, 94(5): 1002-1037.
[58] Keynes, J.M. (1937). The general theory of employment. The Quarterly Journal of Economics, 51(2): 209-223. https://doi.org/10.2307/1882087
[59] Krugman, P.R. (1985). Increasing returns and the theory of international trade. Working Paper No. 175. https://doi.org/10.3386/w1752
[60] Balassa, B. (1978). Exports and economic growth: Further evidence. Journal of development. Economics, 5(2): 181-189. https://doi.org/10.1016/0304-3878(78)90006-8
[61] Feder, G. (1983). On exports and economic growth. Journal of Development Economics, 12(1-2): 59-73. https://doi.org/10.1016/0304-3878(83)90031-7
[62] Trabelsi, E., Kachout, N. (2024). Agricultural exports, other exports, imports, and economic growth: An ARDL approach for Tunisia. Journal of Economic Analysis, 3(3): 173-189. https://doi.org/10.58567/jea03030010
[63] Bakari, S., Fakraoui, N., Mabrouki, M. (2020). The contribution of domestic investment, exports, and imports on economic growth: A case study of Peru. MPRA Paper 99041. https://mpra.ub.uni-muenchen.de/99041/1/MPRA_paper_99041.pdf.
[64] Bakari, S., Fakraoui, N., Tiba, S. (2019). Domestic investment, export, import, and economic growth in Brazil: An application of vector error correction model. MPRA Paper 95528, University Library of Munich, Germany. https://mpra.ub.uni-muenchen.de/95528/.
[65] Ninka, E., Pere, E. (2017). International trade in western Balkan countries: Analysis based on the gravity model (No. 126). Wiiw Balkan Observatory Working Papers. https://www.econstor.eu/handle/10419/226164.
[66] Kim, S., Lim, H., Park, D. (2007). Could imports be beneficial for economic growth? Some evidence from Republic of Korea (No. 103). ERD Working Paper Series. https://coilink.org/20.500.12592/.
[67] Vardari, D.S.L. (2015). Relationship between import-exports and economic growth: The Kosova case study. Revista Shkencore Regjionale (REFORMA), 3: 262-269. http://doi.org/10.2139/ssrn.2889731
[68] Rudrappa, K.M., Veerabhadrappa, B.P. (2024). International trade and economic development. International Journal for Multidisciplinary Research, 6: 1-6.
[69] Mançellari, A., Xhepa, S. (2004). Trade and economic development. ACIT Working Paper Series. https://acit.al/wp-content/uploads/2021/04/Trade-and-Economic-Development_8D.pdf.
[70] Zeneli, G., Benga, A., Hoti, A. (2024). Analysis of Albania’s trade direction: Is the open Balkan a new center of gravity? Economies, 12(7): 176. https://doi.org/10.3390/economies12070176
[71] Syzdykova, A., Abubakirova, A., Kelesbayev, D., Omarova, A., Amaniyazova, G., Saubetova, B., Anshayeva, D. (2019). The effect of export and imports on national income in Kazakhstan: Econometric analysis. Revista Espacios, 40(35): 22-36. http://www.1.revistaespacios.com/a19v40n35/a19v40n35p22.pdf.
[72] Awokuse, T.O. (2008). Trade openness and economic growth: is growth export-led or import-led? Applied Economics, 40(2): 161-173. https://doi.org/10.1080/00036840600749490
[73] Deaton, A. (2020). GDP and beyond. https://apps.bea.gov/scb/issues/2020/06-june/pdf/0620-beyond-gdp-deaton.pdf.
[74] Trading Economics. (2025). Household Final Consumption Expenditure in Kosovo. https://tradingeconomics.com/kosovo/household-final-consumption-expenditure-annual-percent-growth-wb-data.html.
[75] Central Bank of Kosovo. (2025). Time series, Remittances in Kosovo. https://view.officeapps.live.com/op/view.aspx?src=https%3A%2F%2Fbqk-kos.org%2Frepository%2Fdocs%2Ftime_series%2F31%2520Remittances-by%2520channel.xls&lang=en.
[76] Friedman, M. (2018). Theory of the consumption function. http://perseus.iies.su.se/~calmf/Ekonomisk%20politik/InterMacroEc_ht07/Forelasning9_ht07.pdf.
[77] Folbre, N. (2011). Inequality and time use in the household. https://academic.oup.com/edited-volume/34553/chapter-abstract/293168883?redirectedFrom=fulltext.
[78] Sudibyo, I. (2024). Consumption contribution to economy growth. ScienceOpen Preprints. https://www.scienceopen.com/hosted-document?doi=10.14293/S2199-1006.1.SOR-.PPVQHAO.v4.
[79] Lestari, H.P., Ignatia, M.H. (2024). The effect of household consumption expenditure, government expenditure and per capita income on economic growth in Sidoarjo Regency. EKOMBISREVIEW: Jurnal Ilmiah Ekonomi Dan Bisnis, 12(1). https://doi.org/10.14293/S2199-1006.1.SOR-.PPVQHAO.v4
[80] Perrotta, C. (1997). The preclassical theory of development: Increased consumption raises productivity. History of Political Economy (1997), 29(2): 295-326. https://doi.org/10.1215/00182702-29-2-295
[81] Almasifard, M., Saeedi, M. (2017). Financial development and consumption. In 2017 International Conference on Education, Economics and Management Research (ICEEMR 2017). https://doi.org/10.2991/iceemr-17.2017.126
[82] Draper, Norman, R., Smith, H. (1998). Applied Regression Analysis. 3rd ed., John Wiley & Sons.
[83] VSNi. (2024). Simple inear regression. https://vsni.co.uk/blogs/pearson-correlation-vs-simple-linear-regression-2.
[84] Gujarati, D.N. (2004). Basic Econometrics (fourth edit). New Yok: McGraw-Hill Inc.
[85] Measure Evaluation. (2023). Instrumental variables: Two-stage least squares (2SLS). https://www.measureevaluation.org/resources/training/capacity-building-resources/workshop-on-impact-evaluation-of-population-health-and-nutrition-programs/instrumental-variables-two-stage-least-squares-2sls-2013-the-basics.
[86] Freedman, D. (1984). On bootstrapping two-stage least-squares estimates in stationary linear models. The Annals of Statistics, 12(3): 827-842. https://doi.org/10.1214/aos/1176346705
[87] Angrist, J.D., Imbens, G.W. (1995). Two-stage least squares estimation of average causal effects in models with variable treatment intensity. Journal of the American statistical Association, 90(430): 431-442. https://www.tandfonline.com/doi/abs/10.1080/01621459.1995.10476535.
[88] Julius. (2024). Two-Stage Least Squares (2SLS) Regression Analysis. https://julius.ai/articles/two-stage-least-squares-2sls-regression-analysis.
[89] Orji, A., Mba, P.N., Peter, N. (2010). Foreign private investment, capital formation and economic growth in Nigeria: A two stage least square approach. Journal of Economics and Sustainable Development, 6(8): 57-63. https://core.ac.uk/download/pdf/234645419.pdf.
[90] Scott, A.J., Holt, D. (1982). The effect of two-stage sampling on ordinary least squares methods. Journal of the American Statistical Association, 77(380): 848-854. https://www.tandfonline.com/doi/abs/10.1080/01621459.1982.10477897.
[91] Rai, A., Srivastava, A.K. (1998). Estimation of regression coefficient from survey data based on test of significance. Communications in Statistics - Theory and Methods 27(3): 761-773. https://doi.org/10.1080/03610929808832125
[92] Spearman, C. (1961). The proof and measurement of association between two things. In Studies in Individual Differences: The Search for Intelligence. Appleton-Century-Crofts. https://doi.org/10.1037/11491-005
[93] Jolliffe, I.T. (2002). Graphical representation of data using principal components. Principal Component Analysis. Springer, New York, pp. 78-110. https://doi.org/10.1007/0-387-22440-8_5
[94] Jolliffe, I.T. (2002). Principal component analysis and factor analysis. In Principal Component Analysis. Springer, New York, pp. 150-166. https://doi.org/10.1007/0-387-22440-8_7
[95] Kida, N., Smajli, R., Gjuraj, D., Morina, V., Morina, J. (2025). Driving factors of foreign direct investment in Kosovo: The roles of market access and government support. International Journal of Sustainable Development and Planning, 20(1): 433-451. https://doi.org/10.18280/ijsdp.200139
[96] Dickey, D.A., Fuller, W.A. (1979). Distribution of the estimators for autoregressive time series with a unit root. Journal of the American Statistical Association, 74(366a): 427-431. https://doi.org/10.1080/01621459.1979.10482531
[97] Pallavi. (2024). Granger causality in time series – Explained using chicken and egg problem. Analytics Vidhya. https://www.analyticsvidhya.com/blog/2021/08/granger-causality-in-time-series-explained-using-chicken-and-egg-problem/.
[98] Granger, C.W.J. (1969). Investigating causal relations by econometric models and cross-spectral methods. Econometrica, 36: 424-438.
[99] Grange, C.W.J. (1969). Testing for causality and feedback. Econometrica, 37: 424-438. https://doi.org/10.2307/1912791
[100] Granger, C.W.J., Engle, R.F. (1987). Econometric forecasting: a brief survey of current and future techniques. Climatic Change, 11(1): 117-139. https://doi.org/10.2307/1913236
[101] Granger, C.W.J. (1980). Long memory relationships and the aggregation of dynamic models. Journal of Econometrics, 14: 227-238. https://doi.org/10.1016/0304-4076(80)90092-5
[102] Lardic, S., Mignon, V. (2004). Robert F. Engle et Clive WJ Granger prix Nobel d'économie 2003. Revue d'économie Politique, 114(1): 1-15. https://shs.cairn.info/revue-d-economie-politique-2004-1-page-1?tab=texte-integral.
[103] Granger C.W.J. et Joyeux R. (1980). An introduction to long-memory time series models and fractional differentiation. Journal of Time Series Analysis, 1: 15-29. https://doi.org/10.1111/j.1467-9892.1980.tb00297.x
[104] Massey, F.J. (1951). Kolmogorov-Smirnov test for goodness of fit. Journal of the American Statistical Association, 46(253): 68-78. https://doi.org/10.1080/01621459.1951.10500769
[105] GraphPad. (2024). Interpreting results: Kolmogorov-Smirnov test. https://www.graphpad.com/guides/prism/latest/statistics/interpreting_results_kolmogorov-smirnov_test.htm.
[106] Lehmann, E.L. (2006). Nonparametrics: Statistical Methods Based on Ranks (1st ed.). Springer. https://doi.org/10.1007/978-0-387-48148-9
[107] Ogundapo, O., Nche, C., Duffy, A., Zhang, G. (2019). Analyzing handling effects on performance parameters of ethernet cables using the feature selective validation method and Kolmogorov-Smirnov test. American Journal of Electrical and Electronic Engineering, 7(3): 55-61. https://doi.org/10.12691/ajeee-7-3-1
[108] WallStreetMojo. (2024). Breusch-Pagan test - What is it, examples. https://www.wallstreetmojo.com/breusch-pagan.
[109] Breusch, T.S., Pagan, A.R. (1979). The Breusch-Pagan test for heteroskedasticity in a linear regression model. Econometrica, 47(5): 1287-1294.
[110] Kosovo Agency of Statistics. (2024). https://rks-gov.net/.
[111] Research and Information System for Developing Countries. (2019). Raul Prebisch and Development Strategy. https://ris.org.in/sites/default/files/Publication/Raul%20Prebisch%20and%20Development%20Strategy-min.pdf.
[112] Prebisch, R. (1988). Dependence, interdependence and development. CEPAL REVIEW No. 34 United Nations Economics Commission for Latin America and the Carribean. http://repositorio.cepal.org/handle/11362/10242.