Tri Yuni Iswati*![]() | Prabang Setyono
| Prabang Setyono![]() | Evi Gravitiani
| Evi Gravitiani![]() | Ofita Purwani
| Ofita Purwani![]()
© 2025 The authors. This article is published by IIETA and is licensed under the CC BY 4.0 license (http://creativecommons.org/licenses/by/4.0/).
OPEN ACCESS
This study discusses an innovative green infrastructure model as a pilot project in the aerotropolis area of Yogyakarta International Airport (YIA), Indonesia. This study offers an optimal solution that combines environmental sustainability and improving the quality of life in the area around the airport while setting a new standard for the development of similar areas. This study aims to create a simulation model for green infrastructure that can be applied in many urban areas. This method involves comparing microclimate variations under three scenarios: 1) a map representing the existing conditions, 2) a masterplan map proposed by the Provincial Government of Yogyakarta, and 3) an aerotropolis map proposed by the Researcher. The simulation method uses ENVI-met 5.6.1 software to predict real conditions objectively. The results of this study reveal that the optimization of green infrastructure in the aerotropolis of YIA is most effective on the Provincial Government Map, followed by the Researcher's Proposed Map. The combination of both maps offered a superior solution for dynamic and sustainable urban design. This study presents a green infrastructure simulation model based on ENVI-met 5.6.1 that has the potential to be applied in various urban areas and creates great opportunities for the development of a more balanced and sustainable environment.
green infrastructure, UHI, simulation, environment, urban, sustainable
Green infrastructure is a network of green spaces that conserves the values and functions of natural ecosystems and provides associated benefits to human populations [1]. Green infrastructure is a new understanding worthy of being developed in urban areas. This theme is relevant to be applied in existing areas or newly formed areas because of its great benefits in various fields. Green infrastructure provides a framework for sustainable urban growth by integrating natural elements to enhance ecological resilience [2]. Van Oijstaeijen et al. [3] state that green infrastructure provides environmental, economic, and social benefits. Van added that in terms of the environment, green infrastructure reduces the heat island effect and improves air and water quality. Due to recent climate change, anticipating risks at the urban level is considered very important [4]. Regarding the economy, green infrastructure can reduce energy needs through shading and insulation mechanisms; property values can increase and support sustainable development. In terms of the social aspect, green infrastructure can provide recreational space and reduce urban stress, encouraging community interaction and building better social relations in society [3].
The concept of green infrastructure includes several elements, such as green space, water management, climate, energy efficiency, air quality, microclimate, biodiversity, green mobility, and waste management [5]. Green infrastructure elements might include green roofs, trees, and roads [6]. As stated by Ye et al. [4], Evola et al. [7], and Cortes et al. [8], innovative designs like green roofs, solar panels, green walls, and effectively reflective materials can reduce the effect of Urban Heat Island (UHI) as well as increases the efficiency of energy building by the climatic conditions.
Green infrastructure is a crucial strategy for creating sustainable cities because it can reduce environmental impacts by cooling urban areas, supporting biodiversity, and improving human well-being [9]. The implementation of green strategies such as vegetation, sustainable design, and environmentally friendly materials has also been shown to significantly improve industrial microclimates and air quality, reduce negative environmental impacts, and improve the well-being of workers and surrounding communities [10].
A study by Ren et al. [11] highlights that the UHI has a significant impact on outdoor thermal comfort, health, and the quality of life of urban communities. The UHI phenomenon occurs when temperatures in urban areas rise significantly compared to the surrounding areas. Therefore, effective mitigation strategies are needed to reduce its impact. The main factors triggering UHI include minimal vegetation, the dominance of materials with high thermal properties, and human activities. UHI has a wide-ranging impact, including a decrease in thermal comfort in open spaces and an increase in energy consumption for cooling [12]. In this case, green infrastructure is a solution to reduce the UHI effect.
The issue of implementing green infrastructure as an effort to mitigate UHIs has become a concern for several countries around the world. A study in Sydney showed that sustainable city design improves thermal comfort, reduces energy consumption, and improves quality of life through heat reduction strategies to address UHI and climate change [13]. Meanwhile, in Colombo, ENVI-met was used to test the best green infrastructure scenario for reducing the impact of UHI [12].
Kasarda [14] predicts that an aerotropolis will grow into a center of globalization and a future metropolitan city core that will change the way of life and business and be used as a reference for planning new urban projects [15]. This growth pattern is feared to bring ecological side effects, one of which is UHI, which can actually be mitigated by green infrastructure planning.
Citing Linke et al. [16] and Lombardía and Gómez-Villarino [17], efforts to reduce UHIs require building restrictions and green space management. However, developing countries face more difficult and costly challenges in implementing GI, such as land conflicts and lack of government support. Although green infrastructure planning is more complex than conventional planning, the benefits significantly reduce climate change and maintain environmental stability.
This study offers an ENVI-met simulation model to create green infrastructure that can be applied in various urban areas. The case study is YIA in the Special Region of Yogyakarta, Indonesia, which was inaugurated in 2020.
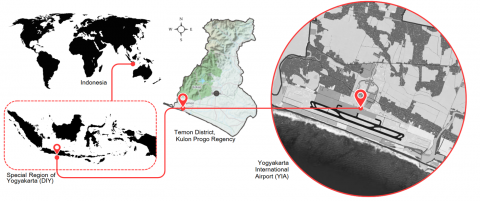
This study uses a mixed method approach between quantitative and qualitative. The study took place at Yogyakarta International Airport (YIA) which is located in Temon District, Kulon Progo Regency, Special Region of Yogyakarta (DIY), Indonesia as shown in Figure 1. This location is geographically located north of the Indian Ocean. The climate data samples needed for the simulation were obtained from the YIA Meteorology, Climatology, and Geophysics Agency on June 20, 2024, at 11.00-12.00.
Figure 1. The location of YIA in Kulon Progo
Weather data suitable for simulation should cover regional and urban-specific conditions to produce more representative results; measured data can be taken from weather stations used to reflect real regional conditions [18]. The data used in the analysis comes from the Meteorology, Climatology, and Geophysics Agency (BMKG), which includes wind speed, temperature, and air pressure, which are then entered into the ENVI-met 5.6.1 simulation to obtain accurate results.
The six main aspects simulated consist of potential air temperature, specific humidity, relative humidity, wind speed, surface albedo, and sky view factor [12]. The simulation method is chosen to model and analyze complex environmental systems, including microclimate and urban environments [19].
ENVI-met is a 3D microclimate model that simulates the interactions between ventilation, energy exchange, radiation, surface impacts, and vegetation. This software provides deep insight into urban climate and thermal comfort, making it suitable to help study environmental phenomena in an area [20]. In addition, ENVI-met is able to model current and future climate scenarios to support the design of climate-resilient urban environments.
Previous study [21] found that the ENVI-met climate model is effective in designing strategies such as adding vegetation, using reflective materials, and optimizing building layouts, significantly reducing ambient temperatures and improving urban residents' thermal comfort.
Research using ENVI-met simulations [12, 22-24] shows that ENVI-met is effective in mapping microclimate, identifying thermal comfort factors, reducing radiant energy and air temperature, and designing UHI mitigation strategies, supporting more resilient urban design to climate change.
The Excel data entered includes variables such as Potential Air Temperature (℃), Specific Humidity (g/kg), Relative Humidity (g/kg), Wind Speed (m/s), View Factor Upward Sky, and Surface Albedo. The data is organized into a grid structure based on the X and Y axes, where each grid cell measures 2 meters. The entire grid consists of 50 × 30 cells, representing a scaled map with 100 m × 60 m dimensions.
The data entered in SPACES ENVI-met includes: Buildings (number and height of buildings); Vegetation (number of green areas and types of plants, i.e., grass, hedge light, cylindric); Sources (i.e., water fountain); and Soil and Surface (i.e., default sandy loam and asphalt road).
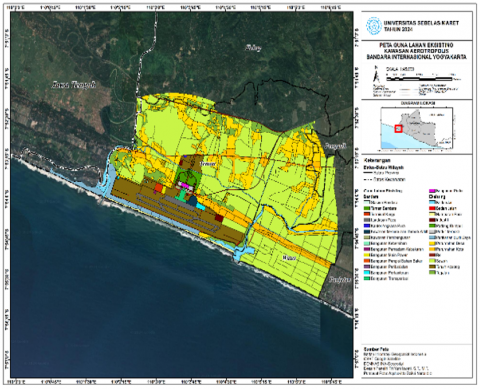
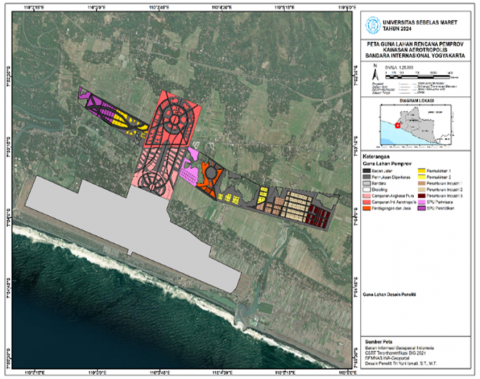
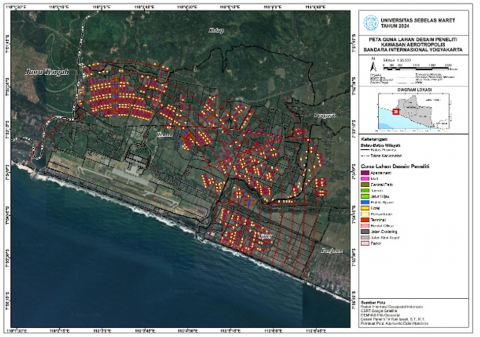
This study simulates and compares the following three aerotropolis conditions.
This study simulates the three aerotropolis conditions using ENVI-met 5.6.1 to analyze the impact of green infrastructure on temperature, humidity, and airflow. It compares the results to determine the optimal conditions for the YIA aerotropolis and support adaptation to climate change.
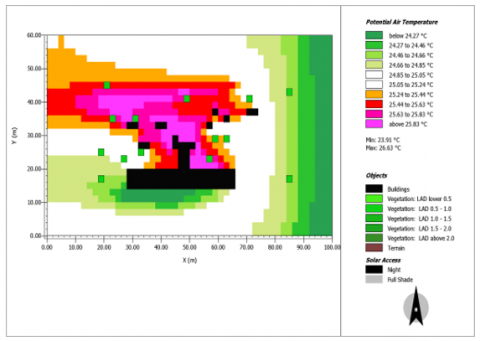
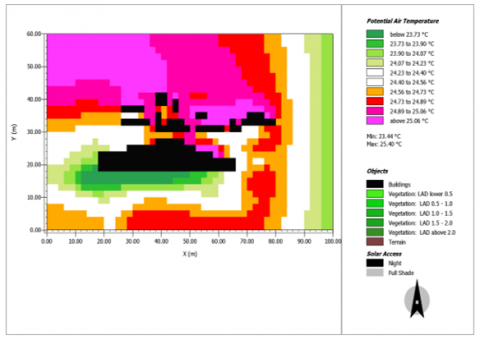
3.1 Potential air temperature
This simulation, as shown in Figure 3, the potential air temperature in an area at a height of 1.8 meters. Potential air temperature affects the UHI, which impacts the thermal comfort of building users.
The Provincial Government Map (Figure 3b) as shown as Figure 3b is the most effective in controlling microclimate, with the lowest maximum temperature (25.04℃), effective vegetation placement, and balanced building distribution. It is followed by the Researcher's Proposed Map (Figure 3c) and lastly, the Existing Map (Figure 3a), which has the highest temperature and less effective vegetation placement.
(a) Existing Map
(b) Provincial Government Map
(c) Researcher’s Proposed Map
Figure 3. Results of potential air temperature simulation
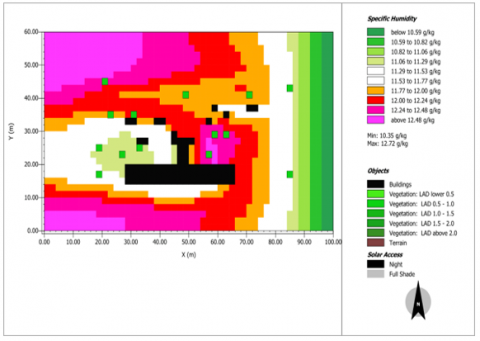
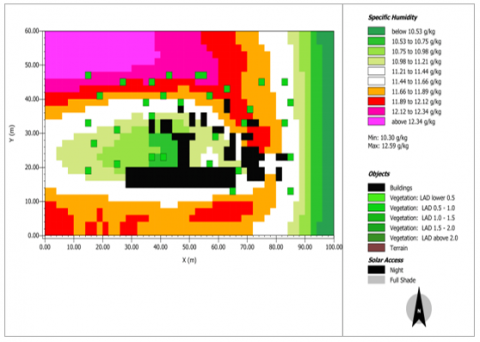
3.2 Specific humidity
Specific humidity in ENVI-met, which is the ratio of the mass of water vapor to the total mass of air, describes the dynamics of the atmosphere and influences the microclimate simulation. High specific humidity can increase air temperature, thereby exacerbating the UHI effect and affecting the thermal comfort of urban residents.
The Researcher's Proposed map and the Provincial Government Map, depicted in Figure 4b and 4c, demonstrate lower maximum humidity levels and better use of vegetation to reduce high humidity zones. The Existing Map as shown in Figure 4a, has more concentrated high humidity zones, especially around buildings, which can result in less comfortable conditions. The Researcher's Proposed Map (Figure 4c) provides the best balance between humidity control and comfort, followed by the Provincial Government Map and the Existing Map.
Figure 4. Results of specific humidity simulation
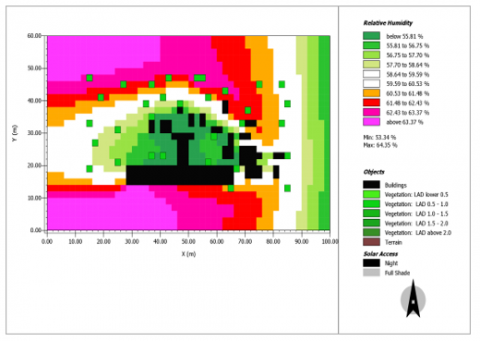
3.3 Relative humidity
Relative humidity, as shown in Figure 5, describes the amount of water vapor in the air compared to the maximum amount the air can hold at a given temperature. Relative humidity by Provincial Government Map (Figure 5b) demonstrates the most stable and uniform distribution, attributed to extensive vegetation coverage and high Leaf Area Density (LAD). This map is appropriate if the goal is to support natural ecosystems and provide even comfort. Furthermore, the Researcher's Proposed Map (Figure 5c) has a greater variation in humidity, so it is suitable for focusing on energy efficiency to reduce the UHI effect in urban areas. Finally, the Existing Map (Figure 5a) shows a more extreme distribution of humidity with a wider area of low humidity.
(a) Existing Map
(b) Provincial Government Map
(c) Researcher’s Proposed Map
Figure 5. Results of relative humidity simulation
3.4 Wind speed
The wind speed simulation at 1.8 m, as shown in Figure 6, shows that all three maps have the highest wind in the eastern open area. Vegetation on all maps significantly reduces wind speed, especially in the central part of the area covered with trees. In terms of wind speed distribution, the Researcher's Proposed Map (Figure 6c) has the best overall wind flow, followed by the Provincial Government Map (Figure 6b), and finally the Existing Map (Figure 6a), which is the least optimal.
(a) Existing Map
(b) Provincial Government Map
(c) Researcher’s Proposed Map
Figure 6. Results of wind speed simulation
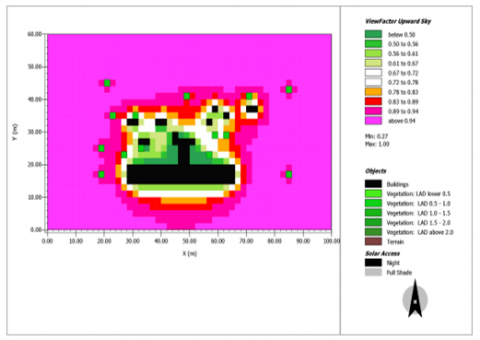
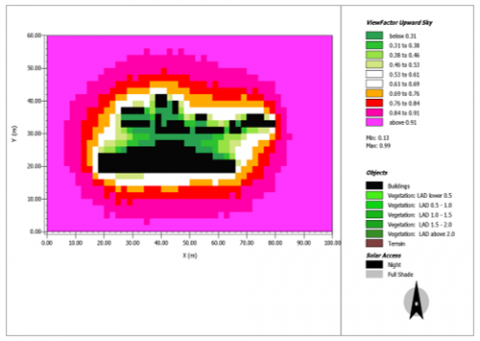
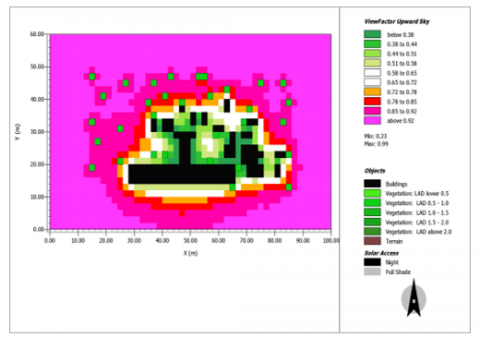
3.5 Sky view factor upward
The Sky-View Factor (SVF), highlighted in Figure 7, is a measure of the proportion of sky visible from a point on the surface, where the higher the sky-view factor, the more open an area is. If the Sky-View Factor (SVF) is low due to the abundance of vegetation and shading, then the intensity of the UHI effect is reduced.
The Provincial Government Map (Figure 7b) has the best overall shading, with the lowest average SVF and a shadier environment that can reduce heat gain. The second position is the Researcher's Proposed Map (Figure 7c), which offers a balanced mix of shading and open areas. The last position is the Existing Map (Figure 7a).
(a) Existing Map
(b) Provincial Government Map
(c) Researcher’s Proposed Map
Figure 7. Results of sky-view factor simulation
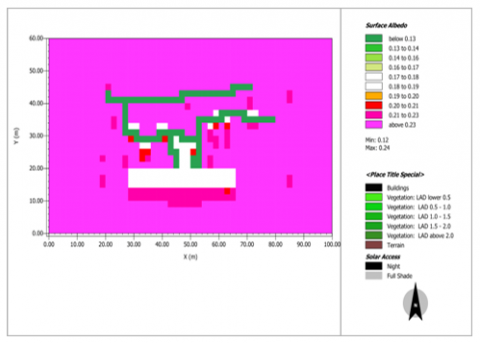
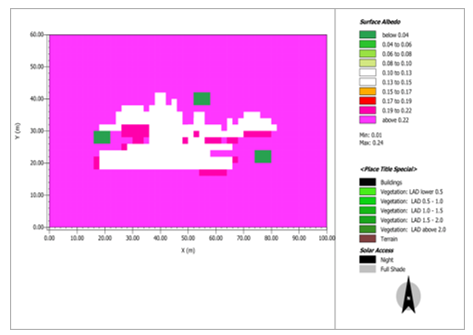
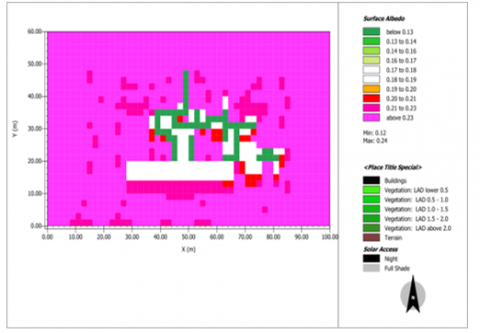
3.6 Surface albedo
Surface albedo refers to the proportion of solar radiation reflected by a surface relative to the total solar radiation it receives. Surfaces with low albedo increase the UHI effect by absorbing more heat, while surfaces with high albedo can reduce the UHI by reflecting solar radiation.
As shown in Figure 8, the Existing Map (Figure 8a) and the Researcher's Proposed Map (Figure 8c) appear comparable. In some areas, the former has better vegetation distribution and higher albedo surfaces, leading to lower heat absorption than the provincial government map. The Provincial Government Map (Figure 8b) has a larger area of low albedo.
The simulation results indicate that the Provincial Government Map excels most in controlling air temperature and relative humidity due to its extensive and strategic vegetation distribution. This provides superior thermal comfort through lower temperatures, stable relative humidity, and reduced heat absorption caused by a lower Sky-View Factor (SVF). Furthermore, the Researcher's Proposed Map offers an optimal balance between vegetation placement, energy efficiency, and wind flow distribution. In contrast, the Existing Map performs the worst due to the lack of vegetation and inefficient spatial planning. The Existing Map represents the study area’s initial condition as undeveloped natural open land, lacking significant aerotropolis infrastructure. Consequently, the simulation reveals microclimatic weaknesses, such as higher maximum temperatures, uneven humidity distribution, and suboptimal wind flow due to the absence of strategic vegetation. As a baseline, this map provides an initial framework to evaluate microclimate management effectiveness and identify opportunities for sustainable development through well-planned spatial design.
ENVI-met has proven useful in designing green infrastructure that reduces temperature and improves thermal comfort in the YIA aerotropolis area [25-27]. The simulations show that mitigating the heat island effect can be done without limiting the number of buildings. In the YIA aerotropolis case study, rearranging the building layout, using high-albedo materials on roads and sidewalks, also strategically integrating vegetation can significantly reduce heat. This can be seen in the comparison of three maps that show differences in simulation results.
This study proves that although green infrastructure development requires more effort than conventional areas, using ENVI-met can facilitate the design process. In the YIA aerotropolis case study, ENVI-met was used to simulate three maps: the Existing Map, the Yogyakarta Provincial Government Map and the Researcher's Proposed Map. ENVI-met allows for efficient and measurable planning, helping designers identify optimal solutions before implementation. Research by Liu et al. [25], Cortinovis et al. [6], Erlwein et al. [28], and Lombardía and Gómez-Villarino [17] shows that successful implementation of green infrastructure depends on modeling green spaces with ENVI-met, planning elements such as green roofs and trees, collaboration between government, developers, and communities, strategic management, open communication, and supporting policies.
The study shows that ENVI-met 5.6.1 simulation is effective in optimizing green infrastructure in the YIA aerotropolis, with the best results shown by the Provincial Government Map. This map has the lowest maximum temperature (25.40℃) and stable relative humidity, attributed to the wide distribution of vegetation with high Leaf Area Density (LAD) and efficient spatial planning, effectively minimizing the UHI effect. The Researcher's Proposed Map stands out in the distribution of wind speed, thus creating optimal natural ventilation and improving air quality. The combination of elements from both maps can create a sustainable and efficient aerotropolis design that supports the stability of the microclimate in this area.
Meanwhile, the Existing Map reveals microclimatic weaknesses due to the area's lack of significant aerotropolis development. To optimize the area represented by the Existing Map, strategic vegetation placement, spatial planning optimization, the use of high-albedo materials, and further simulations with ENVI-met are required to design a more effective layout.
Theoretically, this study enriches the literature by presenting a data-driven microclimate simulation approach to support sustainable aerotropolis planning. The findings provide new insights into the role of green space design in urban microclimate management. Practically, the study can guide stakeholders in designing environmentally friendly aerotropolis. Green infrastructure can reduce energy needs for air conditioning and support the transition to low-carbon cities. The simulation-based approach helps reduce planning risks by providing measurable and optimal solutions before implementation.
The research results are also relevant globally, especially for tropical regions or metropolitan cities that face similar challenges, such as the heat island effect and energy efficiency. Application of the model in various urban areas can produce empirical data to accelerate the development of more effective and sustainable green infrastructure. This research model can potentially accelerate the transition to a healthier and more comfortable urban environment.
This study has several limitations, such as simulations that are only conducted at one point in time and certain weather conditions, so they do not cover variations in time and season. Future research is recommended to carry out long-term simulations with various weather conditions and seasons, as well as linking socio-economic analysis for a better understanding of green infrastructure. Collaborative roles between urban planners, economists, and environmental engineers are needed to provide more comprehensive solutions.
Adopting green infrastructure is not only a solution to reduce the heat island effect but also a strategic step in facing the global climate crisis. Green infrastructure is a long-term investment in creating cities that are more efficient, sustainable, and adaptive to future climate challenges.
The authors would like to give gratitude to the relevant institutions, including BMKG YIA, PT Angkasa Pura 1 YIA, the Land and Spatial Planning Agency of the Special Region of Yogyakarta (DIY), and the Land and Spatial Planning Agency of Kulon Progo.
[1] Benedict, M.A., McMahon, E.T. (2002). Green infrastructure: Smart conservation for the 21st century. Green Infrastructure, 20(3): 12-17.
[2] Ma, Q., Li, Y., Xu, L. (2021). Identification of green infrastructure networks based on ecosystem services in a rapidly urbanizing area. Journal of Cleaner Production, 300: 126945. https://doi.org/10.1016/j.jclepro.2021.126945
[3] Van Oijstaeijen, W., Van Passel, S., Cools, J. (2020). Urban green infrastructure: A review on valuation toolkits from an urban planning perspective. Journal of Environmental Management, 267: 110603. https://doi.org/10.1016/j.jenvman.2020.110603
[4] Ye, B., Jiang, J., Liu, J., Zheng, Y., Zhou, N. (2021). Research on quantitative assessment of climate change risk at an urban scale: Review of recent progress and outlook of future direction. Renewable and Sustainable Energy Reviews, 135: 110415. https://doi.org/10.1016/j.rser.2020.110415
[5] Shao, H., Kim, G. (2022). A comprehensive review of different types of green infrastructure to mitigate urban heat islands: Progress, functions, and benefits. Land, 11(10): 1792. https://doi.org/10.3390/land11101792
[6] Cortinovis, C., Olsson, P., Boke-Olén, N., Hedlund, K. (2022). Scaling up nature-based solutions for climate-change adaptation: Potential and benefits in three European cities. Urban Forestry & Urban Greening, 67: 127450. https://doi.org/10.1016/j.ufug.2021.127450
[7] Evola, G., Nocera, F., Costanzo, V., Detommaso, M., Bonaccorso, S., Marletta, L. (2021). Greenery systems for the mitigation of the urban heat island: A simulation experience for Southern Italy. In Innovation in Urban and Regional Planning, Cham: Springer International Publishing, pp. 427-438. https://doi.org/10.1007/978-3-030-68824-0_46
[8] Cortes, A., Rejuso, A.J., Santos, J.A., Blanco, A. (2022). Evaluating mitigation strategies for urban heat island in Mandaue City using ENVI-met. Journal of Urban Management, 11(1): 97-106. https://doi.org/10.1016/j.jum.2022.01.002
[9] Reyhani, M., Santolini, E., Michael, R.N., Barbaresi, A., Tassinari, P., Torreggiani, D. (2024). Environmental assessment of green wall: A comparison between Australia and Italy. Science of the Total Environment, 957: 177699. https://doi.org/10.1016/j.scitotenv.2024.177699
[10] Ciacci, C., Banti, N., Di Naso, V., Bazzocchi, F. (2023). Green strategies for improving urban microclimate and air quality: A case study of an Italian industrial district and facility. Building and Environment, 244: 110762. https://doi.org/10.1016/j.buildenv.2023.110762
[11] Ren, J., Shi, K., Li, Z., Kong, X., Zhou, H. (2023). A review on the impacts of urban heat islands on outdoor thermal comfort. Buildings, 13(6): 1368. https://doi.org/10.3390/buildings13061368
[12] Perera, T.A.N.T., Nayanajith, T.M.D., Jayasinghe, G.Y., Premasiri, H.D.S. (2022). Identification of thermal hotspots through heat index determination and urban heat island mitigation using ENVImet numerical micro climate model. Modeling Earth Systems and Environment, 8(1): 209-226. https://doi.org/10.1007/s40808-021-01091-x
[13] Heshmat Mohajer, H.R.H., Ding, L., Santamouris, M. (2022). Developing heat mitigation strategies in the urban environment of Sydney, Australia. Buildings, 12(7): 903. https://doi.org/10.3390/buildings12070903
[14] Kasarda, J. (2011). Aerotropolis, the way we’ll live next. Allen Lane. http://perpus.ditbtpp.id/opac/index.php?p=show_detail&id=8960.
[15] Mosissa, S., Shen, Z., Asefa, G., Woldesembet, A. (2020). Green infrastructure benefits to value and enhance the built environment: The case of Addis Ababa, Ethiopia. WIT Transactions on Ecology and the Environment, 241: 355-368. https://doi.org/10.2495/SDP200291
[16] Linke, S., Erlwein, S., van Lierop, M., Fakirova, E., Pauleit, S., Lang, W. (2022). Climate change adaption between governance and government—Collaborative arrangements in the city of Munich. Land, 11(10): 1818. https://doi.org/10.3390/land11101818
[17] Lombardía, A., Gómez-Villarino, M.T. (2023). Green infrastructure in cities for the achievement of the UN sustainable development goals: A systematic review. Urban Ecosystems, 26(6): 1693-1707. https://doi.org/10.1007/s11252-023-01401-4
[18] Kriesten, T.F., Ziemann, A., Goldberg, V., Schünemann, C. (2024). The effect of regional, urban and future climate on indoor overheating - A simplified approach based on measured weather data, statistical evaluation, and urban climate effects for building performance simulations. City and Environment Interactions, 24: 100163. https://doi.org/10.1016/j.cacint.2024.100163
[19] Kırıkkaya, E.B., Başaran, B. (2019). Investigation of the effect of the integration of Arduino to electrical experiments on students’ attitudes towards technology and ICT by the mixed method. European Journal of Educational Research, 8(1): 31-48. https://doi.org/10.12973/eu-jer.8.1.31
[20] Ferrari, S. (2022). Pollutant dispersion in a group of courtyard buildings. EPJ Web of Conferences, 264: 01013. https://doi.org/10.1051/epjconf/202226401013
[21] Chatzinikolaou, E., Chalkias, C., Dimopoulou, E. (2018). Urban microclimate improvement using ENVI-met climate model. The International Archives of the Photogrammetry, Remote Sensing and Spatial Information Sciences, XLII-4(4): 69-76. https://doi.org/10.5194/isprs-archives-XLII-4-69-2018
[22] Nakajima, K., Takane, Y., Kikegawa, Y., Furuta, Y., Takamatsu, H. (2021). Human behaviour change and its impact on urban climate: Restrictions with the G20 Osaka Summit and COVID-19 outbreak. Urban Climate, 35: 100728. https://doi.org/10.1016/j.uclim.2020.100728
[23] Kotharkar, R., Dongarsane, P. (2024). Investigating outdoor thermal comfort variations across Local Climate Zones in Nagpur, India, using ENVI-met. Building and Environment, 249: 111122. https://doi.org/10.1016/j.buildenv.2023.111122
[24] Emmanuel, R., Steemers, K. (2018). Connecting the realms of urban form, density and microclimate. Building Research & Information, 46(8): 804-808. https://doi.org/10.1080/09613218.2018.1507078
[25] Liu, Z., Cheng, K.Y., Sinsel, T., Simon, H., Jim, C.Y., Morakinyo, T.E., He, Y., Yin, S., Ouyang, W., Shi, Y., Ng, E. (2023). Modeling microclimatic effects of trees and green roofs/façades in ENVI-met: Sensitivity tests and proposed model library. Building and Environment, 244: 110759. https://doi.org/10.1016/j.buildenv.2023.110759
[26] Wollschläger, N., Zinck, F., Schlink, U. (2022). Sustainable urban development for heat adaptation of small and medium sized communities. Land, 11(9): 1385. https://doi.org/10.3390/land11091385
[27] Marx, D., Reitberger, R., Kleeberger, M., Lang, W. (2023). Automated workflow for simulating the effect of green façades on indoor thermal comfort. Journal of Physics: Conference Series, 2600(9): 092007. https://doi.org/10.1088/1742-6596/2600/9/092007
[28] Erlwein, S., Meister, J., Wamsler, C., Pauleit, S. (2023). Governance of densification and climate change adaptation: How can conflicting demands for housing and greening in cities be reconciled? Land Use Policy, 128: 106593. https://doi.org/10.1016/j.landusepol.2023.106593