Irland Fardani*![]() | Monalisa Putri
| Monalisa Putri![]()
© 2024 The authors. This article is published by IIETA and is licensed under the CC BY 4.0 license (http://creativecommons.org/licenses/by/4.0/).
OPEN ACCESS
Bandar Lampung City is one of the cities that has developed in the trade, industry, and tourism sectors. The development of Bandar Lampung City resulted in changes in land cover, from what was originally a vegetated area to built-up land. This land cover change can affect the increase in surface temperature, triggering the urban heat island (UHI) phenomenon in Bandar Lampung City. This study aims to determine the relationship between changes in the land cover area and the spatial expansion of UHI in Bandar Lampung City. The data used in this study are Landsat 5, Landsat 8, and Landsat 9 satellite imagery. In identifying land cover using guided classification, surface temperature values are obtained from thermal channel processing of Landsat satellite imagery. The UHI phenomenon can be attained by processing data from surface temperature. After the surface temperature value is obtained, it is correlated with changes in land cover using a simple regression test. The results showed that built-up land cover and open land have a positive and unidirectional correlation with the UHI phenomenon. In other words, an increase in the area of built-up land and open land is associated with an increase in the area of the UHI phenomenon in Bandar Lampung City. Meanwhile, the land cover of rice fields, vegetation, and water shows a negative correlation coefficient or is inversely proportional to the UHI phenomenon. This means that if the land cover of rice fields, vegetation, and water increases, it relates to a decrease in the area of the UHI phenomenon in Bandar Lampung City.
landcover, surface temperature, urban heat island, city
Urban heat island (UHI) is a phenomenon where air and surface temperatures in the center of the city are hotter than the surrounding area [1, 2]. UHI is occurring in Bandar Lampung City, where the temperature in the morning tends to rise when it gets close to the city center, gets hot in the afternoon, and then is weaker compared to the morning [3].
According to the Central Bureau of Statistics for Bandar Lampung City, in 2015-2020 the population growth rate in Bandar Lampung City was 1.77%. The increasing population every year causes the increased need for living and activity land in Bandar Lampung City. This can cause the development of built-up land to spread further and shift land from vegetated areas (agricultural and non-agricultural areas) to land cover and from non-vegetated areas to residential areas, trade and services, and industrial areas [4]. Urbanization causes a change in the current form of the land cover that has an effect on the land surface temperature [5-7].
In Bandar Lampung City, over the past 30 years, there has been an expansion of the built-up area. In 1990, the percentage of built-up area was only 27% of the total city, but in 2020, the percentage increased to 39% [8]. The highest building density in Bandar Lampung City is in the northeast, and the highest vegetation density is in the western area [9].
Based on the description of the issues above, it shows that the UHI Phenomenon and land cover changes are occurring in Bandar Lampung City. In several previous studies, research has been conducted on the relationship between land cover change and temperature [10-12] or UHI [13-15], with the conclusion that land cover change contributes to temperature change and the urban heat island phenomenon.
The City of Bandar Lampung has different regional conditions from the research areas that have been previously studied. Bandar Lampung is located on the coast, which generally has a warm air temperature. With such conditions, it will be very interesting to observe whether the urban heat island phenomenon occurs and whether there is a correlation between changes in land cover and the urban heat island phenomenon in coastal areas.
This study aims to examine land use changes and investigate the impact of the changes on the spatial pattern of UHI in Bandar Lampung City. The researchers use Landsat image satellites to extract land use information of different periods and the surface temperature from the thermal infrared band, then convert them to urban heat island analysis.
2.1 Research site
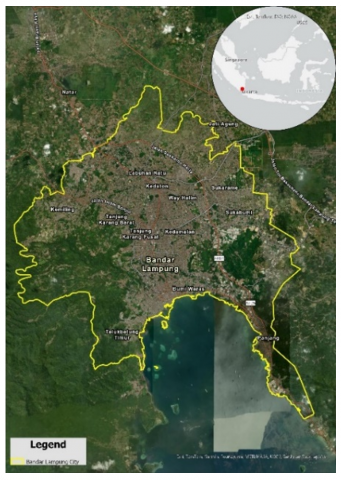
Bandar Lampung City is the capital of Lampung Province, which is located at the southern tip of Sumatra Island, Indonesia. The location of Bandar Lampung is strategic since it is a transit area for economic activities between the islands of Sumatra and Java and is used as a center for trade, industry, and tourism. The City of Bandar Lampung has an area of 197.22 ha. Geographically, the city is located at coordinates 5°20'–5°30' South Latitude and 105°28'–105°37' East Longitude (refer to Figure 1).
Figure 1. Location of Bandar Lampung City
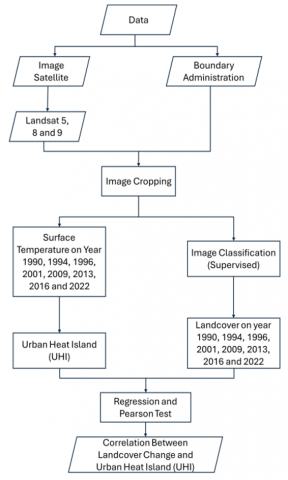
Figure 2. The flowchart diagram of research
2.2 Analysis methods
This study utilizes Landsat satellite data from three sources, which are: Landsat 5, Landsat 7, and Landsat 8. For easier image processing, several considerations are applied in selecting the year of the satellite imagery: having low cloud cover and good atmospheric conditions. This research utilizes time series satellite imaging data spanning the years 1990, 1994, 2001, 2009, 2013, 2016, and 2022. Landsat satellite imagery data is categorized as medium-resolution satellite; therefore, the land cover that can be identified is limited to only 5 land cover classes: built-up area, empty land, waters, rice fields, and vegetation. Each year, Landsat satellite imagery data is transformed into land cover, surface temperature, and urban heat islands. Variables of land cover change and urban heat islands are subject to regression analysis to determine the association between them, as shown by the flowchart in Figure 2.
Landsat satellite image has a band that can calculate a surface temperature [16, 17]. Emissivity data from each image satellite is converted to brightness temperature by using the following equation:
$T B K=\frac{K_2}{ln \left(\frac{K_1}{L_\lambda}\right)+1}$ (1)
where,
TBk = Brightness temperature (in Kelvin);
K1 = Spectral radian calibration (W/(m2.sr.μm);
K2 = Spectral radian calibration constant;
Lλ = Emissivity.
The result of brightness temperature is in Kelvin units that must be converted to Celsius; it is necessary to subtract it by an absolute value of zero (273.15℃), as presented in Eq. (2).
TBC = TBK – 273.15 (2)
After obtaining land surface temperature data, it is then used to analyze the intensity of the UHI [18, 19]. This analysis is carried out to achieve the third research target. The intensity of the UHI can be defined by the Eq. (3) [20].
$H I=\frac{T_i-T_{min }}{T_{max }-T_{min }}$ (3)
where,
Ti = Surface temperature (LST);
Tmin = Minimum surface temperature;
Tmax = Maximum surface temperature.
Table 1. UHI intensity classification
|
Category |
UHI Intensity index |
UHI Intensity |
|
I |
HI < HImean – 1.5 S |
Very Cold Area |
|
II |
HImean – 1.5 S < HI < HImean – 0.5 S |
Cold Area |
|
III |
HImean – 0.5 S < HI < HImean + 0.5 S |
Non-UHI Area |
|
IV |
HImean + 0.5 S < HI < HImean + 1.5 S |
UHI Area |
|
V |
HI > HImean + 1.5 S |
High UHI Area |
The results of the calculations above show the intensity value of the UHI phenomenon. These values are then classified into 5 categories: strong cold island, cold island, no heat island, heat island, and strong heat island. Table 1 shows a more detailed classification of the intensity values of the UHI phenomenon. In the table criteria, it can be seen that the UHI symbol is a symbol of the intensity value of the UHI, the UHI mean indicates the average value of the UHI intensity, and the S symbol indicates the standard deviation value of the UHI intensity value.
Landcover data is derived from the supervised classification of the Landsat Image satellite. The classification of land cover is divided into 5 classes: built-up area, empty land, waters, rice fields, and vegetation. The area of each class is calculated by Geographic Information System (GIS), so it obtains the area of each land use each year.
Land cover area data for each year will be correlated with UHI area data. Next, the regression correlation and the Pearson test will be carried out. The results of this correlation will show how the land cover data is related to the UHI area.
3.1 Land cover
Based on the results of the satellite image data processing, land cover is divided into five classes, which are: built-up land, empty land, waters, rice fields, and vegetation. The land cover classification uses a guided classification method. The dynamics of land cover changes in Bandar Lampung City in 1990-2022 can be seen in Table 2. The result of the land cover classification is tested for accuracy using the overall accuracy approach. The test result shows the average value of overall accuracy for land cover classification from 1990 to 2022 is 88%. Since the value is above 85%, it can be said that the classification results are reliable.
Table 2. The type of land cover area in Bandar Lampung City in 1990-2022
|
No. |
Land Cover |
1990 |
1994 |
1996 |
2001 |
2009 |
2013 |
2019 |
2022 |
|
1 |
Built-up Area |
4.094 |
6.346 |
7.393 |
9.814 |
11.764 |
11.934 |
13.547 |
15.115 |
|
2 |
Empty Area |
222 |
200 |
222 |
137 |
116 |
382 |
485 |
246 |
|
3 |
Waters |
2.178 |
2.169 |
2.121 |
2.176 |
2.178 |
2.124 |
2.130 |
2.146 |
|
4 |
Rice Field |
3.053 |
2.609 |
2.380 |
2.252 |
1.870 |
1.795 |
1.664 |
1.363 |
|
5 |
Vegetation |
18.127 |
16.350 |
15.558 |
13.295 |
11.746 |
11.439 |
9.848 |
8.804 |
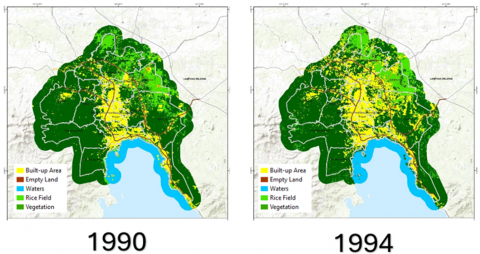
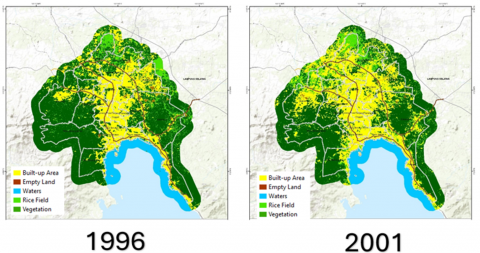
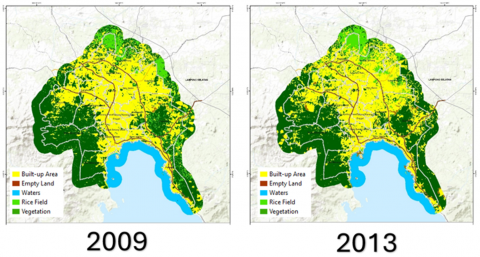
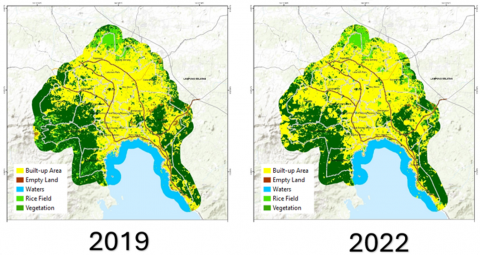
Based on the analysis, Figure 3 presents the magnitude of changes in the land cover area of Bandar Lampung City over 32 years. The land cover of Bandar Lampung City has experienced quite extensive changes in the built-up land class, where from 1990-2022, the built-up land class has increased by 39.82%. There was a significant increase in the built-up land class in 2001, amounting to 8.75%. The increase in built-up land was spread throughout almost the entire region. These land cover changes can be seen in Figure 4. Land cover that experienced land decline occurred in the vegetation land class, with a decrease of 33.69% from 1990-2022. A significant decrease in vegetation land occurred in 2001, amounting to 8.18%. This decrease in vegetation land occurred in the east, north, and west areas. This decline occurred due to changes in vegetation to built-up land, such as settlements, trade and services, and industrial areas, as well as empty or non-vegetated land from year to year.
Figure 3. Chart of land cover change in Bandar Lampung City
Meanwhile, rice fields also decreased by 6.11% from 1990 -2022, with a significant decline in 1994, amounting to 1.60%. The decline in rice fields also occurred due to changes to built-up and empty land. The increasing population in urban areas will increase built-up areas and cause vegetation land and rice fields to continue to decrease. The conclusion from this land change is that the built-up and empty land have increased by a fairly large area, the water area tends to remain the same, while rice fields and vegetation have decreased by a fairly large area.
3.2 Surface temperature
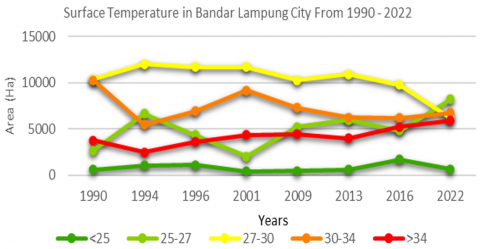
Land surface temperature analysis was carried out to obtain the thermal conditions of the land surface in the research area, which were obtained based on a series of image data processing results. The results of the analysis of land surface temperature data in Bandar Lampung City, which can be seen in Figure 5, obtained an average surface temperature of 22.30℃ to 30.16℃.
Based on the analysis results, the land surface temperature of Bandar Lampung City has experienced a significant increase in the last 32 years, as can be seen in Table 3. In 2001, the average increase in surface temperature reached 2.96℃. This high increase in land surface temperature was influenced by buildings in settlements, trade and services, and industrial areas, which increased every year. Furthermore, some vegetation was replaced by asphalt and concrete for roads and other infrastructure needed to accommodate the needs and growth of the human population. The replaced surface absorbs more of the sun's heat and reflects more of it, causing the surface temperature to rise. Meanwhile, there was an insignificant increase in land surface temperature in 2022, which had the lowest average temperature of -0.48℃. This decrease in land surface temperature was influenced by water catchments and park areas that have lower temperatures than the areas previously mentioned above.
Figure 5. The average surface temperature
Table 3. Surface temperature area of Bandar Lampung City from 1990 to 2022
|
No. |
Temperature |
Year |
|||||||
|
1990 |
1994 |
1996 |
2001 |
2009 |
2013 |
2016 |
2022 |
||
|
1 |
< 25 |
580 |
1.061 |
1.125 |
421 |
457 |
583 |
1.69 |
636 |
|
2 |
25-27 |
2.677 |
6.666 |
4.349 |
2.035 |
5.217 |
5.949 |
4.821 |
8.183 |
|
3 |
27-30 |
10.36 |
11.985 |
11.675 |
11.696 |
10.265 |
10.911 |
9.767 |
6.19 |
|
4 |
30-34 |
10.277 |
5.465 |
6.897 |
9.171 |
7.306 |
6.226 |
6.182 |
6.755 |
|
5 |
> 34 |
3.78 |
2.496 |
3.627 |
4.351 |
4.427 |
4.005 |
5.216 |
5.911 |
Figure 6. The average surface temperature in several classes
The temperature classification < 25 shows a significant increase in surface temperature changes in 2016, namely 6.11%, which was shown in Figure 6. Meanwhile, the decrease in changes in surface temperature area that was significant in the temperature classification < 25 in 2001 was 1.5%. Temperature classification 25-27 shows a significant increase in surface temperature changes in 2022, namely 29.5%. Meanwhile, there was a significant decrease in surface temperature changes in temperature classification 25-27 in 2001, namely 7.3%. Temperature classification 27-30 shows a significant increase in surface temperature changes in 1994, namely 43.3%. Meanwhile, there was a significant decrease in surface temperature changes in the 30-34 temperature classification in 1994, namely 19.7%. A temperature classification of > 34 shows a significant increase in surface temperature changes in 2022, namely 21.3%. Meanwhile, there was a significant decrease in surface temperature changes in the temperature classification > 34 in 1994, namely 9%.
Figure 7 shows the ups and downs of the temperature in Bandar Lampung City from 1990 to 2022. The constant area of hot temperatures in Bandar Lampung City is in the center of the city, which is more than 34 degrees Celsius. In the south of the city, which is the water area of the beach, the temperature often changes as the characteristics of water depend on the air temperature. In the west and east of Bandar Lampung City, the temperature is constantly low because the area still has quite dense forest cover.
3.3 UHI
The results of thermal data processing on satellite imagery can be used to analyze the UHI phenomenon. This analysis was carried out to determine the area of Bandar Lampung City that is experiencing the UHI. To calculate the UHI phenomenon, researchers used the 3 equation formula as was done in previous research. As shown in Table 4, which portrays the Area of the UHI phenomenon in Bandar Lampung City in 1990-2022, the intensity level of UHI is divided into very cold areas, cold areas, non-UHI areas, UHI areas, and high UHI areas. Meanwhile, Table 5 presents the sum of the classes of the UHI area and the high UHI area.
Figure 7. Map of surface temperature of Bandar Lampung City from 1990 to 2022
Table 4. The extent of the UHI phenomenon in Bandar Lampung City from 1990 to 2022
|
No. |
UHI Classification |
1990 |
1994 |
1996 |
2001 |
2009 |
2013 |
2016 |
2022 |
|
1 |
Very Cold |
1.903 |
1.389 |
1.061 |
1.911 |
7.84 |
936 |
1.821 |
995 |
|
2 |
Cold |
8.298 |
4.084 |
6.666 |
3.010 |
8.501 |
7.266 |
5.473 |
8.782 |
|
3 |
Non UHI |
10.874 |
18.577 |
14.376 |
13.582 |
10.496 |
11.336 |
11.419 |
7.984 |
|
4 |
UHI Area |
4.923 |
1.213 |
3.074 |
7.456 |
4.833 |
5.538 |
6.921 |
8.246 |
|
5 |
High UHI Area |
1.676 |
2.411 |
2.497 |
1.715 |
3.060 |
2.598 |
2.040 |
1.667 |
Note: the color area is UHI phenomenon area
Table 5. Area of UHI phenomenon in Bandar Lampung City in 1990-2022
|
No. |
Intensity of UHI Area |
1990 |
1994 |
1996 |
2001 |
2009 |
2013 |
2016 |
2022 |
|
1 |
UHI Area |
4.923 |
1.213 |
3.074 |
7.456 |
4.833 |
5.538 |
6.921 |
8.246 |
|
2 |
High UHI Area |
1.676 |
2.411 |
2.497 |
1.715 |
3.060 |
2.598 |
2.040 |
1.667 |
|
Total |
6.599 |
3.624 |
5.571 |
9.171 |
7.893 |
8.136 |
8.961 |
9.913 |
|
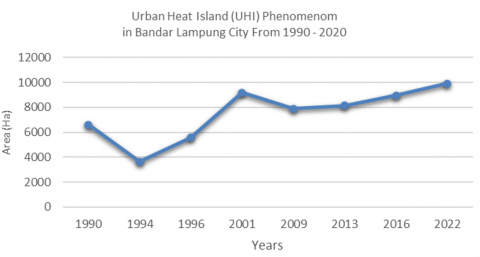
Based on the graph in Figure 8, it can be seen that the area of the UHI phenomenon from 1990-2022, or in the last 32 years, is 3,314 ha. The UHI phenomenon will experience a significant increase in 2022, covering an area of 9,913 ha. The increase occurs due to changes in the use of vegetated land and rice fields to built-up land and empty land; vegetation is also replaced by asphalt and concrete for roads, buildings, and other infrastructure to accommodate the needs and growth of the population of Bandar Lampung City. The replaced vegetation and rice fields absorb more of the sun's heat and reflect more of it, causing surface temperatures to rise. This temperature increase causes the UHI phenomenon in Bandar Lampung City.
The UHI phenomenon experienced a significant decline in 1994, covering an area of 2,975 ha. The decrease in the area of the UHI phenomenon is due to the increase in the level of vegetation density. Moreover, based on land surface temperature data in Bandar Lampung City, which can be seen in Table 4, there is a very significant decrease in surface temperature area (30-34°) of 4,812 ha in 1994. This decrease in surface temperature can reduce the area of the UHI in Bandar Lampung. Furthermore, in 2001, the area of the UHI phenomenon decreased by 1,278 ha. This decrease was due to the decrease in surface temperature at 30-34°, covering an area of 1,865 ha.
Figure 8. The trend of UHI area in Bandar Lampung City from 1990 to 2002
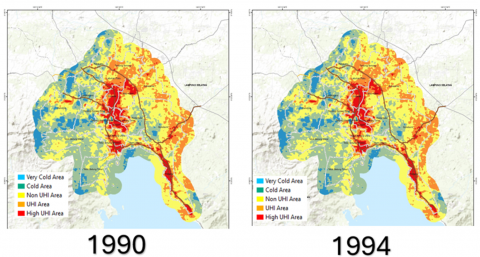
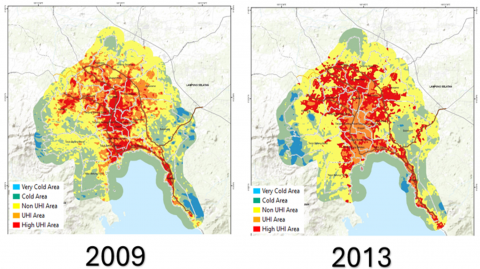
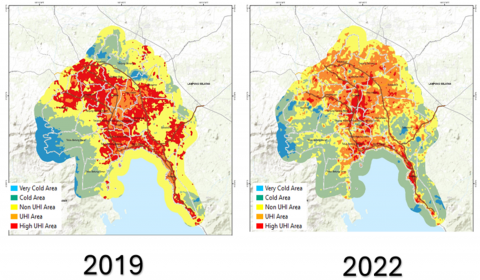
From Figure 9, which contains the map of the change in the UHI area from 1990 to 2022, it can be seen that the UHI area is expanded in the center of the City of Bandar Lampung; until 2022, the UHI area is enhanced following the main road of the city. In the western part, the area is consistently cold; it is different from the eastern part, where the UHI area is expanding.
Figure 9. The map of UHI in Bandar Lampung City from 1990 to 2022
3.4 Relationship between UHI and land cover changes
Pearson correlation test analysis is conducted to determine the influence of changes in the land cover area on the UHI. This research uses one dependent variable (Y), namely the UHI phenomenon, and five independent variables (X), namely built-up land, empty land, water, rice fields, and vegetation. Data in this analysis can be seen in Table 6.
Table 6. Variable data of the Pearson correlation test on the influence of changes in land cover area on the UHI
|
No. |
Y |
X1 |
X2 |
X3 |
X4 |
X5 |
|
1 |
65.99 |
40.94 |
2.22 |
21.78 |
30.53 |
181.27 |
|
2 |
36.24 |
63.46 |
2.00 |
21.69 |
26.09 |
163.50 |
|
3 |
55.71 |
73.93 |
2.22 |
21.21 |
23.80 |
155.58 |
|
4 |
91.71 |
98.14 |
1.37 |
21.76 |
22.52 |
132.95 |
|
5 |
78.93 |
117.64 |
1.16 |
21.78 |
18.7 |
117.46 |
|
6 |
81.36 |
119.34 |
3.82 |
21.24 |
17.95 |
114.39 |
|
7 |
89.61 |
135.47 |
4.85 |
21.30 |
16.64 |
98.48 |
|
8 |
99.13 |
151.15 |
2.46 |
21.46 |
13.63 |
88.04 |
Variable Y: Urban Heat Island Phenomenon(UHI); Variable X1: Built-up Area; Variable X2: Empty Land; Variable X3: Waters; Variable X4: Rice Field; Variable X5: Vegetation.
From the results of the Pearson correlation data processing between the independent variable (X) and the dependent variable (Y), it is known that the analysis of the relationship between the influence of changes in the land cover area on the UHI has a significant correlation. Three variables have a significance value of < 0.05, which can be concluded that there is a significant correlation between the variables and the UHI phenomenon. Meanwhile, two variables are not significant, namely empty land and water. Two variables have a significance value of > 0.05, which can be concluded that there is no significant correlation between the variables and the urban heat island (UHI) phenomenon. The relationship between the influence of changes in land cover area on surface temperature related to the urban heat island (UHI) of Bandar Lampung City can be seen in Table 7.
Table 7. Pearson correlation matrix of land cover and UHI phenomenon
|
Variable |
UHI |
Built-up Area |
Empty Land |
Waters |
Rice Field |
Vegetation |
|
|
UHI |
Pearson correlation |
1 |
.783* |
.247 |
-.117 |
-.715* |
-.792* |
|
Sig. (2-tailed) |
.022 |
.556 |
.782 |
.046 |
.019 |
||
|
Built-up Area |
Pearson correlation |
.783* |
|||||
|
Sig. (2-tailed) |
.022 |
||||||
|
Empty Land |
Pearson correlation |
.247 |
|||||
|
Sig. (2-tailed) |
.556 |
||||||
|
Waters |
Pearson correlation |
-.117 |
|||||
|
Sig. (2-tailed) |
.782 |
||||||
|
Rice Field |
Pearson correlation |
-.715* |
|||||
|
Sig. (2-tailed) |
.0.46 |
||||||
|
Vegetation |
Pearson correlation |
-.792* |
|||||
|
Sig. (2-tailed) |
0.19 |
||||||
Pearson Correlation: Pearson correlation
Sig. (2-tailed): Undirected hypothesis
Results of this study show that the significant value of the dependent variable (Y) UHI phenomenon and the independent variable (X) built-up land is equal to 0.022, in which 0.022 < 0.05, thus both variables have a relationship or are correlated. It is also known that the Pearson correlation for the UHI phenomenon and built-up land is 0.783, with the degree of the relationship being strongly correlated and the form being positive, which means that every increase in the proportion of built-up land area will have an impact on increasing the UHI area.
The significant value for the UHI phenomenon and empty land variables is 0.556, in which 0.556 > 0.05, thus the UHI phenomenon and empty land variables have no relationship or are not correlated. It is also known that the Pearson correlation for the UHI phenomenon and empty land is 0.247, with the degree of the relationship being weakly correlated and the form being positive, which means that every increase in the proportion of empty land area can have an impact on the increase in the UHI area.
The significant value for the UHI phenomenon and water variables is 0.782, in which 0.782 > 0.05, thus the UHI phenomenon and water variables have no relationship or are not correlated. It is also known that the Pearson correlation for the UHI phenomenon and waters is -0.117, with the degree of the relationship being very weakly correlated and the form being negative, which means that the proportion of the area of water can have an impact on UHI phenomenon since the decreasing waters can affect the surrounding temperature. However, the temperature changes may not be significant and depend on other factors, such as weather, time of day, and location.
The significant value for the UHI phenomenon and rice fields variables is 0.046, in which 0.046 < 0.05, thus the UHI phenomenon and rice fields variables have a relationship or are correlated. It is also known that the Pearson correlation for the UHI phenomenon and rice fields is -0.715, with the degree of the relationship being strongly correlated and the form being negative or opposite to the UHI phenomenon. This occurs due to the characteristics of rice fields that can absorb water so that it can minimize the increase in air temperature and contribute to reducing surface temperatures and the UHI phenomenon. An increase in the area of rice fields will cause an increase in the area that has a lower average surface temperature than its surroundings. Areas with a lower surface temperature than their surrounding area are characteristic of the cold area phenomenon or the opposite of the UHI phenomenon.
The significant value for the UHI phenomenon and vegetation variables is 0.019, which proves that the UHI phenomenon and vegetation variables are related or correlated. It is also known that the Pearson correlation value for the UHI and vegetation is -0.792, with the degree of the relationship being strongly correlated and the form being negative or opposite to the UHI phenomenon due to its characteristics, which can absorb water that minimizes the increase in air temperature and contributes to reducing surface temperatures and the UHI phenomenon.
The strength of the relationship between the UHI phenomenon and each type of land cover can also be seen from the asterisk symbol (*), that can be seen in Table 7, where the land cover variable that has this number of symbols in the correlation coefficient value means it has a stronger relationship with the UHI phenomenon compared to the land cover type variable, which does not have the asterisk symbol (*).
An effort that can be made to reduce the effects of UHI is to add green open space to built-up areas, roads, and existing green spaces if new residential areas are developed later. With the balance between the addition of built-up areas and green open space, it is expected to reduce the rate of increase in the UHI area.
The Pearson correlation analysis was carried out to determine the relationship or correlation between changes in land cover and the UHI phenomenon. Types of land cover that have a significant relationship with the UHI phenomenon include built-up land, rice fields, and vegetation. This can be seen from the significance value of these three variables. Meanwhile, land cover types that do not have a significant relationship include empty land and waters. Land cover variables such as built land and empty land have a positive or unidirectional correlation with the UHI phenomenon, which means that the increase in the area of built land and empty land is related to the increase in the UHI area. Meanwhile, rice fields, vegetation, and water cover have a negative correlation coefficient or are inversely proportional to the UHI phenomenon, which means that if the area of rice fields, vegetation, and water cover increases, it correlates with the decreasing of the UHI area.
One of the inputs for future research is to add socio-economic and climate variables that are expected to obtain more detailed results. In addition, it can also be carried out using satellite imagery that has a higher resolution to obtain more detailed land cover classes that can better describe the relationship between each land cover and the UHI phenomenon.
[1] Gartland, L.M. (2012). Heat Islands: Understanding and Mitigating Heat in Urban Areas. Routledge.
[2] Li, Z.L., Wu, H., Duan, S.B., Zhao, W., Ren, H.Y., et al. (2023). Satellite remote sensing of global land surface temperature: Definition, methods, products, and applications. Reviews of Geophysics, 61(1): e2022RG000777. https://doi.org/10.1029/2022RG000777
[3] Manik, T.K. (2017). The Impact of Urban Heat Islands: Assesing Vulnerability in Indonesia. International Institute for Environment and Development.
[4] Fardani, I., Yosliansyah, M.R. (2022). Kajian penentuan prioritas ruang terbuka hijau berdasarkan fenomena urban heat island di kota cirebon. Jurnal Sains Informasi Geografi, 5(2): 93-107. https://doi.org/10.31314/jsig.v5i2.1708
[5] Kadhim, S.H., Al-Jawari, S.M., Razak Hasach, N.A. (2024). Analyzing earth’s surface temperatures with relationship to land urban land cover (LULC) to enhance sustainability. International Journal of Sustainable Development & Planning, 19(1): 123-130. https://doi.org/10.18280/ijsdp.190110
[6] Chen, Y.C., Chiu, H.W., Su, Y.F., Wu, Y.C., Cheng, K.S. (2017). Does urbanization increase diurnal land surface temperature variation? Evidence and implications. Landscape and Urban Planning, 157: 247-258. https://doi.org/10.1016/j.landurbplan.2016.06.014
[7] Fu, P., Weng, Q. (2016). A time series analysis of urbanization induced land use and land cover change and its impact on land surface temperature with Landsat imagery. Remote sensing of Environment, 175: 205-214. https://doi.org/10.1016/j.rse.2015.12.040
[8] Pramudiyasari, T., Wibowo, A., Suko, P.A. (2022). Land cover changes impact on 1st between 1990-2005-2020 in Bandar Lampung City, Indonesia. IOP Conference Series: Earth and Environmental Science, 986(1): 012048. https://doi.org/10.1088/1755-1315/986/1/012048
[9] Wibowo, A. (2022). Local climate zone (LCZ) in Bandar Lampung City. International Journal of Remote Sensing and Earth Sciences, 19(1): 69-78. https://doi.org/10.1088/1755-1315/1089/1/012038
[10] Tran, D.X., Pla, F., Latorre-Carmona, P., Myint, S.W., Caetano, M., Kieu, H.V. (2017). Characterizing the relationship between land use land cover change and land surface temperature. ISPRS Journal of Photogrammetry and Remote Sensing, 124: 119-132. https://doi.org/10.1016/j.isprsjprs.2017.01.001
[11] Fardani, I., Razak, F. (2024). Spatial-temporal analysis between landcover change and urban surface temperature of Bekasi city, Indonesia. Planning Malaysia, 22(1): 194-208. https://doi.org/10.21837/pm.v22i30.1434
[12] Gohain, K.J., Mohammad, P., Goswami, A. (2021). Assessing the impact of land use land cover changes on land surface temperature over Pune city, India. Quaternary International, 575: 259-269. https://doi.org/10.1016/j.quaint.2020.04.052
[13] Naikoo, M.W., Islam, A.R.M.T., Mallick, J., Rahman, A. (2022). Land use/land cover change and its impact on surface urban heat island and urban thermal comfort in a metropolitan city. Urban Climate, 41: 101052. https://doi.org/10.1016/j.uclim.2021.101052
[14] Chen, X.L., Zhao, H.M., Li, P.X., Yin, Z.Y. (2006). Remote sensing image-based analysis of the relationship between urban heat island and land use/cover changes. Remote Sensing of Environment, 104(2): 133-146. https://doi.org/10.1016/j.rse.2005.11.016
[15] Grigoraș, G., Urițescu, B. (2019). Land use/land cover changes dynamics and their effects on surface urban heat island in Bucharest, Romania. International Journal of Applied Earth Observation and Geoinformation, 80: 115-126. https://doi.org/10.1016/j.jag.2019.03.009
[16] Malakar, N.K., Hulley, G.C., Hook, S.J., Laraby, K., Cook, M., Schott, J.R. (2018). An operational land surface temperature product for Landsat thermal data: Methodology and validation. IEEE Transactions on Geoscience and Remote Sensing, 56(10): 5717-5735. https://doi.org/10.1109/TGRS.2018.2824828
[17] Käfer, P.S., Rolim, S.B.A., Iglesias, M.L., da Rocha, N.S., Diaz, L.R. (2019). Land surface temperature retrieval by LANDSAT 8 thermal band: Applications of laboratory and field measurements. IEEE Journal of Selected Topics in Applied Earth Observations and Remote Sensing, 12(7): 2332-2341. https://doi.org/10.1109/JSTARS.2019.2913822
[18] Yuan, F., Bauer, M.E. (2007). Comparison of impervious surface area and normalized difference vegetation index as indicators of surface urban heat island effects in Landsat imagery. Remote Sensing of Environment, 106(3): 375-386. https://doi.org/10.1016/j.rse.2006.09.003
[19] Estoque, R.C., Murayama, Y. (2017). Monitoring surface urban heat island formation in a tropical mountain city using Landsat data (1987-2015). ISPRS Journal of Photogrammetry and Remote Sensing, 133: 18-29. https://doi.org/10.1016/j.isprsjprs.2017.09.008
[20] Yuan, S., Ren, Z., Shan, X., Deng, Q., Zhou, Z. (2023). Seasonal different effects of land cover on urban heat island in Wuhan's metropolitan area. Urban Climate, 49: 101547. https://doi.org/10.1016/j.uclim.2023.101547