Herry Nugraha*![]() | Rita Nurmalina
| Rita Nurmalina![]() | Noer A. Achsani
| Noer A. Achsani![]() | Arif I. Suroso
| Arif I. Suroso![]() | Suprehatin Suprehatin
| Suprehatin Suprehatin![]()
© 2024 The authors. This article is published by IIETA and is licensed under the CC BY 4.0 license (http://creativecommons.org/licenses/by/4.0/).
OPEN ACCESS
Global Value Chain (GVC) participation has significantly influenced production patterns and specializations across various industry sectors globally. This study employs a quantitative approach using the GVC Participation Index database specific to the agricultural sector and the Global Food Security Index (GFSI) from 2012 to 2021, analyzed using Beta Regression. The results reveal that GVC participation significantly impacts food security. Simple forward and complex backward GVC participation positively influence food security, whereas forward complex participation has a negative effect. Food security varies significantly by region and income level, with Europe & Central Asia and North America, as well as high-income countries, exhibiting better food security. In contrast, South and East Asia and lower-middle-income countries show lower food security. These findings underscore the necessity for targeted policies and interventions to enhance GVC participation based on regional and income-specific conditions.
agriculture, beta regression, food security, global value chain, GVC, GFSI
Over the past few decades, participation in GVCs has profoundly influenced production patterns and specializations worldwide, encompassing all sectors, including agriculture and food. This involvement has shifted trade composition from the dominance of traditional commodities to an increase in trade of higher-value processed products. Recent literature suggests that the GVC revolution has enabled even small countries with limited capacity or resources to participate in GVCs and benefit from global trade [1-4] .
The agricultural sector primarily participates in the value chain as a supplier of raw materials for other production processes, while the food sector mainly engages by sourcing inputs globally. Over the past three decades, the growing importance of registered global agricultural trade has coincided with changes in GVC organization, including increased vertical coordination, an expanded supply base, and the rising influence of large multinational food companies. A small number of companies now regulate the global food supply, linking small producers in both developed and developing countries with consumers worldwide [5-8].
From a macroeconomic perspective, various studies have demonstrated that the competitiveness of a country or industry can be assessed by examining the added value of production and the level of GVC integration. The use of input-output tables between countries and comprehensive matrices of bilateral trade flows now enables the determination of trade with value-added data. Several studies have highlighted that the development of agri-food chains presents significant opportunities to increase rural incomes, reduce rural poverty, and promote pro-poor growth [4, 9].
A study on the impact of value chains on food security in Russia found that GVCs can accelerate food distribution but may also enhance monopolistic control. Participation in GVCs within the agricultural sector contributes to increased employment and economic growth [10]. Other research indicates that trade policies influence GVC participation in Sub-Saharan African countries, with substantial implications for food security. Participation in GVCs increases total factor productivity in the agricultural sector, particularly in high- and upper-middle-income countries [11-13].
Some studies indicate that GVC participation negatively impacts food security by increasing smallholder dependence on global markets, which can be detrimental to local food security. Another study found that participation in the global value chain had a negative impact on job growth in the non-manufacturing sector in India, suggesting that the benefits of global value chain participation are uneven across sectors [14, 15].
Participation in GVCs has become an important strategy for many countries to improve the productivity and competitiveness of their agricultural sectors. However, the impact of this participation on food security remains a matter of debate. On one hand, participation in GVCs can increase access to global technologies and markets, potentially improving food production and distribution. On the other hand, dependence on global markets and the potential for monopolization by multinational companies can pose risks to national food security. Therefore, the research question that arises is how participation in the global value chain of the agricultural sector affects food security, particularly in developing countries such as Indonesia.
The analysis in this study focuses on the upstream agriculture sector. As defined in the International Standard Industrial Classification (ISIC), this sector includes three sub-categories of agriculture industries: crop and animal production, hunting and related service activities; timber products and forest products; and fisheries and marine products. Consequently, other sectors outside this definition are excluded from the database.
This study utilizes secondary data from the Asian Development Bank (ADB) Inter-Country Input-Output (ICIO) database, which provides detailed input-output tables for 46 countries. For a more focused analysis of GVC participation, the UIBE GVC Index System [16, 17] is employed, allowing for an in-depth examination of the specific GVC participation index. The ICIO data from the ADB covers the period from 2012 to 2021, which aligns with the GFSI data also used in this study, ensuring consistent data coverage across the same 46 countries.
These countries were chosen due to the availability of both GFSI and GVC Index data, allowing for a comprehensive analysis of the relationship between GVC participation and food security. However, this selection may introduce biases, as it primarily reflects countries with robust data collection capabilities, often skewing towards wealthier nations. Consequently, the findings may not fully extend to lower-income or developing countries that face unique challenges in GVC participation. Additionally, the limited sample size restricts the study’s ability to capture broader contextual and regional factors that could influence this relationship.
The preparation of GVC indicators by UIBE (University of International Business and Economics) primarily relies on GVC indicators calculated using the widely accepted GVC accounting method. Given that the accounting methods developed by Wang et al. [17-20] are relatively comprehensive and inclusive, the UIBE team used this method to build UIBE-GVC-Indicators.
Conceptually, the model is developed by dividing exports into nine value-added terminologies, as presented in the equation below. This model assumes a world with G country, where every manufactured good from N sector is a different trade sector where μE represents gross exports [21]. Ysr is the final demand vector N × 1, representing the demand in country r for the final goods produced in country s. Asr is the Input-Output (IO) matrix coefficient, measuring N × N semi-finished goods used by country r produced by country s.
$u E_{\mathrm{s}^*}=\left\{V_{\mathrm{s}} \sum_{r \neq s}^G B_{\mathrm{ss}} Y_{\mathrm{sr}}+V_{\mathrm{s}} \sum_{r \neq s}^G B_{\mathrm{sr}} Y_{\mathrm{rr}}+\sum_{r \neq s}^G \sum_{t \neq s, r}^G B_{\mathrm{sr}} Y_{\mathrm{rt}}\right\}+\left\{V_{\mathrm{s}} \sum_{r \neq s}^G B_{\mathrm{sr}} Y_{\mathrm{rs}}+V_{\mathrm{s}} \sum_{r \neq s}^G B_{\mathrm{sr}} A_{\mathrm{rs}}\left(I-A_{\mathrm{ss}}\right)^{-1} Y_{\mathrm{ss}}\right\}$
$+V_{\mathrm{s}} \sum_{r \neq s}^G B_{\mathrm{sr}} A_{\mathrm{rs}}\left(I-A_{\mathrm{ss}}\right)^{-1} E_{\mathrm{s}^*}+\left\{\sum_{t \neq s}^G \sum_{r \neq s}^G V_{\mathrm{t}} B_{\mathrm{ts}} Y_{\mathrm{sr}}+\sum_{t \neq s}^G \sum_{r \neq s}^G V_{\mathrm{t}} B_{\mathrm{ts}} A_{\mathrm{sr}}\left(I-A_{\mathrm{rr}}\right)^{-1} Y_{\mathrm{rr}}\right\}+\sum_{t \neq s}^G V_{\mathrm{t}} B_{\mathrm{ts}} A_{\mathrm{sr}} \sum_{r \neq s}^G\left(I-A_{\mathrm{rr}}\right)^{-1} E_{\mathrm{r}^*}$
In addition, Bsr is an inverted matrix measuring N × N, representing the total requirements matrix that gives the amount of gross output produced by a country required to increase one unit of final demand in the destination country r. The Leontief [22] equation, Y, is a N × 1 vector representing the global use of the final good. Lastly, Vs is the direct coefficient of the vector plus the value of 1 × N.
The study by Koopman et al. [21] describes nine specific terminologies related to the added value in global trade, each providing a nuanced understanding of value distribution within the GVC. The first term, (V1), represents the domestic added value in the direct export of final goods, highlighting the contribution of a country's production to its export market. The second term, (V2), captures the domestic added value in intermediate exports absorbed by direct importers, reflecting the integration of intermediate goods into other countries' production processes. The third term, (V3), addresses the domestic added value in intermediates which are subsequently exported to a third country, emphasizing the extended reach of a country's intermediate goods.
The fourth term, (V4), considers the domestic added value returned through final imports, showing how exported final goods return to the domestic market. The fifth term, (V5), is concerned with domestic added value returned through intermediate imports, illustrating the cyclical nature of intermediate goods within the GVCs. The sixth term, (V6), relates to exports of double-counted semi-finished products produced domestically, indicating potential inefficiencies or redundancies in the value chain.
The seventh term, (V7), represents the foreign added value in the export of final goods, underscoring the contribution of international inputs to domestic exports. The eighth term, (V8), focuses on the foreign added value in the export of semi-finished goods, highlighting the role of foreign intermediates in domestic production. Finally, the ninth term, (V9), addresses double-counted semi-finished exports produced overseas, pointing to complexities in tracking value through multiple stages of production and trade.
These terminologies collectively provide a comprehensive framework for analyzing the distribution and flow of value in global trade, offering insights into the intricate workings of GVCs and their impact on national economies. Another model used has been adapted to observe the relationship between a country's GVC and its trading partners as formulated in the position and participation index by adopting VS1*sn and VSsn in Koopman et al. [21].
$GVC\_Position_{\mathrm{sn}}=L n\left(1+\frac{V S 1_{* s n}}{E_{s * n}}\right)-L n\left(1+\frac{V S_{s n}}{E_{s * n}}\right)$
$GVC\_Participation_{\mathrm{sn}}=\frac{V S 1_{* s n}}{E_{S * n}}+\frac{V S_{s n}}{E_{S * n}}$
It defines a country-sector level index for a country's position in the global value chain as the logarithmic ratio of intermediates supplied for other nations' exports to intermediates imported for domestic production.
The numerator is typically significant when the country sector is located upstream in a supply chain. On the other hand, if it is downstream, the denominator is likely to be significant. Of course, two countries may have similar GVC position index values in each sector despite participating in GVCs to varying degrees. As a result, the position index must be used in conjunction with another index that summarizes the relevance of the global supply chain to that country's sector. For this purpose, the use of the formula will result in the following changes.
The position of GVCsn countries in GVCs is GVC_Participationsn, where the participation of countries in GVCs and Es*n are gross exports in each country. VSsn is a vector element obtained from the sum of value-added content matrix columns (excluding domestic industries) related to import/foreign content from other countries' exports. Therefore, the formula becomes:
$V S_s=\sum_{t \neq s}^G \sum_{r \neq s}^G V_t B_{t s} Y_{s r}+\sum_{t \neq s}^G \sum_{r \neq s}^G V_t B_{t s} A_{s r}\left(I-A_{r r}\right)^{-1} Y_{r r}+\sum_{r \neq s}^G V_t B_{t s} Y_{s r} \sum_{r \neq s}^G\left(I-A_{r r}\right)^{-1} Y_{r r} E_{r *}$
$=\sum_{r \neq s}^G V_r B_{r s} Y_{s *}=\sum_{t \neq s}^G \sum_{r \neq s}^G V_t B_{t s} Y_{s r}+\sum_{t \neq s}^G \sum_{r \neq s}^G V_t B_{t s} A_{s r}$
VSs are vectors of elements obtained by summing the lines of the VS1 matrix (excluding domestic industries) relating to the export of domestic semi-finished goods in the exports of other countries in the s country. Then the formula becomes:
$V S 1_s=V_s \sum_{r \neq s}^G \sum_{t \neq s, r}^G B_{r s} Y_{r t}+V_s \sum_{r \neq s}^G \sum_{t \neq s, r}^G B_{s r} A_{r t} X_t+V_s \sum_{r \neq s}^G B_{s r} Y_{r s}+V_s \sum_{r \neq s}^G B_{s r} A_{r s} X_s$
The equation points to a different direction in which countries in the downstream position tend to have a high share of vertical specialization in imports or, in other words, it has foreign content (VS) in its exports, while others in the upstream position tend to have a high share of vertical specialization of exports or, in other words, they have a high share of exports through third countries [21].
GVC activities refer to the production of goods and services involving several countries. International trade involves coordinating activities and the movement of inputs and outputs across national borders. To facilitate grouping based on the number of cross-border countries involved, GVCs are divided into two types: simple GVCs and complex GVCs. A simple GVC involves basic production processes and limited cross-border activities with only one partner country. Meanwhile, a complex GVC involves more advanced production processes and extensive cross-border relations, involving at least two partner countries. This type of value chain is characterized by a higher level of coordination, integration, and dependency between companies and countries [23].
Almost every country engaged in international trade participates in GVCs. A country's participation in GVCs consists of forward participation or backward participation. Backward participation, expressed as a percentage, is the amount of foreign value added included in exports, calculated as a percentage of the country's total exports. This indicator is made by calculating the ratio of added value content in imported goods that are re-exported. Forward participation, expressed as a percentage, is the added value of domestic exports which includes foreign exports, calculated as a percentage of the total exports of export source countries.
In this study, the observed response variable is the GFSI Index, while the predictor variable is the GVC Participation Index. Both variables are categorized as ratio data within the range of (0, 1). Beta regression is employed when the response variable y takes a value in (0, 1) and is assumed to follow the Beta distribution. This can be generalized to variables that take values in open intervals (a, b) through transformations [24].
The Beta Distribution is recognized for its flexibility in modeling data where the response is proportional, as the density can exhibit various patterns depending on the parameter values in this distribution. One of the purposes of Beta regression is to predict μ parameters.
For example, yi = y1, . . . , yn is a random example and yi follows a Beta distribution with the mean μi and φ precision parameters. The regression model equation can be written as:
$g\left(\mu_i\right)=x_i^{\prime} \beta=\eta_i$
where, β = (β1, ..., βk)′ is a regression parameter vector with the size k×1, xi = (xi1, …, xik)′ is the explanatory variable or covariate that is assumed to be fixed and known and ηi is a linear predictor (ηi = β1xi1 + … + βkxik, where xi1 = 1 for all i so the model has an interception), g (.) is the relational function.
The research variables used in the study consist of estimating variables and response variables as described in Table 1 and Table 2.
The predictor variable is a country's participation in GVC production in the agricultural sector. Meanwhile, the response variable is the GFSI developed by The Economist Intelligence Unit (EIU), which consists of four dimensions and one overall score, as explained in Table 2 [25].
Table 1. Predictor variables in Beta Regression analysis
|
Variable |
Description |
|
Xpfs |
Simple forward GVC participation |
|
Xpfc |
Complex forward GVC participation |
|
Xpbs |
Simple backward GVC participation |
|
Xpbc |
Complex backward GVC participation |
Table 2. Response variables in Beta Regression analysis
|
Variable |
Description |
|
Yfs00 |
Overall food security score |
|
Yfs10 |
Food affordability |
|
Yfs20 |
Food availability |
|
Yfs30 |
Quality and safety |
|
Yfs40 |
Sustainability and adaptation |
Data analysis was conducted to study the relationship and influence of GVC participation predictors on the response variables of the GFSI food security dimension using R-Studio software. Conclusions were drawn using statistical tests with a significance level of 1% to determine whether the variable or model was significant. To understand the diversity of the influence of GVC participation on food security based on a country's income level, an additional analysis was performed by including these categories in the Beta Regression. The categorization of countries based on income level refers to the World Bank (2024), which groups the world economy into four income groups: lower-middle-income (below USD 4,255 per capita) consisting of 9 countries, upper-middle-income (between USD 4,256 and 13,205 per capita) consisting of 10 countries, and high-income (above USD 13,206 per capita) consisting of 27 countries.
The analysis is conducted at the country level, encompassing a total of 46 countries. Additionally, regional analysis is performed based on the classifications defined by the World Bank in 2024, as detailed in Table 3.
The classification is updated annually on July 1, based on the Gross National Income (GNI) per capita from the previous year (2021). The GNI is measured in United States dollars (USD) and calculated using a conversion factor derived from the Atlas method. The categorization of countries into income level groups, as defined by the World Bank in 2024, is detailed in Table 4.
Table 3. Country groups by economic region
|
Region |
Number |
Country |
|
Europe & Central Asia |
25 |
Austria, Belgium, Bulgaria, Czech Republic, Denmark, Finland, France, Germany, Greece, Hungary, Ireland, Italy, Kazakhstan, Netherlands, Norway, Poland, Portugal, Romania, Russia, Spain, Slovakia, Sweden, Switzerland, Turkey, United Kingdom |
|
East Asia & Pasific |
12 |
Australia, Cambodia, Indonesia, Japan, South Korea, Laos, Malaysia, Philippines, China, Singapore, Thailand, Vietnam |
|
South Asia |
5 |
Bangladesh, India, Nepal, Pakistan, Sri Lanka |
|
North America |
2 |
Canada, United States |
|
Latin America & Caribbean |
2 |
Brazil, Mexico |
Table 4. Country groups by income level
|
Region |
Number |
Country |
|
High |
27 |
Australia, Austria, Belgium, Canada, Czech Republic, Denmark, Finland, France, Germany, Greece, Hungary, Ireland, Italy, Japan, South, Korea, Netherlands, Norway, Poland, Portugal, Romania, Singapore, Spain, Slovakia, Sweden, Switzerland, United Kingdom, United States |
|
Upper middle |
10 |
Bangladesh, Cambodia, India, Laos, Nepal, Pakistan, Philippines, Sri Lanka, Vietnam |
|
Lower middle |
9 |
Bulgaria, Brazil, Indonesia, Kazakhstan, Malaysia, Mexico, China, Russia, Thailand, Turkey |
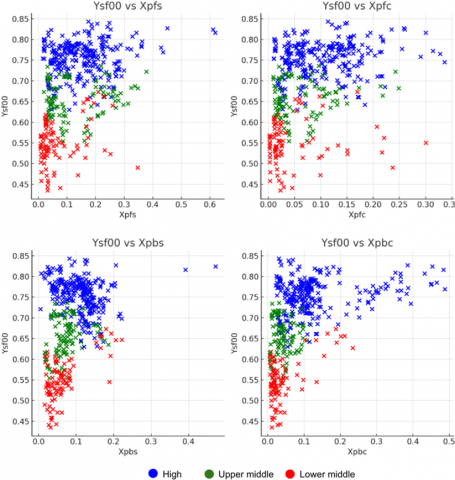
In the early stages, data exploration analysis was used to identify the relationship between GVC participation in the agricultural sector and food security through visual data patterns. Figure 1 presents a scatter plot depicting these relationships across different income levels, while Figure 2 illustrates the relationships across different economic region groups of countries.
Figure 1. The relationship between GVC participation and food security categorized by income level
3.1 GVC participation and food security by income level
The scatter plot in Figure 1 illustrates the relationship between Ysf00 (overall food security) and Xpfs (forward simple GVC participation), demonstrating notable patterns across different income levels. High-income countries exhibit a broad range of GVC participation levels while maintaining relatively high food security scores. This suggests that high-income countries benefit from diverse and extensive engagement in simple global value chains, contributing positively to their food security. Conversely, lower-middle-income countries show a more constrained range of GVC participation, with correspondingly lower food security scores. This trend indicates a potential reliance on local and less complex value chains, which may limit their capacity to enhance food security effectively. Upper-middle-income countries occupy an intermediate position, displaying moderate GVC participation and food security levels. The overall positive trend suggests that increased engagement in forward simple GVCs correlates with improved food security, particularly in higher-income countries.
The relationship between Ysf00 and Xpbc (backward complex GVC participation) offers further insights into the dynamics of food security. High-income countries predominantly demonstrate high levels of forward complex GVC participation, coupled with superior food security outcomes. This strong positive correlation underscores the benefits of integrating into complex global value chains, which likely facilitate access to advanced technologies, better infrastructure, and more efficient distribution networks. Upper-middle-income countries also show a positive association, though their participation levels and food security scores are somewhat lower than those of high-income nations. For lower-middle-income countries, the data suggests limited engagement in forward complex GVCs, correlating with lower food security scores. This disparity points to potential barriers these countries face in accessing and benefiting from more complex value chains, emphasizing the need for targeted interventions to enhance and improve food security.
The scatter plot of Ysf00 against Xpbs (backward simple GVC participation) reveals interesting patterns among different income groups. High-income countries display a wide range of simple backward GVC participation levels, generally maintaining high food security scores. This suggests that high-income countries can manage and benefit from importing basic inputs without compromising food security. Upper-middle-income countries also show a positive trend, albeit with slightly lower food security scores compared to high-income countries. This indicates that participation in simple backward GVCs can contribute to food security but may not be as impactful as forward participation in higher complexity chains. Lower-middle-income countries again exhibit limited participation and lower food security levels, highlighting the challenges they face in integrating into even simple backward GVCs. This underscores the need for policies to enhance their capacity to engage in these value chains, potentially improving their food security status.
The relationship between Ysf00 and Xpbc (backward complex GVC participation) provides further insights into the dynamics of food security. High-income countries again dominate the upper ranges of both participation and food security scores, indicating that these countries effectively leverage complex backward GVCs to bolster their food security. This likely reflects their advanced capabilities in importing and integrating complex inputs into their food systems. Upper-middle-income countries follow a similar, though less pronounced, trend, with moderate participation in complex backward GVCs correlating with relatively high food security scores. Lower-middle-income countries, on the other hand, show minimal engagement in these complex value chains, with correspondingly lower food security outcomes. This pattern highlights the significant challenges lower-middle-income countries face in accessing and benefiting from complex backward GVCs, suggesting that improving their integration into these chains could be a strategic avenue for enhancing food security.
3.2 GVC participation and food security by economic region
The scatter plots in Figure 2 examining the relationship between Ysf00 (overall food security) and Xpfs (forward simple GVC participation) reveal distinct patterns across various economic regions. North America exhibits high levels of food security and a broad range of forward simple GVC participation, suggesting robust integration into simple global value chains and substantial benefits to food security. Europe & Central Asia and East Asia & Pacific also show strong food security, with moderate to high GVC participation levels, indicating well-developed economic structures that support food security through simple GVCs. Conversely, regions such as South Asia display lower food security and limited GVC participation, highlighting challenges in integrating into these value chains. Latin America & the Caribbean occupy an intermediate position, with varying GVC participation and moderate food security, reflecting diverse economic conditions within these regions. The overall trend suggests that higher GVC participation is associated with better food security, particularly in more developed regions.
Figure 2. The relationship between GVC participation and food security categorized by economic region
The relationship between Ysf00 and Xpfc (forward complex GVC participation) emphasizes the role of complex global value chains in enhancing food security. North America and Europe & Central Asia show high levels of complex GVC participation and superior food security, underscoring the benefits of advanced economic integration and technological capabilities. East Asia & Pacific also display a positive correlation, though with slightly lower GVC participation and food security levels, indicating ongoing development in complex value chains. South Asia again lags, with minimal complex GVC participation and lower food security, pointing to significant structural and infrastructural challenges. The Latin America & Caribbean region shows moderate GVC participation, with corresponding food security levels that reflect regional economic disparities. The data suggest that engagement in complex GVCs is a critical factor for achieving higher food security, particularly in regions with advanced economic frameworks.
The scatter plot depicting the relationship between Ysf00 and Xpbs (backward simple GVC participation) indicates varying impacts of importing basic inputs on food security across regions. North America maintains high food security despite a wide range of backward simple GVC participation, highlighting efficient management and utilization of imported inputs. Europe & Central Asia and East Asia & Pacific also show strong food security with moderate to high GVC participation, reflecting their ability to integrate simple imported inputs effectively. South Asia, however, displays lower food security and limited backward GVC participation, underscoring persistent challenges in accessing and benefiting from global value chains. Latin America & the Caribbean show moderate levels of participation and food security, indicating diverse economic conditions and varying degrees of integration into global value chains. The overall positive trend suggests that regions capable of effectively integrating simple imported inputs into their economies tend to achieve higher food security.
3.3 Significance test using beta regression
In the beta regression output of R Studio, the Estimate value will be widely used as the basis for interpreting the analysis results. This value refers to the coefficient of the regression model. This coefficient shows the magnitude of the influence of each independent variable on the dependent variable, considering the type of relationship (positive or negative). In the variable categories by economic region and by income level, the Estimate value shows the effect of each variable category compared to the reference category. For example, Europe & Central Asia shows the difference in log-odds on food security in the Europe & Central Asia region compared to the reference region. A positive Estimate value indicates that the region or income level has higher food security than the reference category, while a negative value indicates the opposite.
The Estimate value for a continuous variable such as Year shows the average change in the log-odds of the dependent variable for each increment of the independent variable. For example, a positive coefficient for Year indicates that food security tends to increase over time. Xpfs, Xpfc, Xpbs, Xpbc are variables that measure the participation of production in the global value chain. A positive coefficient indicates that an increase in participation or length of production is associated with an increase in food security, and a negative coefficient indicates the opposite. The following Table 5 presents a summary of the Beta Regression results, which align with the interpretation framework outlined earlier.
3.4 The effect of GVC participation on total food security
The analysis reveals that GVC participation in the agricultural sector significantly impacts total food security across various regions. In Europe & Central Asia, GVC participation shows a significant positive effect with an estimate of 0.160 (p-value 0.000), indicating that engagement in GVCs can enhance total food security in this region. Conversely, in East Asia & Pacific, GVC participation shows a significant negative effect with an estimate of -0.172 (p-value 0.008), suggesting that participation in GVCs tends to decrease food security in this region. Latin America & the Caribbean and North America also show significant positive effects, while South Asia shows a significant negative effect.
Differences in income levels also affect the relationship between GVC participation and food security. High-income countries exhibit a significant positive effect on total food security, with an estimate of 0.192 (p-value 0.000), indicating that these countries can better manage and utilize GVC participation to enhance their food security. Conversely, upper-middle and lower-middle-income countries show significant negative effects, with estimates of -0.438 (p-value 0.000) and -0.714 (p-value 0.000), respectively, indicating that these countries may face more challenges in leveraging GVC participation to improve their food security.
Among the different types of GVC participation, simple forward participation (Xpfs) shows a significant positive effect on total food security with an estimate of 0.769 (p-value 0.000). Conversely, complex forward participation (Xpfc) shows a significant negative effect with an estimate of -1.381 (p-value 0.000). Simple backward participation (Xpbs) does not show a significant effect, but complex backward participation (Xpbc) shows a significant positive effect with an estimate of 0.685 (p-value 0.000). This indicates that more straightforward and direct involvement in GVCs is more beneficial for food security, while more complex involvement may pose additional challenges.
The beta regression model used shows a pseudo R-squared value of 83.0%, indicating that the model can explain about 83.0% of the variation in total food security. The significant phi coefficient indicates a high level of precision for this model. These values suggest that the beta regression model is robust and can be effectively used to analyze the impact of GVC participation on food security, although there is room for improvement by adding other variables or using more complex models.
3.5 The Effect of GVC participation on food affordability
The results of the beta regression analysis illustrate how various factors influence Food Affordability. Analysis by region shows that Europe & Central Asia (Estimate = -0.06197, p = 0.215) and North America (Estimate = -0.04557, p = 0.639) have no significant influence on Food Affordability. However, Latin America & the Caribbean (Estimate = -0.2810, p < 0.001) and South Asia (Estimate = -0.2153, p < 0.001) have a significant negative influence, suggesting that countries in these regions tend to have lower Food Affordability values compared to the reference region. In addition, analysis by-income level shows that countries with lower-middle income (Estimate = -1.274, p < 0.001) and upper-middle income (Estimate = -0.6110, p < 0.001) have lower Food Affordability values compared to high-income countries.
Other variables such as forward simple GVC participation (Xpfs) (Estimate = 1.133, p < 0.001), backward simple GVC participation (Xpbs) (Estimate = 1.187, p < 0.01), and backward complex GVC participation (Xpbc) (Estimate = 1.208, p < 0.001) also showed a significant positive influence on Food Affordability. On the other hand, forward complex GVC participation (Xpfc) had a significant negative influence (Estimate = -1.131, p < 0.05).
This regression model can be considered quite good and reliable because it has a pseudo R-squared of 0.8161, which shows that about 82% of the variation in Food Affordability can be explained by the independent variables in the model. In addition, all coefficients of the precision model (phi) were also significant (Estimate = 72.969, p < 0.001), which indicates good precision of the model.
3.6 The effect of GVC participation on food availability
The results of beta regression analysis using the dependent variable Food Availability show how various factors affect food availability. From these results, we can see that some variables have a significant influence on food availability, while others do not.
Table 5. Beta regression analysis output with estimate and significance codes
|
Total Food Security |
Affordability |
Availability |
Quality & Safety |
Sustainability & Adaptation |
|||||||||||
|
Est |
P-Value |
Sig |
Est |
P-Value |
Sig |
Est |
P-Value |
Sig |
Est |
P-Value |
Sig |
Est |
P-Value |
Sig |
|
|
By Economic Region |
|||||||||||||||
|
East Asia & Pacific |
-0.172 |
0.008 |
** |
0.205 |
0.035 |
* |
-0.110 |
0.174 |
ns |
-0.589 |
0.000 |
*** |
-0.227 |
0.009 |
** |
|
Europe & Central Asia |
0.160 |
0.000 |
*** |
-0.062 |
0.215 |
ns |
-0.176 |
0.000 |
*** |
0.508 |
0.000 |
*** |
0.449 |
0.000 |
*** |
|
Latin America & Caribbean |
0.176 |
0.000 |
*** |
-0.281 |
0.000 |
*** |
0.115 |
0.100 |
ns |
0.656 |
0.000 |
*** |
0.286 |
0.000 |
*** |
|
North America |
0.120 |
0.017 |
* |
-0.046 |
0.639 |
ns |
-0.201 |
0.006 |
** |
0.607 |
0.000 |
*** |
0.236 |
0.005 |
** |
|
South Asia |
-0.076 |
0.036 |
* |
-0.215 |
0.000 |
*** |
0.194 |
0.001 |
*** |
-0.173 |
0.003 |
** |
-0.065 |
0.329 |
ns |
|
By income level |
|||||||||||||||
|
High |
0.192 |
0.000 |
*** |
0.233 |
0.000 |
*** |
0.113 |
0.000 |
*** |
0.232 |
0.000 |
*** |
0.184 |
0.000 |
*** |
|
Upper Middle |
-0.438 |
0.000 |
*** |
-0.611 |
0.000 |
*** |
-0.434 |
0.000 |
*** |
-0.520 |
0.000 |
*** |
-0.370 |
0.000 |
*** |
|
Lower Middle |
-0.714 |
0.000 |
*** |
-1.274 |
0.000 |
*** |
-0.705 |
0.000 |
*** |
-0.688 |
0.000 |
*** |
-0.427 |
0.000 |
*** |
|
By GVC participation |
|||||||||||||||
|
Simple forward participation |
0.769 |
0.000 |
*** |
1.133 |
0.001 |
*** |
0.094 |
0.719 |
ns |
1.166 |
0.000 |
*** |
1.316 |
0.000 |
*** |
|
Complex forward participation |
-1.381 |
0.000 |
*** |
-1.131 |
0.017 |
* |
-0.882 |
0.024 |
* |
-1.898 |
0.000 |
*** |
-2.324 |
0.000 |
*** |
|
Simple backward participation |
-0.078 |
0.695 |
ns |
1.187 |
0.001 |
** |
0.101 |
0.734 |
ns |
-0.870 |
0.010 |
* |
-0.870 |
0.011 |
* |
|
Complex backward participation |
0.685 |
0.000 |
*** |
1.208 |
0.000 |
*** |
0.766 |
0.000 |
*** |
0.570 |
0.021 |
* |
0.502 |
0.037 |
* |
|
Phi |
|
0 |
*** |
|
0 |
*** |
|
0 |
*** |
|
0 |
*** |
|
0 |
*** |
|
Pseudo R2 |
|
83.00% |
|
|
81.60% |
|
|
46.90% |
|
|
76.00% |
|
|
60.80% |
|
Note: ***: Highly significant (p-value < 0.001); **: Very significant (p-value < 0.01); *: Significant (p-value < 0.05);
Marginally significant (p-value < 0.1); Not significant (p-value≥ 0.1).
First, we look at the influence of the region, where the Europe & Central Asia region has a significant negative influence on food availability (Estimate = -0.1756, p < 0.001), meaning that countries in this region tend to have a lower level of food availability than the reference region. In contrast, the South Asian region has a significant positive influence (Estimate = 0.1944, p < 0.001), suggesting that countries in this region tend to have higher levels of food availability. The North American region also had a significant negative influence (Estimate = -0.2005, p < 0.01), while Latin America & the Caribbean showed no significant influence.
Second, in terms of income level, countries with lower-middle income (Estimate = -0.7054, p < 0.001) and upper-middle income (Estimate = -0.4341, p < 0.001) have lower levels of food availability compared to high-income countries. In addition, as the year progresses, food availability tends to increase, which is indicated by a significant positive coefficient (Estimate = 0.03113, p < 0.001).
Other variables that had a significant influence included forward complex GVC participation (Xpfc), which had a negative influence (Estimate = -0.8815, p < 0.05), and backward complex GVC participation (Xpbc), which had a positive influence (Estimate = 0.7658, p < 0.001). On the other hand, simple forward GVC participation (Xpfs) and simple backward GVC participation (Xpbs) did not show significant influence. The model can account for variations with a pseudo R-squared of 0.4694, meaning that about 47% of variations in food availability can be explained by this model.
3.7 The effect of GVC participation on food quality and safety
Based on beta regression analysis of the Food Quality and Safety variables, it shows how various factors affect food quality and safety. First, we see the influence by region. Europe & Central Asia, Latin America & the Caribbean, and North America all have significant positive influences on food quality and safety (Estimate = 0.5078, p < 0.001; Estimate = 0.6559, p < 0.001; Estimate = 0.6073, p < 0.001, respectively), meaning that countries in these regions tend to have higher levels of food quality and safety than other regions. In contrast, the South Asian region has a significant negative influence (Estimate = -0.1725, p < 0.01), suggesting that countries in this region tend to have lower levels of food quality and safety.
Second, in terms of income, countries with lower-middle income (Estimate = -0.6880, p < 0.001) and upper-middle income (Estimate = -0.5198, p < 0.001) have lower levels of food quality and safety compared to high-income countries. Over time, food quality and safety tend to improve, which is indicated by a significant positive coefficient (Estimate = 0.02818, p < 0.001).
Other variables that have a significant influence are the participation of simple GVC forward (Xpfs), which has a positive influence (Estimate = 1.166, p < 0.001), and the participation of complex GVC backward (Xpbc), which also has a positive influence (Estimate = 0.5699, p < 0.05). On the other hand, the participation of complex GVC forward (Xpfc) and simple GVC backward (Xpbs) had a significant negative influence on food quality and safety (Estimate = -1.898, p < 0.001; Estimate = -0.8700, p < 0.05, respectively).
Region, income, and participation in global value chains play a critical role in determining food quality and safety. This model is quite good at explaining variations in food quality and safety with a pseudo R-squared of 0.7601, meaning that about 76% of variations in food quality and safety can be explained by this model.
3.8 The effect of GVC participation on food sustainability and adaptation
The results of beta regression analysis on variables show how various factors affect food sustainability and adaptation. First, the Europe & Central Asia, Latin America & the Caribbean, and North America regions all had significant positive influences (Estimate = 0.4491, p < 0.001; Estimate = 0.2864, p < 0.001; Estimate = 0.2359, p < 0.01, respectively). This shows that countries in these regions tend to have higher levels of sustainability and food adaptation than other regions. In contrast, the South Asian region did not show a significant influence (Estimate = -0.06547, p > 0.05).
Second, in terms of income, lower-middle-income (Estimate = -0.4271, p < 0.001) and upper-middle-income (Estimate = -0.3703, p < 0.001) countries have lower levels of food sustainability and adaptation than high-income countries. In addition, over time, food sustainability and adaptation tend to increase, which is indicated by a significant positive coefficient (Estimate = 0.05302, p < 0.001).
Other variables that had a significant influence included forward simple GVC participation (Xpfs), which had a positive influence (Estimate = 1.316, p < 0.001), and backward complex GVC participation (Xpbc), which also had a positive influence (Estimate = 0.5023, p < 0.05). On the other hand, the participation of complex GVCs forward (Xpfc) and simple GVC backward (Xpbs) had a significant negative influence on food sustainability and adaptation (Estimate = -2.324, p < 0.001; Estimate = -0.8697, p < 0.05, respectively). The model is quite good with a pseudo R-squared of 0.6077, meaning that about 61% of the variation in food sustainability and adaptation can be explained by this model.
3.9 Interpretation of complex forward GVC participation
The consistently negative impact of complex forward GVC participation (Xpfc) on various food security dimensions suggests that countries engaging in more advanced, multi-stage production processes within GVCs may face challenges that offset potential benefits. Complex forward participation typically involves multiple countries and production stages, which increases dependence on foreign demand and exposes countries to greater market volatility and potential disruptions. For instance, countries with high levels of complex forward participation may experience adverse effects on food security due to fluctuations in global markets, supply chain interruptions, or shifts in demand that disproportionately affect countries reliant on GVCs for agricultural exports.
The complex forward GVC participation may prioritize export-driven production over local food needs, potentially reducing the availability and affordability of food for the domestic population. As countries increase their involvement in complex GVCs, they may allocate more resources toward producing export-oriented goods rather than domestic food crops, which can undermine local food security and lead to higher dependence on food imports. This shift can also impact smallholder farmers and rural communities if large-scale export agriculture marginalizes local food production.
The analysis demonstrates that GVC participation in agriculture significantly impacts various food security dimensions. Simple forward and complex backward participation positively affect food security, including Total Food Security, Food Affordability, and Sustainability & Adaptation, indicating that GVC involvement can enhance food security outcomes. However, complex forward participation has a negative influence, suggesting a need for further study to explore the underlying causes. The findings also reveal regional and income-level differences, with Europe & Central Asia and North America showing higher food security scores than lower-middle and upper-middle-income countries.
To optimize food security benefits from agricultural GVCs, policymakers should tailor strategies to regional and income-specific contexts, with a focus on infrastructure, education, and sustainable agricultural practices. For countries involved in complex forward GVCs, balancing export-oriented production with local food needs through agricultural diversification, domestic value-added processing, and enhanced supply chain resilience can mitigate potential risks. A balanced approach that addresses both export objectives and local food security goals may provide a more sustainable pathway for countries engaged in complex GVC participation, supporting long-term food security and economic stability.
[1] Cattaneo, O., Gereffi, G., Staritz, C. (2010). Global Value Chains in a Postcrisis World: A Development Perspective. World Bank Publications.
[2] Stolzenburg, V., Taglioni, D., Winkler, D. (2019). Economic upgrading through global value chain participation: Which policies increase the value-added gains? In Handbook on Global Value Chains, pp. 483-505. https://doi.org/10.4337/9781788113779.00040
[3] Swinnen, J.F.M., Vandemoortele, T. (2011). Trade and the political economy of food standards. Journal of Agricultural Economics, 62(2): 259-282. https://doi.org/10.1111/j.1477-9552.2011.00294.x
[4] Swinnen, J., Vandevelde, S. (2018). The political economy of food security and sustainability. Encyclopedia of Food Security and Sustainability, 1: 9-16. https://doi.org/10.1016/B978-0-08-100596-5.22328-7
[5] Gereffi, G., Lee, J. (2012). Why the world suddenly cares about global supply chains. Journal of Supply Chain Management, 48(3): 24-32. https://doi.org/10.1111/j.1745-493X.2012.03271.x
[6] Greenville, J., Kawasaki, K., Beaujeu, R. (2017). A method for estimating global trade in value added within agriculture and food value chains. OECD Food, Agriculture and Fisheries Papers, No. 99. https://doi.org/10.1787/5jftc3983thj-en
[7] Humphrey, J., Memedovic, O. (2015). Global value chains in the agrifood sector. United Nations Industrial Development Organization Working Paper, Vienna.
[8] McCullough, E.B., Pingali, P.L., Stamoulis, K.G. (2012). The Transformation of Agri-Food Systems: Globalization, Supply Chains and Smallholder Farmers. Food and Agriculture Organization.
[9] Salvatici, L., Nenci, S. (2017). New features, forgotten costs, and counterfactual gains of the international trading system. European Review of Agricultural Economics, 44(4): 592-633. https://doi.org/10.1093/erae/jbx013
[10] Kazantseva, E.G., Lyamkin, I.I. (2022). The impact of value chains on food security. Food Processing: Techniques and Technology, 52(2): 282-295. https://doi.org/10.21603/2074-9414-2022-2-2363
[11] Balié, J., Del Prete, D., Magrini, E., Montalbano, P., Nenci, S. (2019). Does trade policy impact food and agriculture global value chain participation of sub-Saharan African countries? American Journal of Agricultural Economics, 101(3): 773-789. https://doi.org/10.1093/ajae/aay091
[12] Lim, S., Kim, S.W. (2022). Global agricultural value chains and employment growth. Journal of the Agricultural and Applied Economics Association, 1(4): 402-418. https://doi.org/10.1002/jaa2.34
[13] Zhang, D., Sun, Z. (2023). The impact of agricultural global value chain participation on agricultural total factor productivity. Agriculture, 13(11): 2151. https://doi.org/10.3390/agriculture13112151
[14] Banga, K. (2016). Impact of global value chains on employment in India. Journal of Economic Integration, 31(3): 631-673. https://doi.org/10.11130/jei.2016.31.3.631
[15] McMichael, P. (2013). Value-chain agriculture and debt relations: Contradictory outcomes. Third World Quarterly, 34(4): 671-690. https://doi.org/10.1080/01436597.2013.786290
[16] Mouanda-Mouanda, G. (2019). Global value chains participation for African countries: An overview from UIBE GVC index system. Open Journal of Business and Management, 7(2): 941-962. https://doi.org/10.4236/ojbm.2019.72064
[17] Wang, Z., Wei, S.J., Yu, X., Zhu, K. (2017). Measures of participation in global value chains and global business cycles. National Bureau of Economic Research Working Paper, No. 23222.
[18] Wang, Z., Wei, S.J., Yu, X., Zhu, K. (2017). Characterizing global value chains: Production length and upstreamness. National Bureau of Economic Research Working Paper, No. 23261.
[19] Wang, Z., Wei, S.J., Zhu, K. (2013). Quantifying international production sharing at the bilateral and sector levels. National Bureau of Economic Research Working Paper, No. 19677.
[20] Borin, A., Mancini, M. (2019). Measuring what matters in global value chains and value-added trade. World Bank Policy Research Working Paper, No. 8804.
[21] Koopman, R., Wang, Z., Wei, S.J. (2014). Tracing value-added and double counting in gross exports. American Economic Review, 104(2): 459-494. https://doi.org/10.1257/aer.104.2.459
[22] Leontief, W.W. (1936). Quantitative input and output relations in the economic systems of the United States. The Review of Economics and Statistics, 18(3): 105-125. https://doi.org/10.2307/1927837
[23] Krugman, P.R., Obstfeld, M., Melitz, M.J. (2019). Internationale Trade Theory and Policy. Pearson.
[24] Ferrari, S.L.P., Cribari-Neto, F. (2004). Beta regression for modelling rates and proportions. Journal of Applied Statistics, 31(7): 799-815. https://doi.org/10.1080/0266476042000214501
[25] Economist_Impact. (2022). Global Food Security Index 2022. https://impact.economist.com/sustainability/project/food-security-index/reports/Economist_Impact_GFSI_2022_Global_Report_Sep_2022.pdf.