Taisir Al Jumaili*![]() | Mostafa Sabbagh
| Mostafa Sabbagh![]()
© 2024 The authors. This article is published by IIETA and is licensed under the CC BY 4.0 license (http://creativecommons.org/licenses/by/4.0/).
OPEN ACCESS
This systematic review aims to assess the literature on Indoor Environment Quality (IEQ) factors and sub-indicators in classrooms over the past decade (2014-2024), focusing on models, assessment methods, and tools specific to these factors. The significance of this research lies not only in reviewing IEQ assessment holistically and panoramically (where 44 studies within the last 10 years were reviewed across major scientific databases) to highlight and reaffirm the most frequently measured IEQ sub-indicators, but it also aims to eliminate confusion that might occur for researchers by categorizing the assessment of IEQ. This helps readers clearly identify the specific type of assessment they are exploring, as past research on IEQ often features similar titles but differs in the type of actual assessment, whether it is occupant-based, holistic, multiple factors, or single factor. The main findings of the review highlight the most measured IEQ sub-indicators in the literature for each of the IEQ factors, and they are as follows; 1). For thermal comfort, air temperature and relative humidity are the primary measures. 2) For indoor air quality, the key indicators are CO2 concentration, Volatile Organic Compounds (VOCs), and particulate matter (PM10 and PM2.5). 4) Visual comfort is primarily assessed through illuminance and daylight factor, 3) acoustic comfort focuses on background noise level and reverberation time. Despite numerous studies on specific IEQ factors, there is a lack of comprehensive models integrating multiple components for holistic assessments. Our findings underscore the necessity for ongoing monitoring and enhancement of IEQ in classrooms to improve students' health, well-being, and academic performance. We recommend future research focus on developing a standardized, holistic tool designed specifically for classroom environments. Such a tool should allow for initial and rapid assessments, making it accessible for professionals and non-specialists in IEQ.
indoor environment quality, assessment method, IEQ evaluation models, IEQ tool, classroom
In recent years, there has been an increased awareness about the Importance of Indoor environment quality as the majority of public spend approximately 90% of their life in indoor Environments such as workplaces, residences, and educational institutions [1]. Many individuals spend their daily lives within educational institutions, drawing attention to the significance of creating a healthy indoor environment to support their learning activities. As per the definition set by the world health organization [2], a healthy learning environment is considered as an environment that facilitates living, studying and working for its users [3].
IEQ involves various factors such as air quality, Visual comfort, thermal comfort and acoustic comfort, all of which have a deep effect on the health, well-being, and productivity of students and educators alike. An encouraging educational setting is created with a holistic understanding of IEQ factors and the harmonious interaction of these factors with occupants, external surroundings, and nearby climate conditions. Any deviation from this equilibrium can make the indoor environment uncomfortable and potentially damaging to the health, cognitive functions, mood, and overall learning outcomes [4, 5].
Previous research has been made that reviewed the factors of IEQ in classrooms, however its scope was limited to North America and Europe. This research aims to examine the IEQ factors and Sub-Indicators within a broader scope exceeding previous research and examining the previous research findings, as well as exploring and labeling the different types of IEQ assessments such as Subjective (Occupant based) and Objective (holistic and non-holistic) which is device based and other types of assessment, all undergoing under the umbrella term of IEQ assessment. Which will help future researchers to clearly distinguish their research category to have better focus and clarity in the research process.
This study conducts a systematic review to identify and assess existing literature on Indoor Environment Quality (IEQ) factors and sub-indicators in classrooms, focusing on developing models, assessment methods, or tools specific to classroom environments or similar spaces over the last decade (2014-2024). To ensure a comprehensive review, the following keywords were used: “indoor environment quality” AND “classroom” AND “assessment” and “indoor environment quality” AND “classroom” AND “tool”. These keywords were applied across four major databases: Science Direct, MDPI, Springer, and Google Scholar. The inclusion criteria for the study were publications from 2014 to 2024, research that assesses IEQ, develops a model or an assessment method, or creates an IEQ tool specifically for classrooms or equivalent spaces, and publications in English.
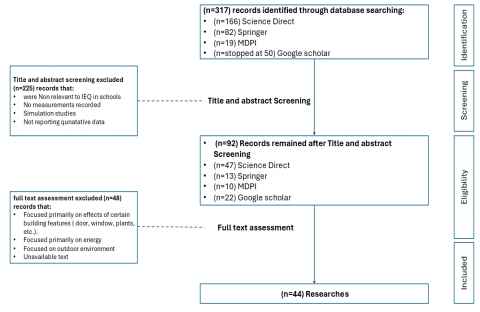
The research was reviewed and analyzed based on the clarity of their results, the next step was to categorize them base on the main topic they are discussing such as effect on health, holistic IEQ assessment, IEQ assessment based on occupants evaluation or evaluating individual factors and etc. Furthermore, detailed information on various IEQ factors and sub-indicators as well as measurement methods and devices were extracted from papers that evaluated IEQ holistically, Individual IEQ factors and IEQ tools. Moreover, surveys and cognitive tests methods and symptoms reporting methods were extracted from Papers that discussed Occupant’s assessment of IEQ or assessing students’ performance. Finally, consistencies, inconsistencies in research were identified and conclusions were established. The described methodology is represented graphically in Figure 1 below:
Figure 1. Research methodology
The initial search yielded a total of 317 studies across the four databases. Titles and abstracts of these studies were screened for relevance, excluding those that:
Resulting in 92 studies for further review. These 92 studies underwent full-text screening, and excluding those:
This screening process led to 44 studies meeting all the inclusion criteria.
The 44 selected studies were then reviewed in detail. Data were extracted on IEQ factors and sub-indicators, measurement methods and devices, and and tools used specifically in classroom settings. The information was synthesized to identify common factors, methodologies, and gaps in the current literature. A qualitative analysis was conducted to categorize and summarize the IEQ factors and sub-indicators identified in the studies. Comparative analysis was performed to evaluate the different models, assessment methods, and tools developed or used in the selected studies. Finally, the quality of the studies was assessed using established criteria for systematic reviews, including the relevance of the research question, the robustness of the methodology, and the clarity of the results. Figure 2 demonstrates graphically the process and results of PRISMA.
Figure 2. PRISMA
4.1 Occupants’ assessment of IEQ
Post occupancy evaluation (POE) have been proven to be a useful tool that enhances design standards in higher education and create better, healthier environments and more efficient buildings, all of which positively impact learning and work performance. POE can be done with interviews, surveys and direct observation [6, 7].
The terms IEQ factors have been used in surveys like the center for built environment survey (CBE Survey) to refer components of IEQ including IAQ, thermal comfort, visual comfort, acoustic comfort, office layout, office furnishing, cleanliness and maintenance. However, these factors are meant to be used by occupants to rate their satisfaction with the indoor environment and not actually physically measure IEQ [8].
Surveys for assessing Occupant’s satisfaction can be done according to EN 16798-1, whereas subjective questionnaires should gather occupants' assessments of thermal sensation, perceived temperature, air quality, and odor intensity. In line with EN 16798-1, six questions are asked regarding perceived thermal comfort, indoor air quality, odor intensity, illuminance, acoustics, and general indoor conditions. Perceived thermal comfort is categorized into warm, slightly warm, neutral, slightly cool, cool, and cold. odor intensity is divided into no odor, weak odor, moderate odor, pungent odor, powerful odor, and overpowering odor. Illuminance and acoustics are rated as acceptable, just acceptable, just unacceptable, or clearly unacceptable. The survey should be conducted separately in winter and summer, with a variety of occupants [9].
These factors are not actually used in their “broad form” to measure or evaluate actual IEQ. Rather, in review articles or research articles that assess IEQ or develop IEQ evaluating tools, more “sub-category’s” is mentioned, referred to usually as IEQ parameters, IEQ components or IEQ sub-indicators [5, 10-12]. For the context of this research the broad categories will be referred to as IEQ factors and the sub-categories will be referred to as IEQ sub-indicators.
Sometimes, student cognitive tests can be used for IEQ assessment, or IEQ assessment can also use the reporting’s of sick building syndrome symptoms that students suffer from, which includes Dry skin, stuffy nose, allergy, asthma, concentration difficulty, cough, throat and nose irritation, eye irritation, headache, fatigue and Eczema. It is worth noting that girls are more sensitive to these health benefits than boys [13-15].
4.2 Holistic IEQ assessment vs non-holistic IEQ assessment
In a review article by Tran et al. [12], where they reviewed 88 articles that measured IEQ Sub-indicators that evaluated IEQ in a variety of classrooms ranging from kindergarten and elementary schools classrooms to high schools and university classrooms in Europe and North America. It was found that all 4 components of IEQ were measured only in 4 out of the 88 reviewed articles (4.5%), followed by 3 components with 8 articles (9%) and 2 components with 28 articles (most of them were measuring thermal comfort and Indoor Air Quality) and the rest measured 1 component (54.5%).
There has been some research that explored other categories relating to IEQ such as Furniture, Amenities, aesthetic and décor. The mentioned elements seemed to have influence on occupants’ perception and comfort. Yet, these elements are hard to be measured and are affected by subjective preferences (i.e., aesthetics). Furthermore, the said study was done for office spaces of a university and more studies need explore these elements in a classroom space [16].
4.3 Weightings of IEQ factors
The weighting of IEQ factors can significantly affect the final rating of IEQ in classrooms, and the weighting is found after surveying the responses from experts, occupants and academics. Each study regarding IEQ in classrooms have a different weighting for IEQ factors and it is affected by respondents’ perception of IEQ factors importance, climate and other factors. In regard to hot arid climates, the most accurate weighting of IEQ factors according would be around TC 0.42, IAQ 0.17, AC 0.19 and VC 0.22 which is similar to the weightings concluded by previous study [17].
4.4 IEQ tool
Although there have been some papers that assess IEQ in educational buildings as a whole [18, 19] and educational spaces such as (i.e., libraries) [20, 21] and many more in classrooms, for example [22, 23]. The mentioned papers do not a provide a tool of assessment to the reader, rather the demonstrate the assessment process and results.
The only tool found in scientific literature for the post occupancy evaluation of classrooms specifically is the (EduTool; IEQ) which is a tool designed specifically to assess the indoor environment quality (IEQ) within primary and secondary school classrooms. Maintaining good IEQ within these spaces is crucial for effective teaching and learning outcomes. The EduTool employs both objective and descriptive methods to gather data and evaluate IEQ conditions [11].
The assessment results are presented visually through an info-graphic format, recognizing that building designers often prefer graphical data representation. the tool provides a rating of a 0-10 scale, with each number representing a rating for the space. The ratings range from bad practice to best practice and next practice. This info-graphic aids in pinpointing specific IEQ issues that may be affecting classroom quality, facilitating targeted and cost-effective remedial actions. Furthermore, the outcomes from EduTool: IEQ can inform and guide future practices for building designers [11].
Even though the tool provides a 0-10 rating of some indicators such as concentration of CO2, which can have a range of values. Yet, it did not show how all indicators’ values will translate to the 0-10 scale. As some indicators like reverberation time or glare control does not have that wide range of values and may require a different value numerical scale to be easier and more realistic. Furthermore, the weighting of the four physical parameters is assumed equal which differs with other research about the weighting of the parameters in schools, which might affect the result outcome.
4.5 Indoor air quality factor and sub-indicators
4.5.1 Indoor air quality common sub-indicators
Poor indoor air quality is linked to heightened health risks and a decline in productivity and overall well-being. Inconsistencies and uncertainties have been identified in the application of the IAQ index, and that is because there are various methods for evaluating health risks and well-being, and research plans often show different Exposure Limit Values (ELVs) for Indoor Air Quality (IAQ) parameters. Additionally, research frequently overlooks complex factors such as additional IAQ parameters, building characteristics, and occupant behaviors, as well as variables like contaminant concentration. Most importantly, there is a lack of a comprehensive, global standard or guideline for IAQ and ELVs across different indoor environments. However, the most used sub-indicators for IAQ assessment in research are CO2 (ppm) and PM10 (µg/m³) are the two most commonly used, followed by other sub-indicators such as PM2.5 (µg/m³), CO (ppm), TVOC (µg/m³), HCHO and NO2 [24, 25].
Volatile organic compounds (VOCs) are among the primary indoor air pollutants contributing to serious health problems in both children and adults. Conversely, many schools have recognized particulate matter as a significant source of indoor air pollution. Additionally, the fungi Penicillium, Cladosporium, Aspergillus, and Alternaria are frequently found in school indoor environments, with their prevalence varying based on climate and whether the location is rural or urban [26].
IAQ can measured with a variety of devices such as Testo models (0635, 480) and the HOBO MX1102, SGP30 and Graywolf IAQ-610 and PC 3016A. IAQ devices can usually measure more than one Sub-indicator such as CO2 concentration, VOC’s, Particulate matter (PM2.5 and PM10) and components, plus they can often times measure thermal comfort sub-indicators such as air temperature and relative humidity [5, 16, 27-29].
4.5.2 CO2 alone as a sub-indicator
Most IEQ assessment methods have relied primarily on measuring CO2 concentration as an indicator for IAQ and ventilation because most studies link the cognitive performance of students with CO2 concentrations [26]. However, there is emerging new evidence that while higher indoor CO2 levels are associated with more reported symptoms, this relationship is not direct and levels of around 2000 ppm. Other pollutants, such as particles and VOCs, should also be measured since CO2 levels alone do not clearly impact students' symptoms [27]. Another study that supported this idea, proved that there is no definitive connection between pure CO2 levels under 2100 ppm and cognitive performance, perceived indoor environment quality, or health symptoms [30]. It is worth noting that the world health organization (WHO) does not consider CO2 as a pollutant but it is being treated as an indicator for the existence of other aerosol pollutants in the indoor environment.
4.5.3 Natural ventilation and IAQ
It has been demonstrated that natural ventilation protocols used during the pandemic, significantly enhanced indoor air quality, positively influencing the learning process and the overall health of students [31].
In a study in Spain that monitored and assessed ventilation, CO2 [10], temperature and sound in a single classroom in a university; it was found that CO2 levels were according to the standard. However, ventilation rates were only acceptable in the one scenario where all doors and windows were open for the north and south facades of the classroom, and that led to indoor temperature and relative humidity being extremely similar to the outdoor temperature, in addition to that it caused the sound pressure levels to exceed the recommended values.
It is worth noting, the monitored classroom is in a climate that is Mediterranean climate which means Classrooms IEQ will react differently in different climates. In addition to that the classroom had two facades with windows (south and north) which is uncommon in school classrooms leading to ventilation rates that are not in compliance with standards and even if doors and still affecting other IEQ components. So, opening the Windows and doors (cross-ventilation) with opening windows and doors is recommended for health emergency situations [32].
Vignolo et al. [33] stated that periodic ventilation is a highly effective method for lowering transmission risk for SARS-CoV-2 and can balance thermal comfort in naturally ventilated spaces during winter. However, it may require additional risk reduction strategies to further decrease the risk values. Finally, we can conclude that the air exchange provided by natural ventilation and air infiltration can be helpful in health related emergencies. But generally, they are insufficient to maintain good indoor air quality due to the unpredictable nature of both processes [34].
An additional passive technique that have some evidence proving its effectiveness to some extent is the use of indoor plants to improve Indoor air quality through reduction of 28% in CO2 and 87% VOC’s. However, more studies should be made to fully support this evidence [15].
4.5.4 Mechanical ventilation and IAQ
Natural ventilation systems often fail to adequately remove pollutants, leading to high rates of complaints even when windows are open. While opening windows can mitigate peak indoor pollution during winter (reduce CO2 concentration), however, this reduction is generally insufficient to meet standard recommendations for healthy environments. Furthermore, it can sometimes be counterproductive. Despite improvements in classic indoor environment indicators, user perception often remains negative or worsens compared to when windows are closed [27].
So it is clear that the air exchange provided by natural ventilation and air infiltration is insufficient to maintain good indoor air quality due to the unpredictable nature of both processes [32] and effectively controlled ventilation systems are necessary to ensure proper indoor air quality and it must be equipped with filtering and cleaning systems, due to sensitivity to external pollutants despite the higher investment and energy costs [27, 35].
Classrooms Indoor Air Quality can be improved by Increasing ventilation rates. More specifically, ventilation interventions can have a notable effect on the reduction of some indoor air pollutants; 1) Air purifiers, 2) changing the ventilation system to work before school hours, 3) installing new ventilation system. Furthermore, mechanical ventilation reducing indoor air pollutants (Most predominantly CO2) in classrooms due to purification measures [26]. Yet, more direct evidence between ventilation and raspatory health is needed [36, 37].
4.6 Thermal comfort
Temperature is the most influential factor in thermal sensation. Maintaining suitable indoor thermal conditions in educational buildings is crucial because they affect student performance [31]. Furthermore, inadequate thermal conditions can hinder students' physiological responses, resulting in decreased learning efficiency [38]. The impact of indoor air temperature on students' thermal perception and learning performance was studied, and it was found that increased thermal satisfaction correlated with improved learning performance, and Optimal learning performance occurred when students felt “slightly warm” [39].
It was found that user satisfaction was the highest when they had controllable thermostat (ability to change the thermal environment around them) and when the thermostat was locked, users were the most dissatisfied. However, since classrooms has a number of students with a spectrum of preferences, controllable thermostat for each student is probably not optimum nor achievable [40, 41].
Measurement devices that a lot of research have been used to measure thermal comfort include Testo models (0635, 0602, 480, 435) and the HOBO MX1102 which some of them can also be used to measure CO2 concentrations [29]. These measurements are taken usually at range of time intervals, might be throughout the year, seasons, months and a period though the day [5, 10, 25, 27]. It is worth noting, that these devices must be in compliance with the ASHRAE 55 or ISO 7731 in qualities such as accuracy and range.
4.7 Visual comfort
As for Natural light (Daylight), research have shown that the harmonious integration of artificial and natural light can produce a vibrant and healthy indoor atmosphere by enhancing the overall ambiance. This interaction not only improves visual comfort and aesthetics but also supports well-being by mimicking natural daylight patterns, reducing eye strain, and boosting mood and productivity. Such a balanced lighting approach can transform indoor spaces into more inviting and health-promoting environments [42].
Visual comfort is measured through a number of sub-indices. Yacine et al. [43] developed a model that predicts glare probability, the model used light meter (Luxmètre_CA_813) that measured a number of parameters; 1) illumination on table 2) eye level illumination, and 3) illumination on the vertical screen. Plus, it used The Aftab Alpha software was utilized to evaluate the following information: 1) average luminance, 2) maximum luminance, and 3) background luminance in the visual field. Thus, it is safe to say that the main visual comfort sub-indices are; 1) Illuminance, 2) Luminance and 3) Glare [12, 43].
Each visual comfort sub indicator has a range of methods for measurements, that varies in complexity, Applicability, Equations and variables. According to Carlucci et al. [44] the best way to measure illuminance is Useful Daylight Illuminance (UDI) and the Discomfort Glare Probability (DGP) is considered the most suitable metric for addressing absolute glare issues. Lastly, regarding color rendering, numerous metrics have been suggested, but none have yet achieved international consensus [44].
Devices that measure illuminance are called lux meter and each paper usually measure illuminance with a different lux meter and there is no consensus between papers on which lux meter to use. Daylight factor can be measured through a certain mathematical formula. However, it can also be measured through a luxmeter and a simple mathematical formula. Finally, Glare is the most complicated sub-indicator to be measured as it need a camera, and a certain computer software to analyze the image taken by the camera and cannot simply be measured with a hand held devices [28].
4.8 Acoustic comfort
Most studies that assess Acoustic comfort, measure it through the sound pressure level of noise (unwanted sounds) which includes mechanical noise (noise from HVAC systems), Structure-borne noise and air-borne noise, all under the umbrella of background noise. Reverberation time and Speech transmission index are also common Sub-indicators for acoustic comfort [45], Less common sub-indicators that have been used in one of the reviewed researches is Room criteria (RC), Noise criteria (NC) and Balanced noise criteria (BNC) [30].
Schools are generally noisier than other environments. There is more noise from students, as well as additional background noise from activities in hallways, music labs, outdoor areas, recreational spaces, mechanical and electrical systems, cafeterias, and break rooms. Children may find background noises more distracting because their ability to differentiate these sounds and understand spoken words enhances as they grow older [28].
The sound pressure of background noise is measure with a decibel meter, and the reverberation time requires a sound level source, a microphone and a computer software for processing. However, there is no uniform devices that most papers use.
4.9 Sub-indicators results
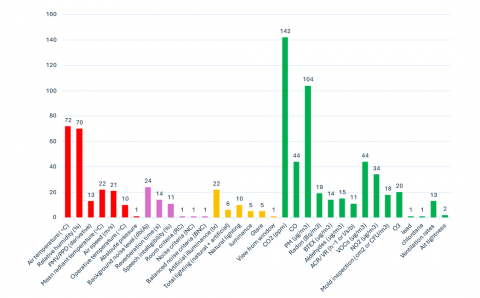
The main findings of the research highlight the identification and reaffirmation of the most frequently measured Indoor Environment Quality (IEQ) sub-indicators in the literature. For thermal comfort, the primary sub-indicators identified are air temperature (℃) and relative humidity (%). In terms of indoor air quality, the focus is on CO2 concentration (ppm), Volatile Organic Compounds (VOCs) (µg/m³), and particulate matter (µg/m³), specifically PM10 and PM2.5. For visual comfort, the key sub-indicators are illuminance (lux) and daylight factor (%), while for acoustic comfort, the crucial measures are background noise level (dB) and reverberation time (seconds). Figure 3 shows IEQ sub-indicators and the frequency they are mentioned in the 44 research including research articles and review articles.
Figure 3. Frequency of times, sub- indicators were measured or assessed in literature
We can conclude from Figure 3 that the most amount of research were about Indoor Air quality and thermal comfort respectively (often in the same paper), followed by Acoustic comfort and lastly Visual comfort. Finally, for a holistic rapid assessment of IEQ in classrooms it would be suitable to take only the most assessed sub-indicators in literature as they would have the most proven side effects on health. However, for a more thorough assessment or when there is a hidden underlying issue more sub-indicators are needed to be added to the evaluation process for the most accurate results.
This systematic review aimed to identify and assess existing literature on Indoor Environment Quality (IEQ) factors and sub-indicators specific to classrooms over the past decade (2014-2024). The studies reviewed provided valuable insights into various assessment methods, models, and tools developed or applied to evaluate IEQ in classrooms. Despite the differences in approaches, methodologies and weighting, common IEQ factors such as air quality, lighting, acoustics, and thermal comfort emerged as critical determinants of the indoor environment in educational settings.
The topic of IEQ has been gaining an increasing attention over the last years. There has been a lot of studies that each explore assessing and measuring IEQ in different methods and in a variety of spaces. Furthermore, there is a broad spectrum of assessments ranging from holistic assessment (all four factors of IEQ) to multiple or single factor assessment and at the same time the assessment can be device based or occupants’ evaluation based. This study distinguishes and categorizes the different types of IEQ assessment to guide future researchers in a focused and clear path when approaching the topic of IEQ. Furthermore, the findings of the research highlight the identification and reaffirmation of the most frequently measured Indoor Environment Quality (IEQ) sub-indicators in the literature. Furthermore, this review underscores the importance of continuous monitoring and improvement of IEQ in classrooms to enhance the health, well-being, and academic performance of students.
In conclusion, the variability in assessment tools and methods underscores the need for standardized approaches to ensure consistency and comparability of results across different studies and contexts. Therefore, the study underscores the need for a standardized, holistic tool to evaluate IEQ in classrooms. This tool should be specifically designed for classroom environments and allow for initial and rapid assessments. It should be practical and easy to use, making it accessible for professionals and non-specialists in IEQ. Such a tool would greatly enhance the ability to ensure optimal indoor environments in educational settings. By advancing our understanding of IEQ and its impact on educational settings, we can better inform policy and practice aimed at creating healthier and more conducive learning environments.
[1] Rupp, R.F., Vásquez, N.G., Lamberts, R. (2015). A review of human thermal comfort in the built environment. Energy and Buildings, 105: 178-205. https://doi.org/10.1016/j.enbuild.2015.07.047
[2] World Health Organization. (2004). The physical school environment: An essential element of a health-promoting school. World Health Organization. https://iris.who.int/bitstream/handle/10665/42683/9241590645.pdf.
[3] Ganesh, G.A., Sinha, S.L., Verma, T.N., Dewangan, S.K. (2021). Investigation of indoor environment quality and factors affecting human comfort: A critical review. Building and Environment, 204: 108146. https://doi.org/10.1016/j.buildenv.2021.108146
[4] Lin, S., Lu, Y., Lin, Z., Romeiko, X.X., Marks, T., Zhang, W., Thurston, G. (2020). Identifying and evaluating school environmental health indicators. Environmental Science and Pollution Research, 27: 16624-16639. https://doi.org/10.1007/s11356-020-08092-w
[5] Zuhaib, S., Manton, R., Griffin, C., Hajdukiewicz, M., Keane, M.M., Goggins, J. (2018). An indoor environmental quality (IEQ) assessment of a partially-retrofitted university building. Building and Environment, 139: 69-85. https://doi.org/10.1016/j.buildenv.2018.05.001
[6] Tookaloo, A., Smith, R. (2015). Post occupancy evaluation in higher education. Procedia Engineering, 118: 515-521. https://doi.org/10.1016/j.proeng.2015.08.470
[7] Yu, X., Liu, L., Wu, X., Wu, X., Wang, Z., Liu, Q., Shi, G. (2017). On a post-occupancy evaluation study of effects of occupant behavior on indoor environment quality in college buildings in Chongqing. Procedia Engineering, 205: 623-627. https://doi.org/10.1016/j.proeng.2017.10.412
[8] Kim, J., De Dear, R. (2012). Nonlinear relationships between individual IEQ factors and overall workspace satisfaction. Building and Environment, 49: 33-40. https://doi.org/10.1016/j.buildenv.2011.09.022
[9] Ahmed, K., Hasu, T., Kurnitski, J. (2022). Actual energy performance and indoor climate in Finnish NZEB daycare and school buildings. Journal of Building Engineering, 56: 104759. https://doi.org/10.1016/j.jobe.2022.104759
[10] Aguilar, A.J., de la Hoz-Torres, M.L., Martínez-Aires, M.D., Ruiz, D.P. (2021). Monitoring and assessment of indoor environmental conditions after the implementation of COVID-19-based ventilation strategies in an educational building in southern Spain. Sensors, 21(21): 7223. https://doi.org/10.3390/s21217223
[11] Soccio, P. (2014). The EduTool: IEQ–A new post occupancy evaluation tool for communicating to building designers information about the indoor environment quality inside classrooms. In Proceedings of the Indoor Air 2014: The 13th International Conference on Indoor Air Quality and Climate, Hong Kong, pp. 93-101.
[12] Tran, M.T., Wei, W., Dassonville, C., Martinsons, C., Ducruet, P., Mandin, C., Wargocki, P. (2023). Review of parameters measured to characterize classrooms’ indoor environmental quality. Buildings, 13(2): 433. https://doi.org/10.3390/buildings13020433
[13] Al-Jokhadar, A., Alnusairat, S., Abuhashem, Y., Soudi, Y. (2023). The impact of indoor environmental quality (IEQ) in design studios on the comfort and academic performance of architecture students. Buildings, 13(11): 2883. https://doi.org/10.3390/buildings13112883
[14] Dorizas, P.V., Assimakopoulos, M.N., Santamouris, M. (2015). A holistic approach for the assessment of the indoor environmental quality, student productivity, and energy consumption in primary schools. Environmental Monitoring and Assessment, 187(5): 259. https://doi.org/10.1007/s10661-015-4503-9
[15] Jamaludin, N.M., Mahyuddin, N., Akashah, F.W. (2016). Assessment of indoor environmental quality (IEQ): Students well-being in university classroom with the application of landscaping. In MATEC Web of Conferences, 66: 00061. https://doi.org/10.1051/matecconf/20166600061
[16] Woo, J., Rajagopalan, P., Francis, M., Garnawat, P. (2021). An indoor environmental quality assessment of office spaces at an urban Australian university. Building Research & Information, 49(8): 842-858. https://doi.org/10.1080/09613218.2021.1944037
[17] Leccese, F., Rocca, M., Salvadori, G., Belloni, E., Buratti, C. (2023). A multicriteria method to identify and rank IEQ criticalities: Measurements and applications for existing school buildings. Energy and Built Environment. https://doi.org/10.1016/j.enbenv.2023.12.004
[18] Kraus, M., Nováková, P. (2019). Assessment of the indoor environment for education. In IOP Conference Series: Earth and Environmental Science, 290(1): 012144. https://doi.org/10.1088/1755-1315/290/1/012144
[19] Rahman, M.A.A., Ling, S.F., Awang, M., Musa, M.K., Hamidon, N., Syazwan, M.S., Ahmad, F. (2020). Evaluation of environmental performance in academic building by indoor environmental quality (IEQ). Journal of Critical Reviews, 7(8): 1309-1319. http://doi.org/10.31838/jcr.07.08.267
[20] Akanmu, W.P., Nunayon, S.S., Eboson, U.C. (2021). Indoor environmental quality (IEQ) assessment of Nigerian university libraries: A pilot study. Energy and Built Environment, 2(3): 302-314. https://doi.org/10.1016/j.enbenv.2020.07.004
[21] Mujan, I., Licina, D., Kljajić, M., Čulić, A., Anđelković, A.S. (2021). Development of indoor environmental quality index using a low-cost monitoring platform. Journal of Cleaner Production, 312: 127846. https://doi.org/10.1016/j.jclepro.2021.127846
[22] Kapoor, N.R., Kumar, A., Alam, T., Kumar, A., Kulkarni, K.S., Blecich, P. (2021). A review on indoor environment quality of Indian school classrooms. Sustainability, 13(21): 11855. https://doi.org/10.3390/su132111855
[23] Tahsildoost, M., Zomorodian, Z.S. (2018). Indoor environment quality assessment in classrooms: An integrated approach. Journal of Building Physics, 42(3): 336-362. https://doi.org/10.1177/1744259118759687
[24] Pourkiaei, M., Romain, A.C. (2023). Scoping review of indoor air quality indexes: Characterization and applications. Journal of Building Engineering, 75: 106703. https://doi.org/10.1016/j.jobe.2023.106703
[25] Schibuola, L., Tambani, C. (2020). Indoor environmental quality classification of school environments by monitoring PM and CO2 concentration levels. Atmospheric Pollution Research, 11(2): 332-342. https://doi.org/10.1016/j.apr.2019.11.006
[26] Sadrizadeh, S., Yao, R., Yuan, F., Awbi, H., Bahnfleth, W., Bi, Y., Li, B. (2022). Indoor air quality and health in schools: A critical review for developing the roadmap for the future school environment. Journal of Building Engineering, 57: 104908. https://doi.org/10.1016/j.jobe.2022.104908
[27] Campano-Laborda, M.Á., Domínguez-Amarillo, S., Fernández-Agüera, J., Acosta, I. (2020). Indoor comfort and symptomatology in non-university educational buildings: Occupants’ perception. Atmosphere, 11(4): 357. https://doi.org/10.3390/atmos11040357
[28] Cochran Hameen, E., Ken-Opurum, B., Son, Y.J. (2020). Protocol for post occupancy evaluation in schools to improve indoor environmental quality and energy efficiency. Sustainability, 12(9): 3712. https://doi.org/10.3390/su12093712
[29] Vilčeková, S., Kapalo, P., Mečiarová, Ľ., Burdová, E.K., Imreczeová, V. (2017). Investigation of indoor environment quality in classroom-case study. Procedia Engineering, 190: 496-503. https://doi.org/10.1016/j.proeng.2017.05.369
[30] Chen, D., Huebner, G., Bagkeris, E., Ucci, M., Mumovic, D. (2023). Effects of short-term exposure to moderate pure carbon dioxide levels on cognitive performance, health symptoms and perceived indoor environment quality. Building and Environment, 245: 110967. https://doi.org/10.1016/j.buildenv.2023.110967
[31] Romero, P., Valero-Amaro, V., Isidoro, R., Miranda, M.T. (2024). Analysis of determining factors in the thermal comfort of university students. A comparative study between Spain and Portugal. Energy and Buildings, 308: 114022. https://doi.org/10.1016/j.enbuild.2024.114022
[32] Meiss, A., Jimeno-Merino, H., Poza-Casado, I., Llorente-Álvarez, A., Padilla-Marcos, M.Á. (2021). Indoor air quality in naturally ventilated classrooms. Lessons learned from a case study in a COVID-19 scenario. Sustainability, 13(15): 8446. https://doi.org/10.3390/su13158446
[33] Vignolo, A., Gómez, A.P., Draper, M., Mendina, M. (2022). Quantitative assessment of natural ventilation in an elementary school classroom in the context of COVID-19 and its impact in airborne transmission. Applied Sciences, 12(18): 9261. https://doi.org/10.3390/app12189261
[34] Poza-Casado, I., Gil-Valverde, R., Meiss, A., Padilla-Marcos, M.Á. (2021). Impact of air infiltration on IAQ and ventilation efficiency in higher educational classrooms in Spain. Sustainability, 13(12): 6875. https://doi.org/10.3390/su13126875
[35] Ranjbar, A. (2019). Analyzing the effects of thermal comfort and indoor air quality in design studios and classrooms on student performance. In IOP Conference Series: Materials Science and Engineering, 609(4): 042086. https://doi.org/10.1088/1757-899X/609/4/042086
[36] Fernandes, A., Ubalde-López, M., Yang, T.C., McEachan, R.R., Rashid, R., Maitre, L., Vrijheid, M. (2023). School-based interventions to support healthy indoor and outdoor environments for children: A systematic review. International Journal of Environmental Research and Public Health, 20(3): 1746. https://doi.org/10.3390/ijerph20031746
[37] Tam, C., Zhao, Y., Liao, Z., Zhao, L. (2020). Mitigation strategies for overheating and high carbon dioxide concentration within institutional buildings: A case study in Toronto, Canada. Buildings, 10(7): 124. https://doi.org/10.3390/buildings10070124
[38] Li, Y., Li, S., Gao, W., Xu, W., Xu, Y., Wang, J. (2022). Exploring the effects of indoor temperature on college students’ physiological responses, cognitive performance and a concentration index derived from EEG signals. Developments in the Built Environment, 12: 100095. https://doi.org/10.1016/j.dibe.2022.100095
[39] Wang, D., Xu, Y., Liu, Y., Wang, Y., Jiang, J., Wang, X., Liu, J. (2018). Experimental investigation of the effect of indoor air temperature on students' learning performance under the summer conditions in China. Building and Environment, 140: 140-152. https://doi.org/10.1016/j.buildenv.2018.05.022
[40] Park, J., Loftness, V., Aziz, A. (2018). Post-occupancy evaluation and IEQ measurements from 64 office buildings: Critical factors and thresholds for user satisfaction on thermal quality. Buildings, 8(11): 156. https://doi.org/10.3390/buildings81101
[41] Tekce, I., Ergen, E., Artan, D. (2020). Structural equation model of occupant satisfaction for evaluating the performance of office buildings. Arabian Journal for Science and Engineering, 45(10): 8759-8784. https://doi.org/10.1007/s13369-020-04804-z
[42] Roy, S., Satvaya, P., Bhattacharya, S. (2024). Effects of indoor lighting conditions on subjective preferences of task lighting and room aesthetics in an Indian tertiary educational institution. Building and Environment, 249: 111119. https://doi.org/10.1016/j.buildenv.2023.111119
[43] Yacine, S.M., Noureddine, Z., Piga, B.E., Morello, E., Safa, D. (2017). Towards a new model of light quality assessment based on occupant satisfaction and lighting glare indices. Energy Procedia, 122: 805-810. https://doi.org/10.1016/j.egypro.2017.07.408
[44] Carlucci, S., Causone, F., De Rosa, F., Pagliano, L. (2015). A review of indices for assessing visual comfort with a view to their use in optimization processes to support building integrated design. Renewable and Sustainable Energy Reviews, 47: 1016-1033. https://doi.org/10.1016/j.rser.2015.03.062
[45] Diaz, M., Piderit, M.B., Attia, S. (2021). Parameters and indicators used in indoor environmental quality (IEQ) studies: A review. Journal of Physics: Conference Series, 2042(1): 012132. https://doi.org/10.1088/1742-6596/2042/1/012132