Anuphat Thirakulwanich![]()
© 2024 The author. This article is published by IIETA and is licensed under the CC BY 4.0 license (http://creativecommons.org/licenses/by/4.0/).
OPEN ACCESS
Green Innovation Management (GIM) has become increasingly prominent over recent years, reflecting a global advancement in responding to environmental challenges through eco-friendly practices. This research illuminates the evolving landscape of GIM research, describing its conceptual emergency and academic significance by undertaking an exhaustive bibliometric analysis, where the growth of GIM literature is valuated, scrutinizing patterns in publications, citations, and collaborations. The study identifies the most relevant institutions, articles, countries, and keywords utilized in research about GIM. The findings reveal a clear alignment between innovation and environmental awareness, highlighting solutions prioritizing environmental impact without compromising developmental objectives as it relates to the authors and institutional collaborations networks involved in studying GIM. The research identifies significant stakeholders and collaborative networks while highlighting regional disparities in how policy frameworks affect GIM research output. The report highlights unexplored regions and suggests further research for academics of sustainable development and green innovation. The paper critically examines the complexity and trend of GIM globally, while providing a strong urge for policymakers, researchers, and practitioners to reinforce their commitment to sustainable innovation and strategies for future environmental action.
Green Innovation Management (GIM), bibliometric analysis, co-authorship networks, citation analysis, environmental technology, eco-innovation
In recent years, there has been a significant increase in attention towards green innovation research [1-3]. Researchers worldwide are motivated by the urgent need to address the environmental challenges we face today. They are incorporating management perspectives to create a new research field called "Green Innovation Management" (GIM). This field is aimed at finding innovative solutions to environmental problems. Bibliometric analysis is being used better to understand the trends and developments in this field. Some recent studies in this area have also contributed to this growing field, investigating its impact on operations and production processes [4-17]. The current shift towards eco-consciousness involves innovative approaches to address environmental challenges and future issues while pursuing present developmental goals. This has led to a surge of academic research promoting green innovation in various contexts and regions [18-25]. By thoroughly analyzing existing literature, researchers can unravel the complexities of green innovation and provide insights into its significance in our societal and environmental geographies. Such investigations are critical in informing policymakers, researchers, and practitioners as they develop innovative solutions to address pressing environmental concerns. This quantitative method examines scientific publications, keywords, institutions, and collaboration patterns involving institutional and national agencies, providing valuable insights into critical topics, influential networks, co-citation capabilities, and emerging developments related to GIM.
This study conducts a thorough bibliometric analysis to chart the growth and patterns in GIM research. This analysis aims to map the research publications in this field and identify the most influential keywords, articles, and institutions influencing GIM research. The author aim to provide a systematic overview of the research efforts thus far, emphasizing existing gaps and potential avenues for future studies by exploring the body of knowledge generated by scholars in GIM. Additionally, the analysis will be a valuable resource for future researchers, empowering them to understand seminal works, research collaborations, and the evolving directions of green innovation research. Exploring green innovation research through bibliometric analysis provides a robust framework for understanding its trends, advancements, and key contributors. The author used a rigorous methodology to gather a large collection of scholarly publications on green innovation. Bibliometric techniques were employed to analyze critical bibliographic data, such as most relevant institutions on green innovation research, top productive countries in green innovation research, top cited countries, most globally and locally cited works, reference publication year spectroscopy, relevant keywords in green innovation research, trend topics, coupling maps, co-word network analysis, thematic map, institutional collaboration networks, country collaboration networks, and collaboration world map. The analysis incorporated a range of bibliometric indicators to evaluate the quality and influence of the identified research outputs [26-30]. The research is anchored of two core research objectives;
1) Conduct a thorough bibliometric analysis to chart the growth and patterns in GIM research.
2) Determine key institutions, articles, countries, and keywords in GIM research, highlighting the integration of innovation with environmental well-being.
Through the integration and examination of bibliometric analysis results, the author aims to uncover the developing areas of focus and prolific topics in green innovation research. With the escalating necessity for eco-friendly solutions, this work adds to the expanding repository of insights that can guide business people, creative minds, scholars, and industry professionals toward inventive approaches to ecological challenges. Moreover, this research study is a useful tool for subsequent investigators, presenting a summary of foundational studies, cooperative endeavors, and the dynamic progression of research themes in green innovation. This research attempts to enrich the current awareness of green innovation by utilizing a thorough bibliometric analysis of contemporary literature. Using data-driven methods, this paper offers crucial revelations about the most influential articles, relevant keywords, and major institutional and country collaborations within this field. These insights are anticipated to propel additional inquiries, encourage partnerships, and ultimately aid in cultivating sustainable methods that support an environmentally friendly tomorrow.
1.1 Research questions for the objectives
Objective 1: Conduct a thorough bibliometric analysis to chart the growth and patterns in GIM research.
1). How has the volume of published research on GIM evolved?
2). What are the predominant patterns and trends in GIM research publications?
3). Which journals most frequently publish research on GIM?
4). What are GIM studies' most common research methodologies and theoretical frameworks?
5). How does the citation network of GIM research articles demonstrate the development and diffusion of knowledge in this field?
Objective 2: Determine critical institutions, articles, countries, and keywords in GIM research, highlighting the integration of innovation with environmental sustainability.
6). Which institutions are the leading contributors to GIM research, and what is their relative impact?
7). What are the most influential articles in the field of GIM, based on citation analysis?
8). Which countries are the primary contributors to GIM research, and how does their contribution vary over time?
9). What are the key keywords and topics associated with GIM research, and how do they reflect the integration of innovation and environmental sustainability?
10). How do collaboration patterns among researchers, institutions, and countries influence the dissemination of GIM research findings?
The history of green innovation in Asia is complex and influenced by the region's distinctive socio-economic and environmental conditions; the roots of green innovation can be traced back to traditional environmental practices embedded in Asian cultures [31, 32]. However, the contemporary trend of green innovation began to take shape in the late 20th century as Asian countries grappled with rapid industrialization and its associated environmental impacts [33, 34]. Japan was a pioneer in this regard, with its post-war economic boom leading to severe pollution issues that prompted the government to implement stringent environmental regulations and invest in clean technologies; by the 1980s and 1990s, Japan had emerged as a global leader in green technology, particularly in energy efficiency and waste management [35-37]. The late 20th and early 21st centuries saw other Asian nations, particularly the "Tiger" economies of South Korea, Taiwan, Singapore, and Hong Kong, incorporating green innovation into their development strategies [38, 39]. South Korea, for instance, launched the Green Growth Strategy in 2008, aiming to harmonize economic growth with environmental sustainability [40, 41]; with its rapid economic expansion and consequent environmental degradation, China has also been a significant player in green innovation [42]. In the mid-2000s, China began investing heavily in renewable energy, becoming the world's largest producer of solar panels and wind turbines [43]; the Chinese government's commitment to green innovation was further solidified with initiatives like the 13th and 14th Five-Year Plans, emphasizing sustainable development and environmental protection [44].
Asia is at the forefront of green innovation, with significant advancements and investments in renewable energy, sustainable agriculture, and green manufacturing; China continues to lead in renewable energy production and adopting electric vehicles (EVs), driven by government policy and market forces [45]. Another major player in India has made substantial strides in solar energy, as evidenced by initiatives like the National Solar Mission, which aims for 100GW of solar power by 2022 [46, 47]. Southeast Asian nations, including Vietnam, Thailand, and Indonesia, are also increasingly focusing on renewable energy and sustainable practices, driven by international commitments and domestic environmental challenges [48, 49]. Thailand started experimenting with green innovation in the late 20th century, concentrating first on environmental preservation and sustainable agriculture [50, 51]. The country has made significant strides in renewable energy, particularly solar and biomass [52]. Thailand's Alternative Energy Development Plan (AEDP) aims to increase the share of renewable energy to 30% by 2037 while critically investing in energy efficiency and green transportation initiatives [53]. Despite regulatory hurdles and financial constraints, Thailand continues to advance its green innovation agenda, contributing to regional sustainability efforts in Southeast Asia [54, 55].
Even with these advancements, there are still issues; many Asian countries face significant obstacles in balancing rapid economic growth with environmental sustainability [56, 57]. Issues such as air and water pollution, deforestation, and the impact of climate change are pressing concerns that require continuous innovation and effective policy implementation [58]. Also, the disparity in technological capabilities and financial resources across the region presents an obstacle to uniform progress in green innovation [59, 60]. Green innovation in Asia has evolved from traditional ecological practices to a modern, technology-driven approach to addressing the environmental challenges of rapid industrialization and urbanization; while significant progress has been made, particularly in renewable energy and sustainable practices, ongoing efforts are required to ensure that the entire region can benefit from green innovation [42, 47, 49], and also highlight that the commitment of Asian countries to environmental sustainability, supported by technological advancements and policy frameworks, will be crucial in shaping the future of green innovation in the region.
European green innovation has a long and transformative history, evolving from conventional environmental policies to state-of-the-art technology innovations targeted at sustainability [61-63]. This journey began in the early 20th century when European countries recognized industrialization's environmental impacts; initial efforts focused on addressing pollution and conserving natural resources, setting the stage for more comprehensive environmental policies and innovations [64, 65].
In the post-World War II era, Europe saw a resurgence of industrial activity, which brought about significant environmental degradation; the 1960s and 1970s marked the beginning of modern European environmentalism, driven by growing public awareness and scientific understanding of pollution and its effects on human health and ecosystems [66, 67]. Countries like Sweden and Germany pioneered this movement, implementing some of the first comprehensive environmental laws and regulations to control emissions and protect natural habitats [68, 69]. By the 1980s, the European Union (EU) began to take a more active role in environmental policy, leading to a unified approach to green innovation; establishing the Single European Act in 1987 included a commitment to environmental protection, marking a significant step towards integrating sustainability into European policy [70, 71]. The 1990s saw further advancements with the adoption of the Maastricht Treaty, which formally incorporated environmental protection into EU objectives [72, 73]. The early 21st century brought about a new wave of green innovation in Europe, driven by the urgent need to address climate change; the EU launched several ambitious initiatives, including the European Climate Change Programme (ECCP) in 2000, which aimed to meet the Kyoto Protocol targets; the EU Emissions Trading System (EU ETS), introduced in 2005, became the world's largest carbon market, incentivizing reductions in greenhouse gas emissions through a cap-and-trade system [74, 75].
Poland's journey in green innovation is particularly noteworthy. Historically reliant on coal for energy, Poland has faced significant challenges transitioning to a more sustainable energy mix [76]. However, in recent years, Poland has made considerable strides in green innovation; it has invested in renewable energy sources, particularly wind and solar power, to diversify its energy portfolio and reduce its carbon footprint [77]. The Polish government has also implemented policies to promote energy efficiency and support the development of clean technologies [78]. One of Poland's significant achievements in green innovation is the growth of its wind energy sector; the country has abundant wind resources, particularly in its northern and western regions [76, 79]. Over the past decade, Poland has rapidly expanded its wind energy capacity, becoming one of the leading wind energy producers in Central and Eastern Europe; favorable government policies have supported this shift, including feed-in tariffs and auctions for renewable energy projects [80]. Solar energy is another area in which Poland has made significant progress; the government has introduced various incentives to encourage the adoption of solar power, including subsidies for residential and commercial installations [77]. These efforts have substantially increased the number of solar panels installed nationwide, contributing to Poland's renewable energy goals [81]. Poland's commitment to green innovation is also evident in its efforts to improve energy efficiency; it has implemented numerous programs to reduce energy consumption in buildings, industries, and transportation [80]. Initiatives such as the Thermomodernization Fund provide financial support for energy efficiency projects, helping reduce greenhouse gas emissions and lower consumer energy costs [82].
Beyond Poland, other European countries have continued to lead in green innovation; Germany's Energiewende (energy transition) policy aims to shift the country towards a sustainable energy system based on renewable energy, energy efficiency, and the phasing out of nuclear power [78]. Germany is also a global leader in green technologies, with significant investments in research and development [83]. Scandinavian countries, including Sweden, Denmark, and Norway, have consistently ranked among the top performers in green innovation; Sweden's carbon tax, introduced in 1991, has successfully reduced emissions and promoted renewable energy [84]. Denmark has become a world leader in wind energy, with wind power accounting for a substantial share of its electricity production [85]. With abundant hydropower resources, Norway has focused on electrifying its transport sector, becoming a global leader in electric vehicle adoption [86]. The European Green Deal, launched in 2019, represents the EU's most ambitious effort to achieve sustainability; it outlines a roadmap for making the EU climate-neutral by 2050, with targets for reducing greenhouse gas emissions, increasing renewable energy use, and promoting circular economy practices [87]. Key initiatives under the Green Deal include the European Climate Law, the Circular Economy Action Plan, and the Just Transition Mechanism, which aims to support regions and communities most affected by the transition to a green economy [88].
The research employs a bibliometric analysis method to identify significant scientific contributions in the field of GIM in academic publications. The main goal of performing a systematic literature review is to pinpoint key scientific advancements relevant to the particular area of study. This method helps to reduce potential biases or errors, bolsters the reliability and impact of the subsequent evidence, and provides more solid conclusions that assist in recognizing patterns and guiding informed decisions. We utilized Scopus, a globally acknowledged academic resource, to thoroughly search for scholarly works on green innovation [89]. This investigation focused on "Green Innovation" publications from January 1, 2019, to March 31, 2023, to grasp the latest developments in this area of scholarship. The search scope for "green innovation" concentrated specifically on titles, abstracts, and keywords. Initially, our query in the "green innovation" search field yielded 2,627 papers. This number was refined by selecting only those published from 2019 to 2023. Author then narrowed the results to English-language articles, arriving at 1,887 papers. These papers form the basis for this bibliometric analysis.
Employing bibliometric methods, scholars can examine and interpret data, leveraging repositories that house scientific information and applying various quantitative approaches to conduct research. This strategy aids in discerning and assessing recurring trends pertinent to a given subject, ranging from the country of origin, influential scholars, and primary journals to the research domains. Bibliometric analysis is a prevalent tool in academic research to gauge the impact of themes and concepts. It also highlights the substantial impact of many academic journals, educational institutions, and diverse geographical regions [90, 91]. For the analysis, author have used tools like Biblioshiny to analyze the bibliometric findings [92], producing clear-cut results that include illustrative visuals, graphs, and tables to simplify the intricate search data [93]. This software tool aids in demonstrating relationships through co-citations and bibliographic coupling in presentations and during the initial stages of research. Bibliographic coupling occurs when two works cite a third common article within their references, pointing to a connection between them [94, 95]. Co-citation, on the other hand, captures the instances where two documents are frequently cited together, indicating a shared subject matter [96, 97].
Table 1. Overview of general bibliometric information
|
Description |
Results |
|
General Information About Study Data |
|
|
Timespan |
2019-2023 |
|
Sources (journals, books, etc.) |
404 |
|
Documents |
1887 |
|
Annual growth rate % |
45.28 |
|
Document average age |
1.25 |
|
Average citations per doc |
15.32 |
|
References |
112853 |
|
Document Contents |
|
|
Keywords plus (ID) |
4268 |
|
Author's keywords (DE) |
4281 |
|
Authors |
|
|
Authors |
3363 |
|
Authors of single-authored docs |
92 |
|
Authors Collaboration |
|
|
Single-authored docs |
105 |
|
Co-Authors per doc |
3.47 |
|
International co-authorships % |
30.47 |
|
Document Types |
|
|
Article |
1887 |
* Author's Keywords (DE)=Author generated keywords
Keywords Plus (ID)=Computer-generated keywords
The examination of scholarly works retrieved from the Scopus repository separates the information into distinct categories: general data details, document substance, authorship, collaborative authorship patterns, and types of documents. The key data points to an average of 377.4 publications annually from 2019 to 2023. Additionally, this dataset shows a significant yearly increase in publication numbers at a rate of 45.28%. The average number of citations per document stands at 15.32, with the documents having an average age of 1.25 years. In the studies reviewed, there were 112,853 references cited in total. This body of research includes 3,363 individual authors, 92 of whom have published independently and contributed to 105 individual publications. There is an average of 3.47 co-authors per document. The data on international co-authorship reveals that 30.47% of the papers were collaborative efforts between authors from different nations. Table 1 lays out the overall data.
4.1 Most relevant institutions on green innovation
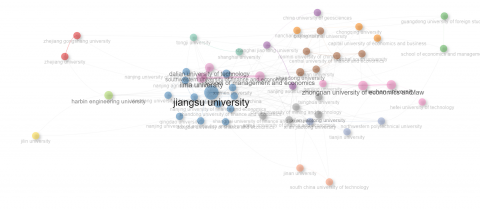
As seen in the three-fold plot in Figure 1 and Table 2, it is evident that Chinese institutions dominated the top 20 institutions that have made significant contributions to green innovation research. Given the country's industrial growth and associated environmental concerns, this might reflect China's growing interest and emphasis on sustainable development and green technologies [98-101]. Among the predominance of Chinese institutions, Ilma University in Pakistan stands out at number ten. Jiangsu University is the leading institution in the number of green innovation research-affiliated authors, with 61 articles. Xi'an Jiaotong University, Wuhan University, and a trio of institutions-Harbin Engineering University, Southwestern University of Finance and Economics, and Zhongnan University of Economics and Law-are also significant contributors, each producing over 35 articles.
There is a similar research profile among several institutions. For instance, Shandong University of Finance and Economics, Shandong University, Shanghai University, Ilma University, School of Management and Economics, Xi'an Jiaotong University, and Xiamen University have articles ranging from 30 to 36. The list showcases a variety of universities. Some of these are technical or engineering-focused, like Harbin Engineering University, while others, like Southwestern University of Finance and Economics, focus more on economics and finance. This diversity suggests that green innovation is a multidisciplinary topic of interest, engaging researchers from various academic backgrounds.
Table 2 provides an overview of the growth of green research article publications over time by various institutions. Several key insights and patterns can be drawn from this data. Many institutions have seen a remarkable increase in green research articles. For example, Anhui University of Finance and Economics went from 1 article in 2019 to 26 in 2023. Similarly, Central South University increased its output from 3 articles in 2019 to 29 in 2023. Jiangsu University had the highest output in 2023, having published 61 articles, marking a significant increase from just 1 article in 2019. Some institutions had zero publications initially but experienced a surge in later years. For example, Zhongnan University of Economics and Law had no publications in 2019 and 2020 but reached 37 articles by 2023. Some universities, like Wuhan University and Harbin Engineering University, showed consistent growth year over year. While most institutions have shown growth, some, like Xi'an Jiaotong University and Xiamen University, have relatively stable numbers, suggesting a consistent focus on green research. Some institutions, like China University of Mining and Technology and Jilin University, had not published in the first couple of years but have caught up considerably by 2023. Nearly every institution has increased its research output in green innovation from 2019 to 2023, suggesting a broader trend in the academic community toward prioritizing sustainability and green innovation research.
Table 2. Top 20 most relevant institutions in green innovation research
|
S/No. |
Affiliation |
Articles |
|
1 |
Jiangsu University |
61 |
|
2 |
Xi'an Jiaotong University |
57 |
|
3 |
Wuhan University |
43 |
|
4 |
Harbin Engineering University |
37 |
|
5 |
Southwestern University of Finance and Economics |
37 |
|
6 |
Zhongnan University of Economics and Law |
37 |
|
7 |
Shandong University of Finance and Economics |
36 |
|
8 |
Shandong University |
31 |
|
9 |
Shanghai University |
31 |
|
10 |
Ilma University |
30 |
|
11 |
School of Management and Economics |
30 |
|
12 |
Xiamen University |
30 |
|
13 |
Central South University |
29 |
|
14 |
Zhejiang Gongshang University |
28 |
|
15 |
Anhui University of Finance and Economics |
26 |
|
16 |
Dalian University of Technology |
26 |
|
17 |
Northwestern Polytechnical University |
26 |
|
18 |
China University of Mining and Technology |
25 |
|
19 |
Jilin University |
25 |
|
20 |
Zhejiang University |
25 |
4.2 Top productive countries in green innovation research
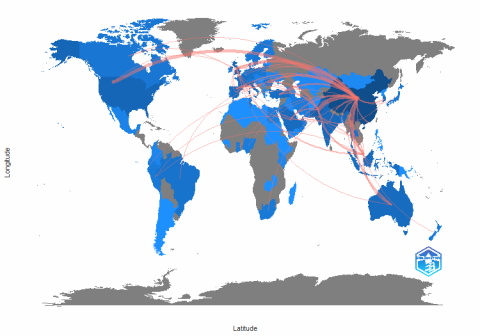
As supported by previous analysis, China remains the clear leader, with 1226 articles, substantially higher than any other country (see Table 3). Its frequency ratio reflects this dominance, capturing around 65% of all publications. The MCP_Ratio offers an insight into the collaborative nature of the research. For instance, countries like Malaysia, Pakistan, the United Kingdom, the United Arab Emirates, and France have high MCP ratios, indicating that a significant portion of their green innovation research involves international collaboration. Apart from China, countries like Malaysia, Pakistan, India, and Indonesia are among the top contributors. This emphasizes the increasing focus on green innovation in emerging economies. Italy and Spain stand out in Europe with a notable number of articles, followed closely by the United Kingdom. Italy, in particular, has almost half of its publications due to international collaborations, as indicated by its MCP_Ratio. The USA, United Kingdom, Germany, Australia, and Japan all have a meaningful output, suggesting a balanced contribution from these developed nations. However, it is interesting that their numbers are comparable to or even less than some emerging economies. The United Arab Emirates has a relatively lower total number of articles and a high MCP ratio of around 78%. This might suggest that the UAE is tapping into international expertise for green innovation research. Figure 1 supports the data presented in Table 3 by showing the country scientific production of green innovation research.
4.3 Top cited countries in green innovation research
Table 4 provides insights into the top-cited countries in green innovation research based on Total Citations (TC) and Average Article Citations. It shows various countries, from highly developed nations to emerging economies. This underlines the global nature of the challenges and solutions associated with green innovation and how nations worldwide contribute to this discourse. While China is the most-cited country with 17,756 total citations, its average citation per article is 14.5, suggesting a vast number of publications with a moderate citation rate per article. The UAE has an average of 136.4 citations per article despite having a lower total number of citations. This indicates that while the volume of publications might be less compared to countries like China, the research emanating from the UAE is highly influential and frequently cited. Italy, the United Kingdom, and Spain are among the top-cited European nations. The UK, in particular, boasts a high average of 28 citations per article. Australia has a commendable average of 38.7 citations per article, indicating the impactful nature of its research in green innovation.
Table 3. Top productive countries in green innovation research
|
S/No. |
Country |
Articles |
SCP |
MCP |
Frequency |
MCP Ratio |
|
1 |
China |
1226 |
948 |
278 |
0.64970853 |
0.22675367 |
|
2 |
Italy |
43 |
22 |
21 |
0.02278749 |
0.48837209 |
|
3 |
Malaysia |
36 |
9 |
27 |
0.0190779 |
0.75 |
|
4 |
Pakistan |
35 |
8 |
27 |
0.01854796 |
0.77142857 |
|
5 |
India |
34 |
29 |
5 |
0.01801802 |
0.14705882 |
|
6 |
Indonesia |
22 |
21 |
1 |
0.01165872 |
0.04545455 |
|
7 |
Korea |
20 |
11 |
9 |
0.01059883 |
0.45 |
|
8 |
Spain |
20 |
12 |
8 |
0.01059883 |
0.4 |
|
9 |
United Kingdom |
20 |
5 |
15 |
0.01059883 |
0.75 |
|
10 |
USA |
20 |
8 |
12 |
0.01059883 |
0.6 |
|
11 |
Thailand |
16 |
11 |
5 |
0.00847907 |
0.3125 |
|
12 |
Germany |
15 |
5 |
10 |
0.00794913 |
0.66666667 |
|
13 |
Australia |
14 |
6 |
8 |
0.00741918 |
0.57142857 |
|
14 |
Brazil |
14 |
8 |
6 |
0.00741918 |
0.42857143 |
|
15 |
Turkey |
13 |
5 |
8 |
0.00688924 |
0.61538462 |
|
16 |
Saudi Arabia |
12 |
5 |
7 |
0.0063593 |
0.58333333 |
|
17 |
United Arab Emirates |
9 |
2 |
7 |
0.00476948 |
0.77777778 |
|
18 |
France |
8 |
2 |
6 |
0.00423953 |
0.75 |
|
19 |
Japan |
8 |
5 |
3 |
0.00423953 |
0.375 |
Note:
ˑ SCP: Single Country Publications-these are publications where all authors are from the specified country.
ˑ MCP: Multiple Country Publications-these are publications where authors are from different countries.
ˑ Frequency: Frequency ratio of the country's publications to the total.
ˑ MCP_Ratio: Ratio of multiple country publications to the total number of articles.
Figure 1. Country scientific production
Table 4. Top cited countries
|
S/No. |
Country |
TC |
Average Article Citations |
|
1 |
China |
17756 |
14.5 |
|
2 |
United Arab Emirates |
1228 |
136.4 |
|
3 |
Italy |
655 |
15.2 |
|
4 |
United Kingdom |
561 |
28 |
|
5 |
Australia |
542 |
38.7 |
|
6 |
Malaysia |
462 |
12.8 |
|
7 |
Usa |
461 |
23 |
|
8 |
Brazil |
422 |
30.1 |
|
9 |
Turkey |
418 |
32.2 |
|
10 |
Thailand |
342 |
21.4 |
|
11 |
Korea |
317 |
15.8 |
|
12 |
India |
271 |
8 |
|
13 |
Finland |
242 |
80.7 |
|
14 |
Spain |
240 |
12 |
|
15 |
Denmark |
235 |
78.3 |
|
16 |
Indonesia |
217 |
9.9 |
|
17 |
Pakistan |
217 |
6.2 |
|
18 |
Germany |
177 |
11.8 |
|
19 |
Norway |
159 |
31.8 |
|
20 |
South Africa |
103 |
14.7 |
Countries like Malaysia, Brazil, Turkey, Thailand, and India are also on the list, emphasizing the importance and impact of green research from emerging economies. Brazil and Turkey, in particular, have a relatively high average citation per article. Although smaller in total citations, Finland, Denmark, and Norway have high average article citations (80.7, 78.3, and 31.8, respectively), suggesting that their research, though possibly fewer in numbers, carries significant weight in the academic community. The USA, known for its vast research output, has an average of 23 citations per article, suggesting a good balance between the quantity and quality of research. Countries like the UAE, Australia, the UK, Brazil, Turkey, and the Nordic countries (Finland, etc.) show that the quality and impact of research can be more significant than the sheer volume of publications. Despite their contribution to the research volume, some countries have lower average citations, such as India, Indonesia, and Pakistan. This might suggest newer research that has not had time to accumulate citations or areas where more impactful research could be pursued.
4.4 Most globally cited research in green innovation research
Table 5 highlights the most globally cited papers on green innovation. Several papers have accumulated a significant number of citations within the study period. "Singh SK, 2020" has received 539 total citations (TC), translating to 134.75 total citations per year (TC/Year). This indicates the paper's high relevance and significance in the field. The total number of citations serves as a measure of the overall influence of an article, while the citations per year (TC/Year) offer valuable insights into its current significance. For instance, "Yu CH, 2021" and "Xu L, 2021" have high TC/Year values of 76.3333333 and 66.6666667, respectively, indicating their immediate impact and relevance in green innovation research. Normalized TC is a metric that allows for comparing the citation impact of papers against each other, irrespective of the time since their publication [102, 103]. Higher values here indicate a more significant impact on a standardized scale. The "Singh SK, 2020" paper stands out with a normalized TC of 13.8642046, emphasizing its influential status. Several papers from 2021, like "Yu CH, 2021", "Xu L, 2021", and "Lv C, 2021", have made it to the list, highlighting their immediate recognition and significance in green innovation research. The DOI of the publisher, starting with "10.1016", refers to Elsevier's platform dominating the list, emphasizing the publisher's significant role in disseminating impactful research on green innovation. While all papers deal with green innovation, the specific journals they are published in (e.g., "j.techfore" for Technological Forecasting and Social Change, "j.jclepro" for Journal of Cleaner Production, "j.enpol" for Energy Policy) hint at the diverse range of topics and disciplines covered within the umbrella of green innovation. The list features a variety of authors from different research backgrounds, signifying the multidisciplinary nature of green innovation research.
4.5 Top local cited research in green innovation research
Table 6 displays the top-cited local papers on green innovation. Most papers were published under the "10.1016" DOI prefix, corresponding to Elsevier [104]. This suggests that Elsevier, particularly journals like "Technological Forecasting and Social Change" and "Journal of Cleaner Production," might be significant platforms for propagating green innovation research. The top paper, "Singh SK, 2020," received a distinctive number of local citations (170) relative to its global citations (539), underlining its prominence in the local context or the paper's relevance to regional issues. The ratio column shows the paper's influence on the local scene versus its global impact. For instance, "Zhang D, 2019" has a local citation percentage of around 50.63%, indicating that about half of its citations come from local references, suggesting its potential regional significance. The papers have relatively high normalized local and global citations. This metric helps compare the influence of papers irrespective of their publication year. For instance, "Singh SK, 2020" has the highest normalized global citation of around 13.86, indicating its significant impact when adjusted for age.
Multiple scholarly articles published in 2021, such as "Yu CH, 2021" and "Hu G, 2021," have garnered significant attention and citations, underscoring their current significance and relevance within green innovation scholarship. Although many papers are from journals focused on technology forecasting and cleaner production, there are papers from diverse journals like "Energy Policy," "Energy Economics," and "Sustainable Cities and Society," indicating the multifaceted nature of green innovation research. Table 6 also provides a "Ratio" column, which offers insights into the local influence of the research. Papers with a high ratio, like "Zhang D, 2019," might address issues or methodologies particularly relevant to the local community or region. Specific authors, such as "Singh SK" and "El-Kassar AN," seem significant contributors to the domain, given their positioning in the list.
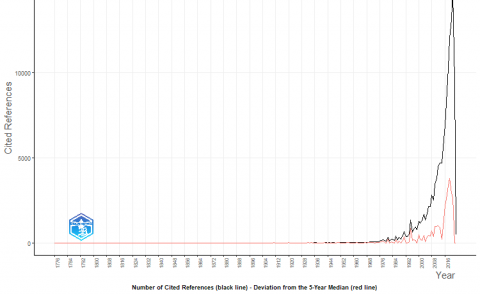
4.6 Reference publication year spectroscopy (RPYS)
RPYS allows to identify the most influential years (and, by proxy, publications from those years) within a given dataset based on the number of citations. The method is especially useful for revealing historical antecedents of research trends [105, 106]. The RPYS is produced for green innovation research and presented in Figure 2. We can deduce that 1776 was the first year of the dataset and a year of significant historical importance in other contexts (e.g., the U.S. Declaration of Independence). It is noteworthy to observe the inclusion of a publication from such a time. There was some traction in the 19th century in 1841, 1846, 1862, 1879, 1885, 1890, 1898, 1899, and 1903. The early-to-mid 20th century shows sporadic peaks, suggesting some years with notably impactful publications.
Between the 1960s and 1980s, the frequency of citations and the number of standout years increased, indicating a potential growth or evolution of green innovation during this period. The 1990s and 2020s saw a steep rise in citations, which indicates a dramatic growth or interest in green innovation.
Figure 2. RPYS for green innovation research
Table 5. Most global cited articles on green innovation
|
Paper |
DOI |
TC |
TC/Year |
Normalized TC |
|
Singh SK, 2020 |
10.1016/j.techfore.2019.119762 |
539 |
134.75 |
13.8642046 |
|
El-Kassar AN, 2019 |
10.1016/j.techfore.2017.12.016 |
431 |
86.2 |
7.9316464 |
|
Hashmi R, 2019 |
10.1016/j.jclepro.2019.05.325 |
333 |
66.6 |
6.128163 |
|
Sun H, 2019 |
10.1016/j.enpol.2019.111002 |
320 |
64 |
5.8889254 |
|
Kraus S, 2020 |
10.1016/j.techfore.2020.120262 |
283 |
70.75 |
7.27935048 |
|
ABBAS J, 2019 |
10.1016/j.jclepro.2019.05.024 |
238 |
47.6 |
4.37988827 |
|
Zhang D, 2019 |
10.1016/j.resconrec.2019.01.023 |
237 |
47.4 |
4.36148538 |
|
Yu CH, 2021 |
10.1016/j.enpol.2021.112255 |
229 |
76.3333333 |
8.15079864 |
|
Abu Seman NA, 2019 |
10.1016/j.jclepro.2019.03.211 |
207 |
41.4 |
3.80939862 |
|
Xu L, 2021 |
10.1016/j.eneco.2021.105269 |
200 |
66.6666667 |
7.11860143 |
|
Lv C, 2021 |
10.1016/j.eneco.2021.105237 |
198 |
66 |
7.04741542 |
|
Bai Y, 2019 |
10.1016/j.jclepro.2019.06.107 |
194 |
38.8 |
3.57016103 |
|
Huang Z, 2019 |
10.1016/j.techfore.2019.04.023 |
191 |
38.2 |
3.51495235 |
|
Song M, 2019 |
10.1016/j.techfore.2018.07.055 |
182 |
36.4 |
3.34932632 |
|
Hu G, 2021 |
10.1016/j.eneco.2021.105134 |
180 |
60 |
6.40674129 |
|
Luo Y, 2021 |
10.1016/j.scitotenv.2020.143744 |
173 |
57.6666667 |
6.15759024 |
|
Rehman SU, 2021 |
10.1016/j.techfore.2020.120481 |
168 |
56 |
5.9796252 |
|
Aboelmaged M, 2019 |
10.1016/j.jclepro.2019.02.150 |
168 |
33.6 |
3.09168584 |
|
Tang K, 2020 |
10.1016/j.scitotenv.2019.136362 |
167 |
41.75 |
4.29558845 |
|
Shahzad M, 2020 |
10.1016/j.jclepro.2019.119938 |
163 |
40.75 |
4.1927001 |
Note: TC=Total citations
Table 6. Top local cited documents on green innovation
|
Document |
DOI |
Year |
LC |
GC |
Ratio |
Normalized LC |
Normalized GC |
|
Singh SK, 2020 |
10.1016/j.techfore.2019.119762 |
2020 |
170 |
539 |
31.5398887 |
16.1689692 |
13.8642046 |
|
El-Kassar AN, 2019 |
10.1016/j.techfore.2017.12.016 |
2019 |
125 |
431 |
29.0023202 |
8.37821664 |
7.9316464 |
|
Zhang D, 2019 |
10.1016/j.resconrec.2019.01.023 |
2019 |
120 |
237 |
50.6329114 |
8.04308797 |
4.36148538 |
|
Yu CH, 2021 |
10.1016/j.enpol.2021.112255 |
2021 |
89 |
229 |
38.8646288 |
10.4858451 |
8.15079864 |
|
Kraus S, 2020 |
10.1016/j.techfore.2020.120262 |
2020 |
89 |
283 |
31.4487633 |
8.46493092 |
7.27935048 |
|
Abbas J, 2019 |
10.1016/j.jclepro.2019.05.024 |
2019 |
79 |
238 |
33.1932773 |
5.29503291 |
4.37988827 |
|
Hu G, 2021 |
10.1016/j.eneco.2021.105134 |
2021 |
73 |
180 |
40.5555556 |
8.60074938 |
6.40674129 |
|
Sun H, 2019 |
10.1016/j.enpol.2019.111002 |
2019 |
73 |
320 |
22.8125 |
4.89287852 |
5.8889254 |
|
Luo Y, 2021 |
10.1016/j.scitotenv.2020.143744 |
2021 |
72 |
173 |
41.6184971 |
8.48293089 |
6.15759024 |
|
Huang Z, 2019 |
10.1016/j.techfore.2019.04.023 |
2019 |
71 |
191 |
37.1727749 |
4.75882705 |
3.51495235 |
|
Abu Seman NA, 2019 |
10.1016/j.jclepro.2019.03.211 |
2019 |
69 |
207 |
33.3333333 |
4.62477558 |
3.80939862 |
|
Zhang J, 2020 |
10.1016/j.scs.2020.102123 |
2020 |
67 |
139 |
48.2014388 |
6.37247609 |
3.57537002 |
|
Tang K, 2020 |
10.1016/j.scitotenv.2019.136362 |
2020 |
67 |
167 |
40.1197605 |
6.37247609 |
4.29558845 |
|
Bai Y, 2019 |
10.1016/j.jclepro.2019.06.107 |
2019 |
67 |
194 |
34.5360825 |
4.49072412 |
3.57016103 |
|
XU L, 2021 |
10.1016/j.eneco.2021.105269 |
2021 |
64 |
200 |
32 |
7.54038301 |
7.11860143 |
|
Rehman SU, 2021 |
10.1016/j.techfore.2020.120481 |
2021 |
63 |
168 |
37.5 |
7.42256453 |
5.9796252 |
|
Zhang F, 2019 |
10.1002/bse.2298 |
2019 |
60 |
144 |
41.6666667 |
4.02154399 |
2.65001643 |
|
Aboelmaged M, 2019 |
10.1016/j.jclepro.2019.02.150 |
2019 |
58 |
168 |
34.5238095 |
3.88749252 |
3.09168584 |
|
Asadi S, 2020 |
10.1016/j.jclepro.2020.120860 |
2020 |
56 |
152 |
36.8421053 |
5.32624867 |
3.90975715 |
|
Fan F, 2021 |
10.1016/j.jclepro.2020.125060 |
2021 |
54 |
153 |
35.2941176 |
6.36219817 |
5.4457301 |
Note: LC=Local Citations; GC = Global Citations
4.7 The most relevant words in green innovation research
Analyzing the most frequently used words in green innovation research can provide insight into scholars' and practitioners' key focus areas, methods, and concerns. Table 7 shows the geographical prominence of "China" with 944 occurrences, signifying that the country is the leading hub for green innovation research. This is hardly surprising given China's status as the world's largest emitter of greenhouse gases and its simultaneous efforts in leading green technology innovations. The emphasis on China indicates that research might explore its unique challenges, strategies, leadership, and execution of green innovation. "Innovation" and "sustainable development" concepts are at the heart of the research, with 627 and 397 occurrences, respectively.
Table 7. The most relevant words in green innovation research
|
S/No. |
Words |
Occurrences |
|
1 |
China |
944 |
|
2 |
Innovation |
627 |
|
3 |
Sustainable Development |
397 |
|
4 |
Green Innovations |
394 |
|
5 |
Economic Development |
325 |
|
6 |
Green Economy |
228 |
|
7 |
Environmental Policy |
177 |
|
8 |
Article |
171 |
|
9 |
Environmental Protection |
170 |
|
10 |
Carbon |
169 |
|
11 |
Environmental Economics |
166 |
|
12 |
Government |
135 |
|
13 |
Carbon Dioxide |
126 |
|
14 |
Human |
124 |
|
15 |
Industry |
124 |
|
16 |
Sustainability |
122 |
|
17 |
Carbon Emission |
113 |
|
18 |
Environmental Management |
112 |
|
19 |
Panel Data |
110 |
|
20 |
Investments |
106 |
"Green Innovations" and "Economic Development" further emphasize this intertwining of sustainability with innovative practices. The recurrence of these terms highlights the importance of innovative approaches in achieving economic growth without compromising ecological balance. The terms "Green Economy" and "Environmental Economics," along with "Investments," underscore the economic lens through which green innovations are often viewed. The research emphasizes that transitioning to a green economy is an environmental imperative and a lucrative economic opportunity for organizations.
Also, the frequent occurrence of terms related to policy and governance indicates the significant role governments play in facilitating or hindering green innovations. Research focuses on governmental policies, their efficacy, and the broader implications of regulatory frameworks. Carbon-related terms emphasize the concern over greenhouse gas emissions, global warming, and the associated environmental implications. The focus on carbon showcases the urgency to innovate to reduce our carbon footprint. The appearance of "Article" might suggest a meta-analytic approach, where researchers review and analyze previously published articles. The mention of "Panel Data" indicates the methodological preference for longitudinal data in examining trends, impacts, or patterns over time. Terms like "Human" and "Industry" provide insight into the multidimensional nature of green innovation research, suggesting that the discourse is not solely about technology or policies but also encompasses human behavior, industrial practices, and their broader implications for humans and the environment.
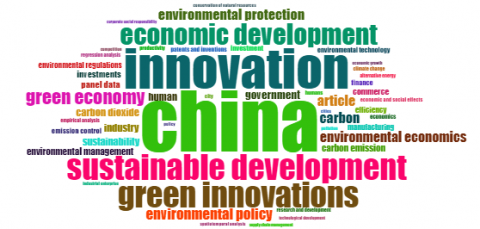
The word cloud in Figure 3 is a visualization of the words that appeared most often in the articles on green innovation. The word that appeared most frequently was "China," the next most prevalent word was "innovation," and the third most prevalent word was "sustainable development." The placement of words is somewhat random, but the most prevalent words are placed in the middle; they appear more prominent compared to other less-used words.
Figure 3. Word cloud green innovation research
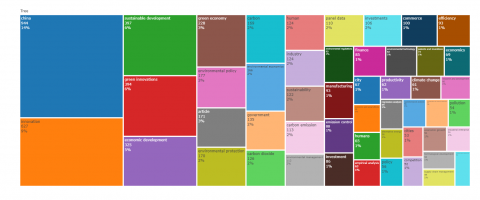
Figure 4. Tree map for green innovation research
The treemap of the top 20 index keywords used in green innovation research is shown in Figure 4. The green innovation index keyword "China" is used 944 times, with a 14% contribution in the top 20 index keywords. "Innovation" is used 627 times, contributing 9% of the index keywords. The keywords "sustainable development" are used 397 times and "green innovation" 394 times, both contributing 6%. "Economic Development" is used 325 times, contributing 5% of the index keywords. The index keywords "green economy," "environmental policy," "article," "environmental economics," "carbon," and "environmental protection" are utilized more than 150 times and have 2% or more contribution in the top 20 index keywords.
4.8 Trend topics in green innovation research
Green innovation research has evolved over the years and is encapsulated in Figure 5, revealing the dynamic shifts in thematic emphasis. Geographically, the early research concentration focused on Germany around 2019, extending only until 2020. In contrast, Japan saw concentrated attention in the year 2019 alone. The United States presented a broader span of interest, starting in 2019 and peaking around 2020, continuing its momentum into 2023. China dominates the research arena mainly between 2022 and 2023, reflecting its prominent significance in recent discussions about green innovation. A newly emerging focus in 2023 centers on "Asian People," hinting at research emphasis on demographic or cultural considerations in green innovation within the Asian context. In environmental and industry-specific terms, "River" became primarily prominent around 2020, extending its relevance to 2022. This might indicate a period-specific research interest in environmental conservation, especially related to water bodies. On the other hand, the focus on the "Industrial Structure" emerged mainly between 2022 and 2023. This highlights recent considerations regarding the formation and dynamics of industries in the green innovation context.
Economic and strategic dimensions also saw their periods of heightened focus. Themes like "Competitiveness" and "Competition" were at the forefront mainly between 2020 and 2022, indicating a heightened interest in understanding the competitive dynamics in green markets. Simultaneously, the emphasis on "Supply Chain Management" between 2020 and 2022 suggests a burgeoning interest in the green value chain and sustainable logistics. The "Decision Making" theme also garnered attention during the same period, pointing towards a curiosity about organizational and policy-level decisions within the green innovation context. Two foundational themes in green research, "Innovation" and "Sustainable Development," experienced significant attention between 2021 and 2023. Their sustained focus underscores their core importance in green innovation discussions. Moreover, the emergence of "Human Capital" as a theme between 2022 and 2023 signals the growing endeavors to understand the role of human resources, skills, and capacities in driving green innovation.
4.9 Coupling map
Clusters by document coupling can provide insights into groups of documents that are related based on shared references. Analyzing such clusters allows researchers to discern patterns and trends within a specific field [94]. Given the data on Figure 6 and Table 8, we can discuss the document coupling clusters in the context of green innovation research using two clusters. Cluster 1 is dominated by articles that often discuss "China," with a confidence of 85.1%. "Innovation" and "Green Innovations" also play a significant role in this cluster, with confidence levels of 61.1% and 62.7%, respectively. The prominence of "China" suggests that this cluster might focus on green innovation efforts, policies, and developments within the Chinese context. The prevalent themes in cluster 2 are "Innovation" and "Green Innovations,” they appear with slightly lower confidence levels of 38.9% and 37.3%, respectively. Interestingly, "China" also appears in this cluster but with a lower confidence level of 14.9%. This cluster may represent more general discussions on green innovation globally or in contexts other than China. Cluster 1 has 140 documents, making it slightly larger than Cluster 2, which contains 110 documents.
This indicates that discussions around China's role and perspective on green innovation might be slightly more prevalent in the dataset. Centrality measures the importance of nodes within a network [107, 108]. Cluster 2 has a higher centrality score, suggesting that documents within this cluster might be more central or influential within the entire network of analyzed documents. Cluster 1 has an impact score of 3.04, higher than Cluster 2's score of 2.46. This suggests that the documents in Cluster 1 might be more impactful or influential regarding cited references than those in Cluster 2. The coupling network of documents using the cited references is presented in Figure 7.
Figure 5. Trend topics in green innovation research
Table 8. Cluster by document coupling
|
Label |
Group |
Frequency |
Centrality |
Impact |
|
China-Conf 85.1% Innovation-Conf 61.1% Green Innovations-Conf 62.7% |
1 |
140 |
0.36178092 |
3.03584875 |
|
Innovation-Conf 38.9% Green Innovations-Conf 37.3% China-Conf 14.9% |
2 |
110 |
0.44864247 |
2.45731583 |
Figure 6. Clusters by document coupling in green innovation research
Figure 7. Coupling network of documents in green innovation research using cited references
4.10 Co-word network (CoWordNet) analysis of green innovation research
A co-word network visualizes the relationships and co-occurrences between key terms or nodes within a dataset [109]. Tables 9, 10 and Figure 8 provide a co-word network for green innovation research, revealing significant insights. The data in Table 9 representing Cluster 1 reveals that "Innovation" is central to green innovation research. It possesses the highest betweenness, closeness, and PageRank metrics, indicating its generic importance and central role in the network. "Sustainable Development" and "Green Innovations" follow closely, with considerable betweenness and PageRank values, signifying that they, too, are fundamental concepts within this domain. "Green Economy" and "Environmental Economics" highlight the economic dimensions of the research field, emphasizing the intertwined relationship between economic practices and sustainability. Betweenness measures the shortest paths that pass through a node. Higher betweenness indicates that a node is a bridge or connector within the network [110]. Thus, the high betweenness of "Innovation" signifies its role in connecting various themes in the network. Closeness indicates how close a node is to all other nodes in the network. A higher closeness value denotes that the term is closely related to many other terms [111].
In identified dataset, terms like "Innovation" and "Sustainable Development" have high closeness values, suggesting broad applicability within the domain. Google originally developed PageRank to rank web pages in the context of a co-word network; it indicates the importance of nodes based on their relationships [112, 113]. Nodes like "Innovation" and "Sustainable Development" possess high PageRank values, reinforcing their significance in the green innovation research landscape. Representations like Carbon, Carbon Dioxide, and Carbon Emission emphasize carbon-related themes in green innovation research. Their presence underscores the global concern regarding carbon emissions and their environmental implications. Environmental Management, Environmental Regulations, and Environmental Technology spotlight the tools, technologies, and regulations addressing environmental concerns within the domain. Words like Commerce, Finance, Manufacturing, and Investments underscore the economic and business elements intertwined with green innovation, reflecting the need for economic viability in sustainable practices. The mention of Patents and Inventions suggests a research interest in the legal and proprietary aspects of green innovations.
The CoWordNet for Cluster 2, as provided in Table 10, shows the interconnected topics and themes in green innovation research that fall under this cluster. China stands out prominently with the highest betweenness, closeness, and PageRank metrics. This denotes China's central role in green innovation research, likely due to its significant industrial base, rapid economic development, and increasing environmental concerns. The mention of Economic Development with a considerable betweenness and PageRank suggests that green innovation is often discussed in tandem with economic progress, especially in the context of China. The country's quest for sustainable growth without compromising its economic aspirations is likely a focus topic.
Table 9. CoWordNet of terms in Cluster 1
|
Node |
Cluster |
Betweenness |
Closeness |
PageRank |
|
Innovation |
1 |
139.916678 |
0.02083333 |
0.08922095 |
|
Sustainable Development |
1 |
37.0002218 |
0.02040816 |
0.04501675 |
|
Green Innovations |
1 |
41.9893783 |
0.01818182 |
0.04478292 |
|
Green Economy |
1 |
20.1813816 |
0.02040816 |
0.03832705 |
|
Carbon |
1 |
7.36061509 |
0.01785714 |
0.02411167 |
|
Environmental Economics |
1 |
14.6828674 |
0.02040816 |
0.03402705 |
|
Carbon Dioxide |
1 |
1.37228191 |
0.01492537 |
0.01571034 |
|
Sustainability |
1 |
1.62636043 |
0.01515152 |
0.01744699 |
|
Carbon Emission |
1 |
2.15346784 |
0.015625 |
0.02055947 |
|
Environmental Management |
1 |
1.41695854 |
0.01470588 |
0.01407992 |
|
Investments |
1 |
4.88096626 |
0.01724138 |
0.01992382 |
|
Commerce |
1 |
2.08776117 |
0.01515152 |
0.01624082 |
|
Environmental Regulations |
1 |
1.43857421 |
0.01428571 |
0.01450571 |
|
Manufacturing |
1 |
0.26028441 |
0.01282051 |
0.01290758 |
|
Emission Control |
1 |
1.12215927 |
0.01449275 |
0.01533949 |
|
Finance |
1 |
0.45497377 |
0.01428571 |
0.01275998 |
|
Environmental Technology |
1 |
0.58417295 |
0.01369863 |
0.01279235 |
|
Patents and Inventions |
1 |
0.37025154 |
0.01298701 |
0.01065497 |
|
Economics |
1 |
0.71461837 |
0.01369863 |
0.0117488 |
|
Economic and Social Effects |
1 |
0.1555873 |
0.01265823 |
0.00985694 |
|
Empirical Analysis |
1 |
0.2404065 |
0.01408451 |
0.01149923 |
|
Climate Change |
1 |
0.13325961 |
0.01282051 |
0.0085282 |
|
Research and Development |
1 |
0.17914699 |
0.01315789 |
0.00912772 |
|
Regression Analysis |
1 |
0.02665313 |
0.01219512 |
0.00758057 |
|
Alternative Energy |
1 |
0.13822784 |
0.01315789 |
0.01048409 |
|
Competition |
1 |
0 |
0.01176471 |
0.0066051 |
|
Economic Growth |
1 |
0.20882552 |
0.01282051 |
0.00966275 |
|
Technological Development |
1 |
0.04257302 |
0.0125 |
0.00797169 |
|
Supply Chain Management |
1 |
0.00247343 |
0.01190476 |
0.00633043 |
Table 10. CoWordNet of terms in Cluster 2
|
Node |
Cluster |
Betweenness |
Closeness |
PageRank |
|
China |
2 |
121.483261 |
0.02083333 |
0.084979 |
|
Economic Development |
2 |
18.4180166 |
0.01923077 |
0.03843784 |
|
Environmental Policy |
2 |
6.31313846 |
0.01754386 |
0.02580544 |
|
Article |
2 |
17.3966301 |
0.01923077 |
0.03805949 |
|
Environmental Protection |
2 |
10.0949554 |
0.01886792 |
0.02908581 |
|
Government |
2 |
2.66811143 |
0.01612903 |
0.01997854 |
|
Human |
2 |
4.81944959 |
0.01612903 |
0.02639995 |
|
Industry |
2 |
0.91176254 |
0.01538462 |
0.0153088 |
|
Panel Data |
2 |
2.70718728 |
0.01694915 |
0.01931652 |
|
Efficiency |
2 |
3.62058875 |
0.01612903 |
0.01898646 |
|
Investment |
2 |
0.38164429 |
0.01449275 |
0.01355096 |
|
City |
2 |
0.86471225 |
0.01449275 |
0.01679188 |
|
Humans |
2 |
0.90511383 |
0.01492537 |
0.01536495 |
|
Productivity |
2 |
0.40241379 |
0.01408451 |
0.01434533 |
|
Policy |
2 |
0.04599331 |
0.01204819 |
0.00691923 |
|
Spatiotemporal Analysis |
2 |
0.01432499 |
0.01282051 |
0.00978124 |
|
Conservation of Natural Resources |
2 |
0.33717775 |
0.01428571 |
0.01448053 |
|
Pollution |
2 |
0.11583325 |
0.01315789 |
0.01007583 |
|
Cities |
2 |
0.60405774 |
0.01408451 |
0.01554416 |
|
Industrial Enterprise |
2 |
0.15450164 |
0.01282051 |
0.00898469 |
Figure 8. CoWordNet showing Clusters 1 and 2
Investment and Efficiency point to the economic considerations and challenges encountered in green innovation. It hints at the study of resource allocation for sustainable projects and their cost-benefit analysis. Environmental Policy and Government indicate the regulatory and governance mechanisms explored in the context of green innovation. As countries strive for sustainable practices, the role of government policies and their impact on fostering green initiatives becomes crucial. Environmental Protection further emphasizes the legislative and administrative measures to balance development and the environment. With its prominence, the term Article suggests a meta-analytical dimension, where the research is about analyzing various articles or studies related to green innovation. Panel Data indicates the utilization of this statistical method to study longitudinal effects or compare different regions over time, making the research empirical and data-driven. Human and Humans highlight the human-centric approach in the research, focusing on behavioral, societal, or cultural aspects of adopting green innovations. Industry and Industrial Enterprise underscore the critical function of industries in driving green innovations. The study may explore optimal methodologies, obstacles, and empirical analyses related to enterprises undergoing a shift toward sustainable practices. City and Cities emphasize the urban perspective, highlighting research themes around urban planning, smart cities, and urban sustainability. Words like Pollution, Conservation of Natural Resources, and Spatiotemporal Analysis reflect a broader environmental focus, exploring topics ranging from pollution mitigation to conservation strategies. These are further elucidated on Figure 8 showing Clusters 1 and 2.
4.11 Thematic map
A thematic map was constructed using density and centrality as the basis, and it was further separated into four distinct topological sections (see Figure 9). The outcome above was derived using a semi-automatic technique that thoroughly examined the titles of all references examined in this study. Furthermore, relevant keywords beyond those provided by the author were considered to encompass a broader range of variants. The quadrant located in the upper right region of the map exhibits themes that serve as catalysts for debates related to green innovation. These topics are characterized by their high density and centrality. However, it is noteworthy that no specific topics were recorded in this particular quadrant. The quadrant in the upper left region of the diagram exhibits unique and under-represented subject matters now seeing significant advancements, as seen by their high density but low centrality. These subject matters comprise "green innovation," "sustainable development," and "investments."
The lower left quadrant contains themes that have been previously utilized but have demonstrated a diminishing pattern, as evidenced by their low centrality and density. Notably, no topics were observed in this quadrant's emerging or declining trends area. The lower right quadrant incorporates fundamental subjects that exhibit high centrality but low density. These topics hold significant value in the study as they pertain to broad subjects, including "innovation," "china," and "green economy."
Figure 9. Thematic map of green innovation research based on density and centrality
Figure 10. Thematic evolution of green innovation research
4.12 Thematic evolution
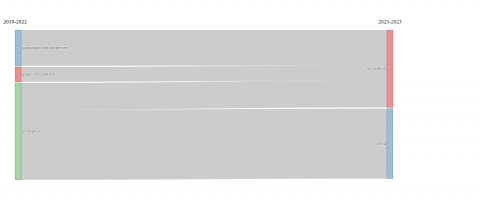
Table 11 and Figure 10 analyze word clusters based on various metrics, such as weighted incidence, incidence index, occurrence, and stability, drawn from the green innovation bibliometric research domain. It examines the relationship and overlap of different word clusters, underscoring key themes and terms that dominate the discourse of green innovation over specific periods as outlined by the research parameters (2019-2023). The weighted incidence (Inc_Weighted) and incidence index (Inc_index) metrics measure the importance or weightage of the words in each cluster, with higher values indicating greater significance [114, 115]. Similarly, occurrence (Occ) points to the frequency of the terms, and stability represent these themes' consistency or persistence over time [96]. Table 11 maps the evolution of green innovation research themes by comparing word clusters over different periods; the association between "green innovations" from 2019-2022 and "innovation" from 2023 highlights the continuance of the theme of green innovations into broader discussions about innovation by 2023.
Table 11. Thematic evolution
|
CL1 |
CL2 |
Words |
Inc_Weighted |
Inc_index |
Occ |
Stability |
|
Green innovations-2019-2022 |
Innovation-2023-2023 |
green innovations; economic and social effects; competition; costs; green products; profitability; environmental performance; corporates; innovation performance; knowledge management; technological innovation; environmental pollutions; global warming; human resource management; mediating roles; performance |
0.17817818 |
0.02439024 |
302 |
0.00561798 |
|
Innovation-2019-2022 |
China-2023-2023 |
China; economic development; article; environmental policy; environmental protection; government; human; manufacturing; panel data; industry; investment; productivity; conservation of natural resources; spatiotemporal analysis; industrial enterprise; pollution; city; humans; performance assessment; heterogeneity; invention; policy; theoretical study; organization; commercial phenomena; inventions; renewable energy; cities; technology; organizations; governance approach; social responsibility; corporate strategy; regulatory framework; economic aspect; leadership; local government; government regulation; manufacturing industry; emissions trading; urban area; financial management; regulatory approach; spillover effect; air pollution; Guangdong; empirical research; patent; spatial analysis; knowledge; policy implementation; agglomeration; controlled study; environmental pollution; incentive; motivation; business development; research work; competitiveness; employment; industrial development; developing country; econometrics; environmental legislation; human experiment; industrial structure; experimental study; greenhouse gas |
0.84025854 |
0.00925926 |
371 |
0.00423729 |
|
Innovation-2019-2022 |
Innovation-2023-2023 |
innovation; green economy; environmental economics; sustainability; carbon dioxide; efficiency; carbon emission; empirical analysis; research and development; technological development; numerical model; strategic approach; environmental impact; total factor productivity; technology adoption; energy use; environmental quality; foreign direct investment; urbanization; developing world; industrialization; policy approach; ownership; factor analysis; green innovation efficiency; gross domestic product |
0.32317073 |
0.00775194 |
465 |
0.0037594 |
|
Sustainable development-2019-2022 |
China-2023-2023 |
state owned enterprise; environment; pollution control; resource allocation; human capital; construction industry; COVID-19 |
0.03970452 |
0.01265823 |
22 |
0.00537634 |
|
Sustainable development-2019-2022 |
Innovation-2023-2023 |
sustainable development; carbon; environmental management; investments; environmental regulations; commerce; environmental technology; emission control; patents and inventions; finance; economics; supply chain management; regression analysis; alternative energy; decision making; green technology; climate change; corporate social responsibility; economic growth; energy efficiency; public policy; energy utilization; small and medium-sized enterprise; technology innovation; renewable energies; developing countries; difference-in-differences; economic analysis; recycling; energy policy; engineering research; environmental sustainability; natural resource; carbon emissions; innovation efficiency; natural experiment; economic growths; financial system; method of moments; differences-in-differences; india; united states; energy; quantile regression; spillover effects; brazil; difference-in-differences models; oecd |
0.42750678 |
0.01265823 |
235 |
0.00462963 |
Figure 11. Conceptual structure map of green innovation research
In the first cluster, the combined theme of "green innovations" and "economic and social effects" from 2019-2022 with "innovation" in 2023 emphasizes the socio-economic aspects of green innovations. Words like "profitability," "innovation performance," and "global warming" suggest a multi-pronged discourse incorporating profitability metrics, performance evaluations, and environmental concerns.
The second cluster predominantly maps "innovation" from 2019-2022, with "China" in 2023. Here, terms such as "environmental policy," "government," "manufacturing," and "pollution" indicate that the research on innovation in this period is heavily tilted towards China's economic development, regulatory frameworks, and industrial growth, combined with its environmental challenges. The third cluster pairs "innovation" from 2019-2022 with "innovation" in 2023. It re-emphasizes core concepts like "sustainability," "carbon dioxide," "carbon emission," and "empirical analysis." The recurrent theme of innovation, supplemented by a focus on carbon management and empirical research, can be observed. In the fourth and fifth clusters, "sustainable development" from 2019-2022 intersects with "China" and "innovation" in 2023, respectively. The intersection with China brings up topics like "state-owned enterprise," "environment," and "COVID-19," reflecting the challenges and strategies of sustainable development in the context of China. Meanwhile, its intersection with "innovation" touches upon themes of "carbon," "environmental management," "investments," and "supply chain management," showcasing the broader canvas of sustainable development linked to innovative strategies and practices.
4.13 Conceptual structure map
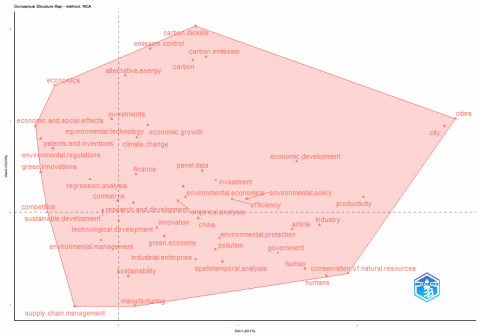
A conceptual structure map was developed to visually represent the contextual structure of frequently occurring words in research papers focused on the issue of green innovation. This map utilized regional mapping techniques to illustrate the relationships between different words (see Figure 11). The positioning of each word is determined by the values of Dim 1 and Dim 2, where Dim refers to the Diminutive particle, a specialized concept in bibliometric study. This process creates a map that associates words with similar values in Dim 1 and Dim 2, indicating minimal differences between them. The map is a quadrant of a primarily red subdivision: the red area contains words that are related to each other. As shown in Figure 11, the red area contained a high number and variety of words, demonstrating that that many research papers presented connections between the words listed in this region, which contained the themes that appeared most often (“China,” “innovation,” “investments,” etc.).
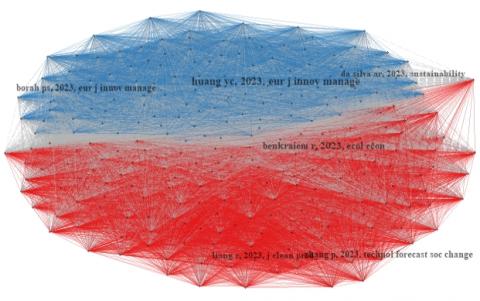
4.14 Co-citation network
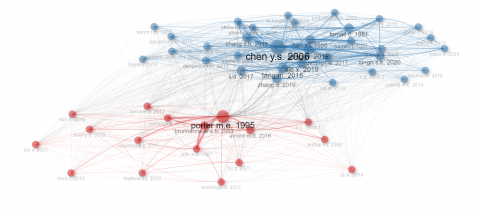
Table 12 and Figure 12 present a cocitation network associated with green innovation research. Cocitation networks are formed by analyzing how frequently two documents (or authors) are cited in other works. This method allows for the detection of influential articles, authors, or journals within a particular field, helping to identify significant trends or paradigms [116, 117]. Table 12 segregates the nodes (often representing authors or key works) into two primary clusters, signifying two dominant thematic areas (clusters) within green innovation research. Cluster 1 is predominantly led by works such as "Porter M.E. 1995", "Brunnermeier S.B. 2003", and "Amore M.D. 2016", showcasing their centrality and influence. The wide range of betweenness values in this cluster, from a high of 223.6 for "Porter M.E. 1995" to a low of 0.52 for "Acemoglu D. 2012", indicates varying degrees of connectivity among the nodes, with some works acting as key bridges or connectors in the citation network. Cluster 2 paints a slightly different thematic picture, with "Chen Y.S. 2006" and "Xie X. 2019" emerging as notable nodes. Here, the discussion topics may slightly differ, leaning more towards specialized areas of green innovation, given the mention of more recent years in the cited works. From the values, it is evident that nodes like "Porter M.E. 1995" in Cluster 1 and "Chen Y.S. 2006" in Cluster 2 (Figure 13) exhibit a considerable influence in the cocitation network due to their high centrality metrics.
Figure 12. Cocitation network map of green innovation research
Table 12. Cocitation network for green innovation
|
Node |
Cluster |
Betweenness |
Closeness |
Pagerank |
|
Porter M.E. 1995 |
1 |
223.61254 |
0.01538462 |
0.03164801 |
|
Brunnermeier S.B. 2003 |
1 |
71.7008565 |
0.01492537 |
0.0219035 |
|
Amore M.D. 2016 |
1 |
66.8994103 |
0.01408451 |
0.02090056 |
|
Jaffe A.B. 1997 |
1 |
8.89911134 |
0.01176471 |
0.01881627 |
|
Rennings K. 2000 |
1 |
58.1863348 |
0.01538462 |
0.01689026 |
|
Berrone P. 2013 |
1 |
72.3962696 |
0.01492537 |
0.01537502 |
|
Rubashkina Y. 2015 |
1 |
19.4714847 |
0.01298701 |
0.01488586 |
|
Li D. 2018-1 |
1 |
64.8713684 |
0.01492537 |
0.01557166 |
|
Acemoglu D. 2012 |
1 |
0.52792304 |
0.00900901 |
0.01093843 |
|
Hu G. 2021 |
1 |
5.02617104 |
0.01098901 |
0.01319775 |
|
Luo Y. 2021 |
1 |
5.6143967 |
0.01052632 |
0.009792 |
|
Huang Z. 2019 |
1 |
18.4494834 |
0.01265823 |
0.01251479 |
|
Sun H. 2019 |
1 |
28.7263474 |
0.01408451 |
0.01195476 |
|
Du K. 2019 |
1 |
4.89179393 |
0.01052632 |
0.00713077 |
|
Beck T. 2010 |
1 |
0.62248454 |
0.00869565 |
0.01019263 |
|
Hadlock C.J. 2010 |
1 |
1.94619074 |
0.00952381 |
0.01118173 |
|
Horbach J. 2008 |
1 |
24.1578339 |
0.01333333 |
0.01249974 |
|
Chen Y.S. 2006 |
2 |
26.0060322 |
0.01204819 |
0.04514786 |
|
Xie X. 2019 |
2 |
17.0948566 |
0.01176471 |
0.03083223 |
|
Song W. 2018 |
2 |
11.4219097 |
0.01176471 |
0.03187619 |
|
Fornell C. 1981 |
2 |
0.88434392 |
0.01030928 |
0.02901624 |
|
Hart S.L. 1995 |
2 |
9.81078107 |
0.01176471 |
0.02670626 |
|
Singh S.K. 2020 |
2 |
8.74437948 |
0.01149425 |
0.02811289 |
|
Li D. 2017 |
2 |
33.3525302 |
0.01204819 |
0.02597244 |
|
Tang M. 2018 |
2 |
23.7676279 |
0.01176471 |
0.03250438 |
|
Zhang D. 2019 |
2 |
37.0178976 |
0.01234568 |
0.02557004 |
|
Chen Y.-S. 2006 |
2 |
5.88860605 |
0.01123596 |
0.02096802 |
|
Chang C.H. 2011 |
2 |
5.73274269 |
0.01123596 |
0.02806991 |
|
Huang J.W. 2017 |
2 |
7.44922476 |
0.01123596 |
0.02650614 |
|
Barney J. 1991 |
2 |
5.9073815 |
0.01176471 |
0.02426854 |
|
Eiadat Y. 2008 |
2 |
11.5096064 |
0.01149425 |
0.0219079 |
|
De Marchi V. 2012 |
2 |
4.56633314 |
0.01098901 |
0.01765031 |
|
Albort-Morant G. 2016 |
2 |
3.75557032 |
0.01123596 |
0.0233914 |
|
Chiou T.Y. 2011 |
2 |
1.03234467 |
0.01052632 |
0.02524133 |
|
Dangelico R.M. 2010 |
2 |
6.07665729 |
0.01098901 |
0.02392554 |
|
El-Kassar A.N. 2019 |
2 |
2.48740031 |
0.01075269 |
0.02068321 |
|
Henseler J. 2015 |
2 |
0.13658148 |
0.00970874 |
0.02187593 |
|
Aguilera-Caracuel J. 2013 |
2 |
5.25320903 |
0.01123596 |
0.01973878 |
|
Cai W. 2018 |
2 |
12.2758696 |
0.01149425 |
0.01787379 |
|
Kraus S. 2020 |
2 |
4.24402339 |
0.01075269 |
0.01828351 |
|
Podsakoff P.M. 2003 |
2 |
0.16067779 |
0.00970874 |
0.01982055 |
|
Abbas J. 2019 |
2 |
0.87273672 |
0.01030928 |
0.01757605 |
|
Baron R.M. 1986 |
2 |
7.28597789 |
0.01075269 |
0.01379287 |
|
Saunila M. 2018 |
2 |
11.9019468 |
0.01204819 |
0.01490662 |
|
Hojnik J. 2016 |
2 |
3.05742941 |
0.01123596 |
0.01339308 |
|
Dangelico R.M. 2016 |
2 |
3.33576084 |
0.01098901 |
0.01686286 |
|
Zhang F. 2019 |
2 |
3.05047597 |
0.01098901 |
0.01486187 |
|
Aboelmaged M. 2019 |
2 |
0.68302106 |
0.01010101 |
0.01586125 |
|
Cuerva M.C. 2014 |
2 |
5.53157475 |
0.01098901 |
0.01503428 |
|
Li D. 2018-2 |
2 |
3.70448946 |
0.01098901 |
0.01637397 |
Figure 13. Author CollabNet map of green innovation research
Table 13. Author CollabNet of green innovation research
|
Node |
Cluster |
Betweenness |
Closeness |
Pagerank |
|
Wang C |
1 |
8.01774662 |
0.00934579 |
0.01165475 |
|
Chang Cp |
1 |
1.02463427 |
0.00775194 |
0.00756799 |
|
Zhao X |
1 |
21.9142699 |
0.00990099 |
0.01487986 |
|
Li L |
1 |
4.03665846 |
0.00900901 |
0.01142647 |
|
Wang J |
2 |
16.8441456 |
0.01075269 |
0.02020741 |
|
Zhang Z |
2 |
12.6755248 |
0.01086957 |
0.02087006 |
|
Chen L |
2 |
11.3726696 |
0.01030928 |
0.01393118 |
|
Wang S |
2 |
6.01309355 |
0.01020408 |
0.01439528 |
|
Li H |
2 |
6.41222087 |
0.01 |
0.01718437 |
|
Wang W |
2 |
16.8563623 |
0.01098901 |
0.0189126 |
|
Li C |
2 |
12.6202164 |
0.00980392 |
0.01248277 |
|
Zhou Y |
2 |
0.70601422 |
0.00854701 |
0.00704495 |
|
Sun X |
2 |
9.87721417 |
0.01075269 |
0.01732722 |
|
Sun Z |
2 |
17.4007672 |
0.01030928 |
0.020759 |
|
Sun Y |
3 |
14.7344303 |
0.01030928 |
0.01761378 |
|
Chen J |
3 |
4.24386096 |
0.00980392 |
0.01246284 |
|
Xu J |
3 |
5.10339935 |
0.00925926 |
0.01191688 |
|
Yin S |
3 |
0 |
0.00840336 |
0.00887655 |
|
Li X |
4 |
29.2788189 |
0.01136364 |
0.03338489 |
|
Wang L |
4 |
56.2789005 |
0.01204819 |
0.02979443 |
|
Li J |
4 |
47.612568 |
0.01176471 |
0.03192358 |
|
Liu X |
4 |
34.4798238 |
0.01086957 |
0.02991558 |
|
Zhang X |
4 |
26.9131376 |
0.01098901 |
0.02525285 |
|
Wang H |
4 |
39.6395911 |
0.01086957 |
0.02200328 |
|
Li W |
4 |
23.8543605 |
0.0106383 |
0.01815289 |
|
Wang F |
4 |
3.47060008 |
0.01020408 |
0.01317683 |
|
He J |
4 |
7.90469261 |
0.01052632 |
0.01800814 |
|
Wang Y |
5 |
142.725905 |
0.01298701 |
0.04916413 |
|
Li Y |
5 |
54.2278989 |
0.01234568 |
0.03277556 |
|
Zhang Y |
5 |
103.65273 |
0.01234568 |
0.04261559 |
|
Wang X |
5 |
60.7507043 |
0.01204819 |
0.03434528 |
|
Zhang J |
5 |
64.2661541 |
0.01234568 |
0.03438012 |
|
Liu Y |
5 |
43.8492241 |
0.01162791 |
0.03281905 |
|
Liu S |
5 |
58.5543768 |
0.01204819 |
0.03357227 |
|
Chen X |
5 |
9.91768167 |
0.01041667 |
0.01838218 |
|
Xu Y |
5 |
8.37406127 |
0.01111111 |
0.01711238 |
|
Yang Y |
5 |
11.4127651 |
0.01086957 |
0.01965314 |
|
Chen Z |
5 |
10.6764206 |
0.01098901 |
0.01737186 |
|
Zhang L |
5 |
4.99699929 |
0.00943396 |
0.01119099 |
|
Wu H |
5 |
20.122913 |
0.01041667 |
0.01612218 |
|
Zhao Y |
5 |
3.19703833 |
0.0106383 |
0.01553171 |
|
Liu L |
5 |
33.1932919 |
0.01162791 |
0.02180455 |
|
Chen H |
5 |
21.7700923 |
0.01041667 |
0.01954481 |
|
Li M |
5 |
25.0331864 |
0.01176471 |
0.02134281 |
|
Li S |
5 |
10.5934175 |
0.0106383 |
0.01714878 |
|
Li G |
5 |
8.96728914 |
0.01052632 |
0.01591868 |
|
Zhang W |
5 |
9.48234808 |
0.01052632 |
0.01612499 |
|
Chen Y |
5 |
0 |
0.00900901 |
0.00671442 |
|
Liu J |
6 |
2.4532638 |
0.00793651 |
0.00896076 |
|
Zhang Q |
6 |
24.4965169 |
0.01030928 |
0.01627733 |
4.15 Author collaboration networks
Table 13 illustrates a collaboration network analysis, explicitly highlighting the interactions among authors of green innovation research nodes. Collaboration networks are integral in understanding the synergy between various entities, allowing us to discern patterns of joint efforts, pivotal figures, or institutions in a research area [118, 119]. The nodes are divided into six clusters, each pointing towards a potential collaborative group or a thematic area within the broader field of green innovation. Cluster 1 primarily features nodes like "Wang C," "Chang CP," and "Zhao X." This cluster represents a set of researchers who have extensively worked together or whose works have thematically aligned in the past. Clusters 2 through 6 similarly suggest other collaborative groups. For instance, "Wang J" and "Zhang Z" are prominent nodes in Cluster 2, while Cluster 5 appears to be the most extensive, with "Yang Y" and "Zhang Y" as influential figures. Three key metrics (Betweenness, Closeness, and PageRank) were used to distinguish the significance of each node within the network. "Wang Y" from Cluster 5 possesses the highest PageRank, signifying its influential status in the collaboration network.
Meanwhile, nodes like "Wang C" and "Zhao X" in Cluster 1 have substantial betweenness values, implying their crucial role in connecting various nodes within their cluster. The data suggests that some researchers are central in bridging collaborations. Due to its high PageRank, "Wang Y" appears to dominate Cluster 5 (See Figure 14) and potentially in the broader research discipline. Some clusters have more nodes, indicating extensive collaborative endeavors within those groups (Zhang Y, Zhang J, Wang X). This could indicate significant research teams or institutions where collaborative efforts are paramount. While multiple clusters indicate diverse collaborative groups, it also might hint at silos in collaborations. Some researchers might predominantly collaborate within their clusters, leading to potential research echo chambers. Analyzing changes in the collaboration network over time could reveal emerging collaborations, new influential figures, and shifts in research themes.
4.16 Institutional collaboration networks
Table 14 demonstrates the complexities of institutional collaboration networks. Such networks illuminate how institutions collaborate or correspond in their research outputs, suggesting potential hotbeds of academic synergy, leading institutions, and critical areas of research interest. The institutions are grouped into 14 clusters, each representing a unique collaborative group or research theme. Cluster 1 features "Zhejiang Gongshang University" and "Zhejiang University," suggesting these institutions may collaborate closely due to their geographic proximity or similar research interests. Clusters such as 2 and 5 indicate regions or thematic areas where collaboration is extensive, with multiple institutions contributing actively. Using the table metrics, it is clear that some universities hold a more central role within the network. Higher betweenness suggests that the institution connects many other institutions within the network, acting as a hub or bridge. "Jiangsu University" and "Renmin University of China" (see Figure 14) have notably high betweenness values, making them potentially critical connectors in the network. Higher closeness values, like those of "Jiangsu University" or "Xiamen University," denote that these institutions can rapidly exchange or assimilate research information with their counterparts.
Institutions like "Jiangsu University" and "Illma University" possess dominant PageRank values, implying they are likely significant contributors or influencers in their respective clusters. Some universities, like "Jiangsu University" and "Ilma University," serve as vital collaborative hubs in the network. Their strategic position can be attributed to their extensive research, collaborations, or a combination of these factors. Clusters can highlight emerging themes or areas of research. For instance, if all institutions within a cluster publish extensively on a niche topic, it suggests a focused collaborative effort. Some clusters may hint at regional collaborations, especially if the universities are geographically close, suggesting that geographical proximity shapes collaborations. Understanding the current collaboration landscape can help institutions identify potential collaborators, aligning their research strengths to address more complex or multidisciplinary challenges.
Table 14. Institutional CollabNet of green innovation research
|
Node |
Cluster |
Betweenness |
Closeness |
PageRank |
|
Zhejiang Gongshang University |
1 |
6.14311039 |
0.00769231 |
0.0137399 |
|
Zhejiang University |
1 |
5.99213191 |
0.00775194 |
0.0140724 |
|
Jiangsu University |
2 |
114.370649 |
0.01204819 |
0.04730948 |
|
Southwestern University of Finance and Economics |
2 |
29.0521958 |
0.01041667 |
0.02200284 |
|
Shandong University of Finance and Economics |
2 |
36.7039873 |
0.01020408 |
0.02252148 |
|
Xiamen University |
2 |
73.2858555 |
0.01098901 |
0.02476337 |
|
Nanjing University of Information Science and Technology |
2 |
18.29616 |
0.00952381 |
0.01787622 |
|
Ocean University of China |
2 |
48.9215263 |
0.01123596 |
0.03043296 |
|
Nanjing University of Finance and Economics |
2 |
25.682652 |
0.01020408 |
0.02231507 |
|
Dongbei University of Finance and Economics |
2 |
19.7533565 |
0.00990099 |
0.01710089 |
|
Nanjing University of Aeronautics and Astronautics |
2 |
3.94748753 |
0.00952381 |
0.01548032 |
|
Qingdao University |
2 |
25.9971634 |
0.00934579 |
0.01300242 |
|
Southeast University |
2 |
25.5419555 |
0.01041667 |
0.020767 |
|
Nanjing Agricultural University |
2 |
13.7636677 |
0.00990099 |
0.02057163 |
|
Shandong University of Technology |
2 |
14.0231361 |
0.00980392 |
0.01720546 |
|
Guangdong University of Foreign Studies |
3 |
2.91264558 |
0.0075188 |
0.00894575 |
|
School of Economics and Management |
3 |
13.9573192 |
0.00787402 |
0.01225319 |
|
China University Of Geosciences |
4 |
3.53542577 |
0.00793651 |
0.00962161 |
|
Shanghai Jiao Tong University |
4 |
45.2643863 |
0.01030928 |
0.02254235 |
|
Nanjing Audit University |
4 |
42.4298066 |
0.00970874 |
0.02120423 |
|
Chongqing University |
5 |
42.4174458 |
0.00943396 |
0.0173561 |
|
Capital University Of Economics And Business |
5 |
11.09 |
0.00892857 |
0.01265201 |
|
Nanchang University |
5 |
20.4016207 |
0.00909091 |
0.01187424 |
|
Shandong University |
6 |
60.890565 |
0.01098901 |
0.02880992 |
|
Central South University |
6 |
3.68349629 |
0.00869565 |
0.01030964 |
|
Hunan University |
6 |
15.7512885 |
0.00970874 |
0.01769455 |
|
Central University Of Finance And Economics |
6 |
11.6468359 |
0.00934579 |
0.01982576 |
|
Beijing Normal University |
6 |
2.92620425 |
0.00833333 |
0.0105375 |
|
Renmin University of China |
6 |
63.3675084 |
0.01086957 |
0.02922911 |
|
Wuhan University |
7 |
31.5232116 |
0.00909091 |
0.02422635 |
|
Zhongnan University of Economics and Law |
7 |
66.2267854 |
0.01075269 |
0.02987929 |
|
Nanjing University |
7 |
24.0010347 |
0.01010101 |
0.01847025 |
|
Hefei University of Technology |
7 |
1.42119499 |
0.00793651 |
0.007564 |
|
Xi'an Jiaotong University |
8 |
47.2449909 |
0.01086957 |
0.0229248 |
|
Anhui University of Finance and Economics |
8 |
56.4489133 |
0.01030928 |
0.02622356 |
|
China University of Mining and Technology |
8 |
13.3217728 |
0.01 |
0.01619428 |
|
Shanghai University of Finance and Economics |
8 |
16.6831211 |
0.00952381 |
0.01668038 |
|
Tsinghua University |
8 |
44.2657914 |
0.01052632 |
0.02700066 |
|
Shanghai University |
9 |
15.1564341 |
0.00925926 |
0.01681766 |
|
Tongji University |
9 |
28.4068313 |
0.00970874 |
0.01856064 |
|
Jinan University |
10 |
5.1875511 |
0.00826446 |
0.0100525 |
|
South China University of Technology |
10 |
4.49778386 |
0.008 |
0.00812109 |
|
Xi’an Jiaotong University |
11 |
63.9978152 |
0.01098901 |
0.02467189 |
|
Northwestern Polytechnical University |
11 |
22.6997441 |
0.00892857 |
0.01933931 |
|
Tianjin University |
11 |
9.63410702 |
0.00961538 |
0.01513702 |
|
Ilma University |
12 |
48.8280521 |
0.01052632 |
0.04472029 |
|
School of Management and Economics |
12 |
49.7837062 |
0.01075269 |
0.040456 |
|
Dalian University of Technology |
12 |
33.0170176 |
0.01086957 |
0.0396344 |
|
Harbin Engineering University |
13 |
32.4283676 |
0.00934579 |
0.01468326 |
|
Jilin University |
14 |
0.47619048 |
0.00699301 |
0.00662498 |
Figure 14. Institutional CollabNet map of green innovation research
Figure 15. Country CollabNet map of green innovation research
4.17 Country collaboration networks
Table 15 displays the collaboration network at the country level, revealing which countries tend to collaborate more often in green innovation research. The data is sorted into distinct clusters, showing regional collaborations: Cluster 1 is dominated by Asian countries like China, Pakistan, Malaysia, and India, highlighting the significant collaboration within the region. China exhibits a notably high Betweenness, Closeness, and PageRank, marking it the core country of collaboration in this cluster. This indicates China's leading role in the field of green innovation research. Cluster 2 primarily comprises European nations, showcasing the intra-European collaborations. Countries like Italy, Spain, and France appear as prominent players within this cluster. Clusters 3 and 4 include a few countries, hinting at more specialized or thematic collaborations.
High betweenness signifies a country's role as a 'bridge' in the network. China's exceptionally high betweenness indicates its crucial role in connecting various countries in the collaboration network. A higher closeness suggests that a country collaborates more uniformly with other countries. China, again, takes a leading role, followed by countries like the UK and Malaysia (see Figure 15). With PageRank reflecting the influence of a node within the network, China dominates the PageRank metric, emphasizing its crucial role in the collaborative research ecosystem. Asia's leading role in the collaborative space was reinforced with Asian countries, especially China, evidently at the forefront of collaborations, reflecting the region's increasing emphasis on research and global collaboration. European countries showed significant interconnectivity, reflecting Europe's academic and research cooperation history. Some countries with lower metrics, like Austria, Tunisia, and Nigeria, may still be essential in specialized or niche research areas. These can be valuable for more focused collaborative ventures. Countries with lower metrics, especially in critical clusters such as Canada, Bangladesh, and Lithuania (see Figure 15), may have opportunities to increase their collaborations and expand their research influence. Some of the recommendations for future exploration include exploring specific themes or research areas around which these collaborations revolve. Also, a detailed country analysis of countries like China, which plays a dominant role, can be further investigated to understand their collaboration patterns, key research areas, and partnership strategies.
Table 15. Country CollabNet of green innovation research
|
Node |
Cluster |
Betweenness |
Closeness |
Pagerank |
|
China |
1 |
515.220591 |
0.01818182 |
0.20090749 |
|
Pakistan |
1 |
64.2781747 |
0.01492537 |
0.093395 |
|
United Kingdom |
1 |
111.830939 |
0.015625 |
0.06136187 |
|
Malaysia |
1 |
18.233834 |
0.01333333 |
0.05047141 |
|
India |
1 |
22.5030236 |
0.01351351 |
0.02980444 |
|
USA |
1 |
15.8200179 |
0.01388889 |
0.04134673 |
|
Indonesia |
1 |
0.54279999 |
0.01176471 |
0.01352946 |
|
Saudi Arabia |
1 |
36.1904112 |
0.01351351 |
0.03539864 |
|
Australia |
1 |
19.2408837 |
0.01369863 |
0.03141019 |
|
Thailand |
1 |
0.41022978 |
0.01176471 |
0.01386312 |
|
Korea |
1 |
1.54549477 |
0.01136364 |
0.01492174 |
|
Turkey |
1 |
3.21314319 |
0.0125 |
0.02184154 |
|
Romania |
1 |
1.43526514 |
0.01190476 |
0.01577878 |
|
Poland |
1 |
7.67666416 |
0.01176471 |
0.01251639 |
|
United Arab Emirates |
1 |
12.0671712 |
0.01282051 |
0.02092679 |
|
Sweden |
1 |
0.81439255 |
0.01149425 |
0.00867429 |
|
Japan |
1 |
0 |
0.01010101 |
0.00616791 |
|
Bangladesh |
1 |
10.0106913 |
0.01149425 |
0.01541049 |
|
Peru |
1 |
0.88129348 |
0.01136364 |
0.01248732 |
|
Norway |
1 |
0.26463539 |
0.01149425 |
0.00983449 |
|
Hong Kong |
1 |
0.03853807 |
0.01075269 |
0.00887515 |
|
Ghana |
1 |
0.00325733 |
0.01 |
0.00631262 |
|
New Zealand |
1 |
0.03551539 |
0.01075269 |
0.00816871 |
|
Nigeria |
1 |
0.29404831 |
0.01149425 |
0.00959111 |
|
Bahrain |
1 |
0.00454545 |
0.01020408 |
0.00547334 |
|
South Africa |
1 |
0.0335459 |
0.01075269 |
0.00865386 |
|
Oman |
1 |
1.34511714 |
0.01149425 |
0.01191048 |
|
Singapore |
1 |
0 |
0.00980392 |
0.00602631 |
|
Ecuador |
1 |
5.63472804 |
0.01098901 |
0.00877967 |
|
Lithuania |
1 |
0.08731918 |
0.0106383 |
0.00717758 |
|
Italy |
2 |
37.7308995 |
0.01369863 |
0.03382439 |
|
Spain |
2 |
15.0806814 |
0.01204819 |
0.01866305 |
|
France |
2 |
21.0071746 |
0.01351351 |
0.02692149 |
|
Brazil |
2 |
0.57552706 |
0.01098901 |
0.01012709 |
|
Germany |
2 |
7.14253281 |
0.01190476 |
0.01150035 |
|
Portugal |
2 |
0.47586838 |
0.01123596 |
0.00832319 |
|
Canada |
2 |
1.81254243 |
0.01098901 |
0.01109947 |
|
Ireland |
2 |
1.06967206 |
0.01176471 |
0.01032277 |
|
Iran |
2 |
0.04300619 |
0.01111111 |
0.00666647 |
|
Netherlands |
2 |
2.1337148 |
0.01075269 |
0.00695583 |
|
Finland |
2 |
11.62917 |
0.01176471 |
0.01187818 |
|
Greece |
2 |
0 |
0.01030928 |
0.00450111 |
|
Switzerland |
2 |
0.2889222 |
0.01098901 |
0.00700229 |
|
Denmark |
2 |
0.23157811 |
0.01123596 |
0.00797534 |
|
Slovakia |
2 |
0.00416667 |
0.01020408 |
0.00408382 |
|
Austria |
2 |
0.47854004 |
0.00917431 |
0.00589974 |
|
Jordan |
3 |
0.03608297 |
0.0106383 |
0.00540142 |
|
Tunisia |
3 |
1.20799133 |
0.01010101 |
0.00627802 |
|
Egypt |
3 |
0.39565826 |
0.00980392 |
0.00725755 |
|
Ukraine |
4 |
0 |
0.00909091 |
0.00430152 |
4.18 Collaborative world map
Figure 16 represents a collaborative world map, underlining the frequency of collaborations between various countries. Author can observe that China has extensive collaborations with many countries. Importantly, its collaborations with Pakistan, the United Kingdom, and the USA stand out in frequency. Australia collaborates with numerous countries, but each collaboration tends to have a lower frequency. European countries such as Italy, Spain, France, and the United Kingdom collaborate within Europe and with other continents. Some countries have targeted collaborations, such as Azerbaijan with Georgia or Bahrain with Oman. Some collaborations were also observed; the China-Pakistan collaboration has 115 instances, one of the most significant collaborations in Table 15, indicating a close relationship or joint projects of considerable scale. There are also the China-Malaysia and China-UK collaborations. These collaborations, with 35 and 58 instances, respectively, showcase the importance of these partnerships for China.
Given the nature of the countries involved, one collaboration might be focused on specific themes or projects. For instance, collaborations between countries with solid technological bases might be in areas like tech or AI. In contrast, others might focus more on areas like agriculture, energy, or climate change. The frequency and nature of collaborations can clarify geopolitical relationships. China's extensive collaborations suggest its active role in global affairs and research. High collaboration frequencies indicate academic or research collaborations and economic and strategic alliances. Countries with significant collaborations might be leading in certain areas of research and development. Some collaborations occur regionally, such as between countries in the Middle East or within Europe. This might be due to geographical proximity, cultural similarities, or regional alliances. Collaborations, such as between the United Kingdom and India or France and its former colonies, might be influenced by historical or colonial ties. Further exploration can be done to understand the nature of these collaborations-academic, economic, technological, etc. The influence of global events, such as political changes or the COVID-19 pandemic, on these collaborations would be interesting. Exploring cooperation such as the China-Pakistan or China-UK relationships would be intellectually stimulating since it would provide valuable insights into these alliances' extensive nature and scope.
Figure 16. Collaborative world map of green innovation research
This study on GIM has revealed key insights from bibliometric analysis, thematic evolution, conceptual structure mapping, co-citation networks, and country collaboration networks. The research indicates a marked evolution in green innovation discussions. Throughout 2019-2023, topics have shifted from specific 'green innovations' and their socio-economic impacts to more wider dialogues within 'innovation'. This shift indicates the embedding of green principles into the broader innovation ecosystem. As evidenced by the weighted incidence and occurrence of terms, the study showcases green innovation's intersection with economic growth, policy, and environmental well-being. These trends reflect the growing integration of environmental considerations into mainstream research discussions and practices.
The study's conceptual structure map reveals a dense concentration of key terms, underlining the interconnectedness of subjects within green innovation. The mapping highlights the core themes-particularly those about China, which is foundational to the research domain's structure. Similarly, the co-citation analysis outlines a scholarly community structured around influential works that have shaped the field's theoretical underpinnings and research trajectories. The centrality of works within the co-citation network underscores the salience of foundational research. It points to opportunities for new contributions that can bridge gaps or foster connections between emerging paradigms. The country collaboration analysis provides a macroscopic view of global research partnerships. The centrality of China in collaborations suggests it is a pivotal contributor and connector in green innovation research, signifying its role in advancing the field globally. European countries display strong internal collaborative ties, while Asian countries exhibit a significant regional emphasis. The high frequency of collaborations between certain countries, such as China and Pakistan or China and the UK, underlines these partnerships' bilateral strength and potential thematic focus areas. These networks reveal the geopolitical landscape of research, highlighting opportunities for intercountry collaboration that could be capitalized on by researchers and policymakers alike.
GIM as a field of research is characterized by dynamic thematic evolution, as evidenced by the integration of environmental sustainability into the broader innovation dialogue. The study's mapping and network analyses reveal a field influenced by geographic regions and driven by central nodes of foundational research. The prominence of certain countries, especially China, indicates concentrated efforts and significant contributions to the field-a testament to the strategic prioritization of green innovation in achieving sustainable development goals on the international stage. Researchers, academicians, and policymakers can align their efforts with these insights to contribute to the field more effectively and foster partnerships that advance global sustainability objectives by understanding the structural and collaborative makeup of the green innovation landscape.
This study makes significant contributions to academia by exploring the knowns and the unknowns related to global GIM while tracking the metrics of publication outputs by researchers, institutions, green trends, and their impact on the academic community. The research achieves this by identifying the major players and collaborative networks, which helps to illustrate the multidisciplinary nature of green innovation research. The findings also uncovered regional differences, which examined how policy frameworks shape the GIM research output. The study also serves as a secondary resource for scholars dedicated to advancing sustainable development and green innovation practices by highlighting areas that have yet to be explored and proposing directions for future studies.
Future empirical research could validate the theories and hypotheses presented by conducting longitudinal studies that track the development and impact of green innovations over time; comparative case studies across different countries and sectors can provide deeper insights into the effectiveness of specific policies and technologies [120, 121]. Employing mixed methods, combining quantitative data with qualitative interviews and field observations, can offer a better understanding of green innovation's real-world applications and challenges [122]. Experimental research designs like randomized controlled trials can test the causal relationships between policy interventions and innovation outcomes [123, 124], further substantiating the proposed theories and hypotheses.
In considering the future directions of green innovation research, a targeted approach should prioritize the exploration of emerging technological intersections, such as AI's role in sustainability, and assess China's ascendancy within the field through in-depth case studies, providing insights into effective policies and collaborative strategies. The evolving nature of cross-country collaborative impacts, especially within prominent clusters, warrants further comparative analysis to determine the socioeconomic conditions driving GIM research. The contributions and integrations of non-academic stakeholders are vital, suggesting a need for research focused on multi-stakeholder collaborations that bridge the gap between academic findings and real-world scenarios with consequences for flora, fauna, and the environment. While niche sectors within GIM present specialized study opportunities, it is also critical to understand global events' influence on research trajectories. These primary themes, underlined by considerations such as interdisciplinary approaches, regional collaborations, and network dynamics, form the recommended focal points for future research agendas in GIM.
Based on the publications, the study findings revealed the emerging technologies that have been instrumental in driving GIM discourse and are considered contributors to the sustainability dialogue across the board. The following technologies are deemed integral to green innovation development. The first is renewable energy technologies such as solar, wind, and hydroelectric power [9, 125]; the output demonstrated China's dominance in green innovation research, where institutions like Jiangsu University, Zhejiang University, and others displayed a global emphasis on renewable energy. The potential of these technologies is immense, especially in climate change science regarding ozone layer depletion, reducing carbon emissions, and positioning nations toward transitioning to a low-carbon economy [126].
Another important emerging technology is energy storage solutions; research on advanced battery technologies and energy storage systems shows that these are vital to stabilizing the supply and demand for renewable energy; green innovation in this area has the capacity to enhance the efficiency and reliability of renewable energy sources, making them more attractive to investors and driving widespread adoption [127, 128].
The findings also showed that green manufacturing technologies also appear on the horizon of green innovation research; significant innovations identified include 3D printing and eco-friendly materials, which have been utilized to transform traditional production processes; it has been documented how these technologies have been deployed to reduce waste, enhance resource efficiency, and lower environmental impact by aligning with global SDGs. Smart grid and Internet of Things (IoT) are also essential technologies in the green innovation discourse; they have been deployed to facilitate real-time energy management, enabling energy optimization and reducing power usage wastage, creating a more efficient and resilient energy system [129, 130]. The studies also identified Carbon Capture and Storage (CCS) technologies as vital for mitigating the effects of climate change by capturing and storing carbon emissions from industrial processes; their development and implementation have been identified as critical for nations to achieve the net-zero emission targets [131, 132].
Finally, sustainable agricultural technologies were also identified as emerging green innovation technologies that are exciting researchers. Their applications include precision farming and biotechnology to improve agricultural productivity while minimizing environmental damage. The core function of these technologies is contributing to food security and sustainable land use, thus reducing the potential for conflict due to scarce resources. The potential advantages that these technologies offer to economies are still being developed with new information; what is clear is that their advancement portends progress and a better quality of life for humans and the planet. Continuous investment in R&D is critical to achieving long-term sustainability that addresses global environmental issues.
5.1 Limitations
While valuable for mapping research trends and identifying key contributors, bibliometric analysis has limitations and potential biases. One significant limitation is its reliance on citation data, which can be influenced by factors unrelated to the actual quality or impact of the research, such as publication language, journal reputation, and self-citation practices; it has the possibility of leading to overrepresenting particular institutions or countries, particularly those in English-speaking or developed regions [133, 134]. This was clear in the research output on green innovation, with China overwhelmingly dominant among global universities. However, some of the best work on green innovation is not exclusive to Chinese universities.
Another area for improvement is the potential for database bias. The analysis often depends on specific databases (in our case-Scopus), which may need more coverage, especially for emerging or interdisciplinary fields. This can result in underrepresenting relevant research from smaller institutions or developing countries. This may also have occurred in this study as only the Scopus database was used to select the study data. Bibliometric analysis also tends to favor more established fields with longer publication histories, potentially overlooking newer areas of innovation. The method primarily focuses on quantitative data, such as publication counts and citation metrics, which may need to fully capture the qualitative aspects of research impact, such as societal or policy influence. Furthermore, the analysis may need to account for scientific research's dynamic and evolving nature, where collaborations and research priorities can shift rapidly. While bibliometric analysis provides valuable insights, it should be complemented with other qualitative and contextual evaluations to provide a more comprehensive understanding of research impact and trends [135, 136].
5.2 Recommendations for policymakers
The following specific recommendations are suggested for policymakers on how government policies can be advanced to promote the implementation of green innovation:
Establish tax incentives, grants, and subsidies for companies and research institutions engaged in green innovation. This will reduce financial barriers and encourage investment in sustainable technologies.
Implement stringent environmental regulations that mandate the adoption of green technologies; these policies should include clear targets for reducing carbon emissions, waste management, and resource efficiency.
Facilitate collaborations between government agencies, the private sector, and academia; PPP agreements can pool resources and expertise to accelerate the development and deployment of green innovations.
Create innovation hubs or centers of excellence focused on green technologies. These hubs should provide infrastructure, funding, and networking opportunities to support startups and researchers.
Implement policies that create demand for green products and services. This can include public procurement policies favoring sustainable products and providing consumer incentives for green purchases.
Invest in education and training programs to build a skilled workforce capable of driving green innovation, focusing on sustainability, renewable energy, and environmental management.
Develop frameworks that support the transfer of green technologies from research institutions to industry; this includes intellectual property rights management and commercialization support.
Engage in international agreements and collaborations to share knowledge, technologies, and best practices in green innovation; global cooperation can enhance the effectiveness of local policies.
I am grateful to the members of my doctoral commission at WSB University for their invaluable guidance and support throughout the development of this research. Their feedback and insights significantly improved this work. I would also like to thank the anonymous reviewers for their insightful comments during the peer-review process, which further strengthened this article.
[1] Cisneros, P., Shamsuzzoha, A., Kuusniemi, H., Jovanovski, B. (2023). Defining green innovation, its impact, and cycle-A literature analysis. Cleaner Engineering and Technology, 17: 100693. https://doi.org/10.1016/j.clet.2023.100693
[2] Liu, M., Liu, L., Feng, A. (2024). The impact of green innovation on corporate performance: An analysis based on substantive and strategic green innovations. Sustainability, 16(6): 2588. https://doi.org/10.3390/su16062588
[3] Oduro, S., Maccario, G., De Nisco, A. (2022). Green innovation: A multidomain systematic review. European Journal of Innovation Management, 25(2): 567-591. https://doi.org/10.1108/EJIM-10-2020-0425
[4] Bigliardi, B., Bertolini, M. (2012). Green innovation management: Theory and practice. European Journal of Innovation Management, 15(4). https://doi.org/10.1108/ejim.2012.22015daa.001
[5] Abadzhiev, A., Sukhov, A., Sihvonen, A., Johnson, M. (2022). Managing the complexity of green innovation. European Journal of Innovation Management, 25(6): 850-866. https://doi.org/10.1108/EJIM-02-2022-0098
[6] Gao, K., Wang, L., Liu, T., Zhao, H. (2022). Management executive power and corporate green innovation-Empirical evidence from China's state-owned manufacturing sector. Technology in Society, 70: 102043. https://doi.org/10.1016/j.techsoc.2022.102043
[7] Doran, J., Ryan, G., McCarthy, N., O'Connor, M. (2023). Green innovation launch versus expansion: Do the public policy supports needed vary by firm size? International Journal of Innovation Management, 27(6). https://doi.org/10.1142/S1363919623500299
[8] Luan, D., Cao, H., Qu, T. (2023). How does corporate green innovation strategy translate into green innovation performance based on chain mediation? Sustainability, 15(16): 12507. https://doi.org/10.3390/su151612507
[9] Guang-lin, X., Tao, M. (2023). How can management ability promote green technology innovation of manufacturing enterprises? Evidence from China. Frontiers in Environmental Science, 10: 1051636. https://doi.org/10.3389/fenvs.2022.1051636
[10] Wang, Y., Ozturk, I. (2023). Role of green innovation, green internal and external supply chain management practices: A gateway to environmental sustainability. Economic Research-Ekonomska Istraživanja, 36(3). https://doi.org/10.1080/1331677X.2023.2192769
[11] Yuniarti, E., Damanik, F.H.S., Dewata, I., Nugraha, F.A.D. (2024). Urban green space as a solution for degenerative diseases: A perspective based on a literature review. International Journal of Sustainable Development & Planning, 19(4): 1271-1279. https://doi.org/10.18280/ijsdp.190405
[12] Karim, R.A., Kawser, S., Rabiul, M.K., Chowdhury, T., Murtaza, F.N.Y. (2024). Green supply chain management practices and environmental performance in the healthcare sector: The mediating role of green innovation. Global Knowledge, Memory and Communication. https://doi.org/10.1108/GKMC-10-2023-0407
[13] Issa, H., Jabbouri, R. (2022). Green innovation in the MENA healthcare industry: A knowledge-based view. International Journal of Technology and Human Interaction (IJTHI), 18(1): 1-26. http://doi.org/10.4018/IJTHI.299072
[14] Sun, Y., Bi, K., Yin, S. (2020). Measuring and integrating risk management into green innovation practices for green manufacturing under the global value chain. Sustainability, 12(2): 545. https://doi.org/10.3390/su12020545
[15] Zhou, L., Dai, Y. (2023). Green production management and innovation nexus: Evidence from technology-based SMEs of China. Sustainability, 15(6): 4710. https://doi.org/10.3390/su15064710
[16] Shahzad, M., Qu, Y., Rehman, S.U., Zafar, A.U. (2022). Adoption of green innovation technology to accelerate sustainable development among manufacturing industry. Journal of Innovation & Knowledge, 7(4): 100231. https://doi.org/10.1016/j.jik.2022.100231
[17] Yang, H., Zhu, X. (2021). Research on green innovation performance of manufacturing industry and its improvement path in China. Sustainability, 14(13): 8000. https://doi.org/10.3390/su14138000
[18] Makpotche, M., Bouslah, K., M’Zali, B. (2024). Corporate governance and green innovation: International evidence. Review of Accounting and Finance, 23(2): 280-309. https://doi.org/10.1108/RAF-04-2023-0137
[19] Rupasinghe, L.R., Pushpakumari, M.D., Perera, G.D.N. (2024). Mapping the knowledge of green innovation: A systematic literature review. Journal of Humanities and Applied Social Sciences. https://doi.org/10.1108/JHASS-10-2023-0148
[20] Da Silva, A.R., Cirani, C.B., Serra, F.A., Pigola, A., Da Costa, P.R., Scafuto, I.C., Ruas, R.L., Mazieri, M.R. (2023). Determining factors on green innovation adoption: An empirical study in Brazilian agribusiness firms. Sustainability, 15(7): 6266. https://doi.org/10.3390/su15076266
[21] Suki, N.M., Suki, N.M., Sharif, A., Afshan, S., Rexhepi, G. (2023). Importance of green innovation for business sustainability: Identifying the key role of green intellectual capital and green SCM. Business Strategy and the Environment, 32(4): 1542-1558. https://doi.org/10.1002/bse.3204
[22] Qiang, F., Yang, X. (2023) Green innovation and firm performance: Review and prospects. Open Journal of Social Sciences, 11(10): 161-176. https://doi.org/10.4236/jss.2023.1110011
[23] Wang, S., Abbas, J., Sial, M.S., Álvarez-Otero, S., Cioca, L.I. (2022). Achieving green innovation and sustainable development goals through green knowledge management: Moderating role of organizational green culture. Journal of Innovation & Knowledge, 7(4): 100272. https://doi.org/10.1016/j.jik.2022.100272
[24] Khan, P.A., Johl, S.K. (2019). Nexus of comprehensive green innovation, environmental management system-14001-2015 and firm performance. Cogent Business & Management, 6(1): 1691833. https://doi.org/10.1080/23311975.2019.1691833
[25] Leyva-de la Hiz, D.I., Hurtado-Torres, N., Bermúdez-Edo, M. (2019). The heterogeneity of levels of green innovation by firms in international contexts: A study based on the home-country institutional profile. Organization & Environment, 32(4): 508-527. https://doi.org/10.1177/1086026618761623
[26] Gyau, E.B., Sakuwuda, K., Asimeng, E. (2023). A comprehensive bibliometric analysis and visualization of publications on environmental innovation. Journal of Scientometric Research, 12(3): 544-557. https://doi.org/10.5530/jscires.12.3.052
[27] Máté, D., Estiyanti, N.M., Novotny, A. (2024). How to support innovative small firms? Bibliometric analysis and visualization of start-up incubation. Journal of Innovation and Entrepreneurship, 13(1): 5. https://doi.org/10.1186/s13731-024-00361-z
[28] Niu, P., Sun, K., Sun, L., Chang, C. (2024). The political economy and green innovation: A scientometric analysis. Innovation and Green Development, 3(2): 100116. https://doi.org/10.1016/j.igd.2023.100116
[29] Punj, N., Ahmi, A., Tanwar, A., Abdul Rahim, S. (2023). Mapping the field of green manufacturing: A bibliometric review of the literature and research frontiers. Journal of Cleaner Production, 423: 138729. https://doi.org/10.1016/j.jclepro.2023.138729
[30] Salouw, E., Setiawan, B., Roychansyah, M.S., Sarwadi, A. (2024). Bibliometric analysis of tourism and community participation research: A comparison of Scopus and Web of Science databases. International Journal of Sustainability and Development Perspectives, 19(4): 1415-1422. https://doi.org/10.18280/ijsdp.190419
[31] Qi, X., Yang, Z. (2023). Drivers of green innovation in BRICS countries: Exploring tripple bottom line theory. Economic Research-Ekonomska Istraživanja, 36(3). https://doi.org/10.1080/1331677X.2022.2150670
[32] Xie, D., Saeed, N., Akhter, S., Kumar, T. (2022). A step towards a sustainable environment in top Asian countries: The role of higher education and technology innovation. Economic Research-Ekonomska Istraživanja, 36(3). https://doi.org/10.1080/1331677X.2022.2152359
[33] Ahmed, F., Kousar, S., Pervaiz, A., Trinidad-Segovia, J.E., Casado-Belmonte, P., Ahmed, W. (2022). Role of green innovation, trade and energy to promote green economic growth: A case of South Asian Nations. Environmental Science and Pollution Research International, 29(5): 6871-6885. https://doi.org/10.1007/s11356-021-15881-4
[34] Tan, Y.Y., Omar, R. (2021). Green practices and innovations of traditional Chinese medicine (TCM) Industry in Singapore: Idea worth sharing. Sustainability, 14(18): 11588. https://doi.org/10.3390/su141811588
[35] Agamuthu, P., Babel, S. (2023). Waste management developments in the last five decades: Asian perspective. Waste Management & Research, 41(12): 1699-1716. https://doi.org/10.1177/0734242X231199938
[36] Aldieri, L., Carlucci, F., Cirà, A., Ioppolo, G., Vinci, C.P. (2019). Is green innovation an opportunity or a threat to employment? An empirical analysis of three main industrialized areas: The USA, Japan and Europe. Journal of Cleaner Production, 214: 758-766. https://doi.org/10.1016/j.jclepro.2019.01.016
[37] Ohta, H., Barrett, B.F. (2023). Politics of climate change and energy policy in Japan: Is green transformation likely? Earth System Governance, 17: 100187. https://doi.org/10.1016/j.esg.2023.100187
[38] Nem Singh, J.T. (2023). The advance of the state and the renewal of industrial policy in the age of strategic competition. Third World Quarterly, 44(9): 1919-1937. https://doi.org/10.1080/01436597.2023.2217766
[39] Yeung, H.W.C. (2017). Governing the market in a globalizing era: Developmental states, global production networks and inter-firm dynamics in East Asia. In Global Value Chains and Global Production Networks. Routledge, 21(1): 70-101. http://www.jstor.org/stable/24673065.
[40] Ha, Y.H., Byrne, J. (2019). The rise and fall of green growth: Korea's energy sector experiment and its lessons for sustainable energy policy. Wiley Interdisciplinary Reviews: Energy and Environment, 8(4): e335. https://doi.org/10.1002/wene.335
[41] Lee, J.H., Woo, J. (2020). Green new deal policy of South Korea: Policy innovation for a sustainability transition. Sustainability, 12(23): 10191. https://doi.org/10.3390/su122310191
[42] Zhang, H., Shao, Y., Han, X., Chang, H. (2022). A road towards ecological development in China: The nexus between green investment, natural resources, green technology innovation, and economic growth. Resources Policy, 77: 102746. https://doi.org/10.1016/j.resourpol.2022.102746
[43] Lema, R., Bhamidipati, P.L., Gregersen, C., Hansen, U.E., Kirchherr, J. (2021). China’s investments in renewable energy in Africa: Creating co-benefits or just cashing-in? World Development, 141: 105365. https://doi.org/10.1016/j.worlddev.2020.105365
[44] Hepburn, C., Qi, Y., Stern, N., Ward, B., Xie, C., Zenghelis, D. (2021). Towards carbon neutrality and China's 14th Five-Year Plan: Clean energy transition, sustainable urban development, and investment priorities. Environmental Science and Ecotechnology, 8: 100130. https://doi.org/10.1016/j.ese.2021.100130
[45] He, H., Sun, F., Wang, Z., Lin, C., Zhang, C., Xiong, R., Deng, J., Zhu, X., Xie, P., Zhang, S., Wei, Z., Cao, W., Zhai, L. (2022). China's battery electric vehicles lead the world: Achievements in technology system architecture and technological breakthroughs. Green Energy and Intelligent Transportation, 1(1): 100020. https://doi.org/10.1016/j.geits.2022.100020
[46] Dey, S., Sreenivasulu, A., Veerendra, G., Rao, K.V., Babu, P.A. (2022). Renewable energy present status and future potentials in India: An overview. Innovation and Green Development, 1(1): 100006. https://doi.org/10.1016/j.igd.2022.100006
[47] Shiradkar, N., Arya, R., Chaubal, A., Deshmukh, K., Ghosh, P., Kottantharayil, A., Kumar, S., Vasi, J. (2022). Recent developments in solar manufacturing in India. Solar Compass, 1: 100009. https://doi.org/10.1016/j.solcom.2022.100009
[48] Aleluia, J., Tharakan, P., Chikkatur, A., Shrimali, G., Chen, X. (2022). Accelerating a clean energy transition in Southeast Asia: Role of governments and public policy. Renewable and Sustainable Energy Reviews, 159: 112226. https://doi.org/10.1016/j.rser.2022.112226
[49] Govindarajan, L., Bin Mohideen Batcha, M.F., Bin Abdullah, M.K. (2023). Solar energy policies in southeast Asia towards low carbon emission: A review. Heliyon, 9(3): e14294. https://doi.org/10.1016/j.heliyon.2023.e14294
[50] Aregarot, P., Kubaha, K., Chiarakorn, S. (2024). A study of sustainability concepts for developing green universities in Thailand. Sustainability, 16(7): 2892. https://doi.org/10.3390/su16072892
[51] Leknoi, U., Rosset, P., Likitlersuang, S. (2023). Multi-criteria social sustainability assessment of highland maize monoculture in Northern Thailand using the SAFA tool. Resources, Environment and Sustainability, 13: 100115. https://doi.org/10.1016/j.resenv.2023.100115
[52] Jotaworn, S., Nitivattananon, V., Teparakul, O., Wongboontham, T., Sugiyama, M., Numata, M., Alvarez, D.D. (2023). Households’ willingness to pay for renewable energy alternatives in Thailand. Social Sciences, 12(11): 634. https://doi.org/10.3390/socsci12110634
[53] Muangjai, P., Wongsapai, W., Bunchuaidee, R., Tridech, N., Ritkrerkkrai, C., Damrongsak, D. (2021). Assessment of carbon reduction costs in renewable energy technologies for heat generation in Thailand. Energy Reports, 7: 366-373. https://doi.org/10.1016/j.egyr.2021.07.114
[54] Sadiq, M., Le-Dinh, T., Tran, T.K., Chien, F., Phan, T.T.H., Quang Huy, P. (2023). The role of green finance, eco-innovation, and creativity in the sustainable development goals of ASEAN countries. Economic Research-Ekonomska Istraživanja, 36(2). https://doi.org/10.1080/1331677X.2023.2175010
[55] Srisathan, W.A., Ketkaew, C., Phonthanukitithaworn, C., Naruetharadhol, P. (2023). Driving policy support for open eco-innovation enterprises in Thailand: A probit regression model. Journal of Open Innovation: Technology, Market, and Complexity, 9(3): 100084. https://doi.org/10.1016/j.joitmc.2023.100084
[56] Xuan, V.N., Hoa, P.X., Thu, N.T.P., Huong, L.M. (2023). Factors affecting environmental pollution for green economy: The case of ASEAN countries. Environmental Challenges, 14: 100827. https://doi.org/10.1016/j.envc.2023.100827
[57] Sultana, T., Hossain, M.S., Voumik, L.C., Raihan, A. (2023). Democracy, green energy, trade, and environmental progress in South Asia: Advanced quantile regression perspective. Heliyon, 9(10). https://doi.org/10.1016/j.heliyon.2023.e20488
[58] Awewomom, J., Dzeble, F., Takyi, Y.D., Ashie, W.B., Ettey, E.N.Y.O., Afua, P.E., Sackey, L.N.A., Opoku, F., Akoto, O. (2024). Addressing global environmental pollution using environmental control techniques: A focus on environmental policy and preventive environmental management. Discover Environment, 2: 8. https://doi.org/10.1007/s44274-024-00033-5
[59] Fallah Shayan, N., Alavi, S., Zahed, M.A. (2022). Sustainable development goals (SDGs) as a framework for corporate social responsibility (CSR). Sustainability, 14(3): 1222. https://doi.org/10.3390/su14031222
[60] Rehman, S., Holý, O. (2022). Is green and sustainable technological innovation a potential driver of environmental performance? An empirical investigation across the ASEAN region. Frontiers in Environmental Science, 10: 958203. https://doi.org/10.3389/fenvs.2022.958203
[61] Bradu, P., Biswas, A., Nair, C., Sreevalsakumar, S., Patil, M., Kannampuzha, S., Mukherjee, A.G., Wanjari, U.R., Renu, K., Vellingiri, B., Gopalakrishnan, A.V. (2023). Recent advances in green technology and Industrial Revolution 4.0 for a sustainable future. Environmental Science and Pollution Research, 30(60): 124488-124519. https://doi.org/10.1007/s11356-022-20024-4
[62] Kraus, S., Jones, P., Kailer, N., Weinmann, A., Chaparro-Banegas, N., Roig-Tierno, N. (2021). Digital transformation: An overview of the current state of the art of research. Sage Open, 11(3): 21582440211047576. https://doi.org/10.1177/21582440211047576
[63] Martínez-Peláez, R., Ochoa-Brust, A., Rivera, S., Félix, V.G., Ostos, R., Brito, H., Félix, R.A., Mena, L.J. (2023). Role of digital transformation for achieving sustainability: Mediated role of stakeholders, key capabilities, and technology. Sustainability, 15(14): 11221. https://doi.org/10.3390/su151411221
[64] Juginović, A., Vuković, M., Aranza, I., Biloš, V. (2021). Health impacts of air pollution exposure from 1990 to 2019 in 43 European countries. Scientific Reports, 11(1): 22516. https://doi.org/10.1038/s41598-021-01802-5
[65] Opoku, E.E.O., Boachie, M.K. (2020). The environmental impact of industrialization and foreign direct investment. Energy Policy, 137: 111178. https://doi.org/10.1016/j.enpol.2019.111178
[66] Egan, M. (2017). Survival science: Crisis disciplines and the shock of the environment in the 1970s1. Centaurus, 59(1-2): 26-39. https://doi.org/10.1111/1600-0498.12149
[67] Hariram, N.P., Mekha, K.B., Suganthan, V., Sudhakar, K. (2023). Sustainalism: An integrated socio-economic-environmental model to address sustainable development and sustainability. Sustainability, 15(13): 10682. https://doi.org/10.3390/su151310682
[68] Alberton, M. (2012). Environmental protection in the EU member states: Changing institutional scenarios and trends. In Europe in Formation, 1(363): 287-300. https://doi.org/10.3917/eufor.363.0287
[69] Buns, M.A. (2022). Making a model: The 1974 Nordic environmental protection convention and Nordic attempts to form international environmental law. Scandinavian Journal of History, 48(1): 93-115. https://doi.org/10.1080/03468755.2022.2069151
[70] Deters, H. (2019). European environmental policy at 50: Five decades of escaping decision traps? Environmental Policy and Governance, 29(5): 315-325. https://doi.org/10.1002/eet.1855
[71] Kelemen, R.D., Knievel, T. (2015). The United States, the European union, and international environmental law: The domestic dimensions of green diplomacy. International Journal of Constitutional Law, 13(4): 945-965. https://doi.org/10.1093/icon/mov057
[72] Eckert, E., Kovalevska, O. (2021). Sustainability in the European union: Analyzing the discourse of the European green deal. Journal of Risk and Financial Management, 14(2): 80. https://doi.org/10.3390/jrfm14020080
[73] Ishtiaque, A. (2020). Multilevel governance in climate change adaptation: Conceptual clarification and future outlook. Climate Change and Extreme Events, pp. 171-185. https://doi.org/10.1016/B978-0-12-822700-8.00009-3
[74] Dechezleprêtre, A., Nachtigall, D., Venmans, F. (2023). The joint impact of the European Union emissions trading system on carbon emissions and economic performance. Journal of Environmental Economics and Management, 118: 102758. https://doi.org/10.1016/j.jeem.2022.102758
[75] Pohlmann, M. (2009). The European union emissions trading scheme. In Legal Aspects of Carbon Trading. https://doi.org/10.1093/acprof:oso/9780199565931.003.0016
[76] Mrozowska, S., Wendt, J.A., Tomaszewski, K. (2020). The challenges of Poland’s energy transition. Energies, 14(23): 8165. https://doi.org/10.3390/en14238165
[77] Cholewa, M., Mammadov, F. Nowaczek, A. (2022). The obstacles and challenges of transition towards a renewable and sustainable energy system in Azerbaijan and Poland. Mineral Economics, 35: 155-169. https://doi.org/10.1007/s13563-021-00288-x
[78] Wojtaszek, H., Miciuła, I., Modrzejewska, D., Stecyk, A., Sikora, M., Smolarek, M., Kowalczyk, A., Chojnacka, M. (2024). Energy policy until 2050-Comparative analysis between Poland and Germany. Energies, 17(2): 421. https://doi.org/10.3390/en17020421
[79] Ligęza, K., Łaciak, M., Ligęza, B. (2023). Centralized offshore hydrogen production from wind farms in the Baltic Sea Area-A study case for Poland. Energies, 16(17): 6301. https://doi.org/10.3390/en16176301
[80] Kardaś, S. (2023). From coal to consensus: Poland’s energy transition and its European future. European Council on Foreign Relations. https://ecfr.eu/publication/from-coal-to-consensus-polands-energy-transition-and-its-european-future/.
[81] Igliński, B., Piechota, G., Kiełkowska, U., Kujawski, W., Pietrzak, M.B., Skrzatek, M. (2023). The assessment of solar photovoltaic in Poland: The photovoltaics potential, perspectives and development. Clean Technologies and Environmental Policy, 25(1): 281-298. https://doi.org/10.1007/s10098-022-02403-0
[82] Szczotka, K., Szymiczek, J., Pyrek, R. (2023). Thermomodernization as a mechanism for improving energy efficiency and reducing emissions of pollutants into the atmosphere in a public utility building. Energies, 16(13): 5026. https://doi.org/10.3390/en16135026
[83] Hassan, Q., Algburi, S., Jaszczur, M., Al-Razgan, M., Awwad, E.M., Al-Jiboory, A.K., Ahsan, M., Viktor, P., Cuong, N.M., Sameen, A.Z., Salman, H.M. (2024). Adapting German energy transition rules for Iraq through industry, flexibility, and demand management. Futures, 103411. https://doi.org/10.1016/j.futures.2024.103411
[84] Ewald, J., Sterner, T., Sterner, E. (2022). Understanding the resistance to carbon taxes: Drivers and barriers among the general public and fuel-tax protesters. Resource and Energy Economics, 70: 101331. https://doi.org/10.1016/j.reseneeco.2022.101331
[85] Hvelplund, F., Østergaard, P.A., Meyer, N.I. (2017). Incentives and barriers for wind power expansion and system integration in Denmark. Energy Policy, 107: 573-584. https://doi.org/10.1016/j.enpol.2017.05.009
[86] Yang, A., Liu, C., Yang, D., Lu, C. (2022). Electric vehicle adoption in a mature market: A case study of Norway. Journal of Transport Geography, 106: 103489. https://doi.org/10.1016/j.jtrangeo.2022.103489
[87] Koundouri, P., Devves, S., Plataniotis, A. (2021). Alignment of the European green deal, the sustainable development goals and the European semester process: Method and application. Theoretical Economics Letters, 11: 743-770. https://doi.org/10.4236/tel.2021.114049.
[88] Almeida, D.V., Kolinjivadi, V., Ferrando, T., Roy, B., Herrera, H., Gonçalves, M.V., Van Hecken, G. (2023). The “greening” of empire: The european green deal as the EU first agenda. Political Geography, 105: 102925. https://doi.org/10.1016/j.polgeo.2023.102925
[89] Agrawal, R., Agrawal, S., Samadhiya, A., Kumar, A., Luthra, S., Jain, V. (2023). Adoption of green finance and green innovation for achieving circularity: An exploratory review and future directions. Geoscience Frontiers, 101669. https://doi.org/10.1016/j.gsf.2023.101669
[90] Chapariha, M. (2022). Systems dynamics model of SDGs: A case study of Iran. Challenges in Sustainability, 10(1): 3-22. https://doi.org/10.12924/cis2021.10010003
[91] Ninkov, A., Frank, J.R., Maggio, L.A. (2022). Bibliometrics: Methods for studying academic publishing. Perspectives on Medical Education, 11(3): 173-176. https://doi.org/10.1007/s40037-021-00695-4
[92] Van Eck, N., Waltman, L. (2010). Software survey: VOSviewer, a computer program for bibliometric mapping. Scientometrics, 84(2): 523-538. https://doi.org/10.1007/s11192-009-0146-3
[93] Bukar, U.A., Sayeed, M.S., Razak, S.F.A., Yogarayan, S., Amodu, O.A., Mahmood, R.A.R. (2023). A method for analyzing text using VOSviewer. MethodsX, 11: 102339. https://doi.org/10.1016/j.mex.2023.102339
[94] García-Lillo, F., Seva-Larrosa, P., Sánchez-García, E. (2023). What is going on in entrepreneurship research? A bibliometric and SNA analysis. Journal of Business Research, 158: 113624. https://doi.org/10.1016/j.jbusres.2022.113624
[95] Ma, T.J., Lee, G.G., Liu, J.S., Lan, R., Weng, J.H. (2022). Bibliographic coupling: A main path analysis from 1963 to 2020. Information Research, 27(1). https://doi.org/10.47989/irpaper918
[96] Wang, B., Bu, Y., Huang, W. (2018). Document-and keyword-based author co-citation analysis. Data and Information Management, 2(2): 70-82. https://doi.org/10.2478/dim-2018-0009
[97] Zhao, W., Korobskiy, D., Chacko, G. (2021). Delayed recognition: A co-citation perspective. Frontiers in Research Metrics and Analytics, 5: 577131. https://doi.org/10.3389/frma.2020.577131
[98] Huang, J., Zhang, K., Zhao, H., Fu, R., Li, Z. (2023). Environmental effects of China’s export trade to the countries along belt and road: An empirical evidence based on inter-provincial panel data. International Journal of Environmental Research and Public Health, 20(6): 4698. https://doi.org/10.3390/ijerph20064698
[99] Huang, C., Wang, C. (2022). Water pollution, industrial agglomeration and economic growth: Evidence from China. Frontiers in Environmental Science, 10: 1071849. https://doi.org/10.3389/fenvs.2022.1071849
[100] Huo, J., Peng, C. (2023). Depletion of natural resources and environmental quality: Prospects of energy use, energy imports, and economic growth hindrances. Resources Policy, 86: 104049. https://doi.org/10.1016/j.resourpol.2023.104049
[101] Ouyang, X., Liao, J., Sun, C., Cao, Y. (2022). Measure is treasure: Revisiting the role of environmental regulation in Chinese industrial green productivity. Environmental Impact Assessment Review, 98: 106968. https://doi.org/10.1016/j.eiar.2022.106968
[102] Morisawa, F., Nishizaki, Y., Devos, P., Yanagisawa, N., Matsuyama, K., Homma, Y., Ueda, R., Sekine,. M., Daida, H., Minamino, T., Sanada, S. (2022). The association between research funding status and clinical research papers’ citation impact in Japan: A cross-sectional bibliometric study. Frontiers in Medicine, 9: 978174. https://doi.org/10.3389/fmed.2022.978174
[103] Taşkın, Z., Taşkın, A., Doğan, G., Kulczycki, E. (2022). Factors affecting time to publication in information science. Scientometrics, 127: 7499-7515. https://doi.org/10.1007/s11192-022-04296-8
[104] Turki, H., Fraumann, G., Hadj Taieb, M.A., Aouicha, M.B. (2023). Global visibility of publications through Digital Object Identifiers. Frontiers in Research Metrics and Analytics, 8: 1207980. https://doi.org/10.3389/frma.2023.1207980
[105] Gruber, A., Tekles, A., Bornmann, L. (2023). John Mearsheimer’s academic roots: A reference publication year spectroscopy of a political scientist’s oeuvre. Scientometrics, 128(7): 3867-3877. https://doi.org/10.1007/s11192-023-04721-6
[106] Yao, Q., Li, X., Luo, F., Yang, L., Liu, C., Sun, J. (2019). The historical roots and seminal research on health equity: A referenced publication year spectroscopy (RPYS) analysis. International Journal for Equity in Health, 18: 1-15. https://doi.org/10.1186/s12939-019-1058-3
[107] Kageyama, I., Kurata, K., Miyashita, S., Lim, Y., Sengoku, S., Kodama, K. (2022). A bibliometric analysis of wearable device research trends 2001-2022-a study on the reversal of number of publications and research trends in China and the USA. International Journal of Environmental Research and Public Health, 19(24): 16427. https://doi.org/10.3390/ijerph192416427
[108] Shao, Y., Shi, X. (2023). Bibliometric analysis and visualization of research progress in the diabetic nephropathy field from 2001 to 2021. Oxidative Medicine and Cellular Longevity, 2023(1): 4555609. https://doi.org/10.1155/2023/4555609
[109] Lin, T.C., Tang, K. Y., Lin, S.S., Changlai, M.L., Hsu, Y.S. (2022). A co-word analysis of selected science education literature: Identifying research trends of scaffolding in two decades (2000-2019). Frontiers in Psychology, 13: 844425. https://doi.org/10.3389/fpsyg.2022.844425
[110] Kumar, N., Mukhtar, M.S. (2023). Ranking plant network nodes based on their centrality measures. Entropy, 25(4): 676. https://doi.org/10.3390/e25040676
[111] Goldstein, R., Vitevitch, M.S. (2017). The influence of closeness centrality on lexical processing. Frontiers in Psychology, 8: 1683. https://doi.org/10.3389/fpsyg.2017.01683
[112] Bryan, J., Moriano, P. (2023). Graph-based machine learning improves just-in-time defect prediction. Plos One, 18(4): e0284077. https://doi.org/10.1371/journal.pone.0284077
[113] Liu, R., Huang, Y. (2023). Structural analysis of projected networks of shareholders and stocks based on the data of large shareholders’ shareholding in China’s stocks. Mathematics, 11(6): 1545. https://doi.org/10.3390/math11061545
[114] Liao, H., Tang, M., Luo, L., Li, C., Chiclana, F., Zeng, X. (2017). A bibliometric analysis and visualization of medical big data research. Sustainability, 10(1): 166. https://doi.org/10.3390/su10010166
[115] Williams, K. (2022). What counts: Making sense of metrics of research value. Science and Public Policy, 49(3): 518-531. https://doi.org/10.1093/scipol/scac004
[116] Rodríguez-Sabiote, C., Úbeda-Sánchez, Á.M., Lorenzo-Quiles, O., Álvarez-Rodríguez, J. (2023). Knowledge structures of scientific production on COVID-19 in the sphere of education: The case of publications indexed in the Web of Science during 2020. Quality & Quantity, 57: 4285-4305. https://doi.org/10.1007/s11135-022-01564-w
[117] Zhu, S., Li, D., Zhu, J., Feng, H. (2022). Towards a data-rich era: A bibliometric analysis of construction management from 2000 to 2020. Buildings, 12(12): 2242. https://doi.org/10.3390/buildings12122242
[118] Rejeb, A., Rejeb, K., Appolloni, A., Kayikci, Y., Iranmanesh, M. (2023). The landscape of public procurement research: A bibliometric analysis and topic modelling based on Scopus. Journal of Public Procurement, 23(2): 145-178. https://doi.org/10.1108/JOPP-06-2022-0031
[119] Ullah, R., Asghar, I., Griffiths, M.G. (2022). An integrated methodology for bibliometric analysis: A case study of Internet of Things in healthcare applications. Sensors (Basel, Switzerland), 23(1): 67. https://doi.org/10.3390/s23010067
[120] Ndinojuo, B.C.E., Ikems, K.C. (2023). Visualizing environmental reporting in Nigerian newspapers. World of Media. Journal of Russian Media and Journalism Studies, 4: 91-116.
[121] Cinar, E., Simms, C., Trott, P., Demircioglu, M.A. (2022). Public sector innovation in context: A comparative study of innovation types. Public Management Review, 26(1): 265-292. https://doi.org/10.1080/14719037.2022.2080860
[122] Bracio, K., Szarucki, M. (2020). Mixed methods utilisation in innovation management research: A systematic literature review and meta-summary. Journal of Risk and Financial Management, 13(11): 252. https://doi.org/10.3390/jrfm13110252
[123] Bravo-Biosca, A. (2020). Experimental innovation policy. Innovation Policy and the Economy, 20(1): 191-232. https://doi.org/10.1086/705644
[124] Miller, C.J., Smith, S.N., Pugatch, M. (2020). Experimental and quasi-experimental designs in implementation research. Psychiatry Research, 283: 112452. https://doi.org/10.1016/j.psychres.2019.06.027
[125] Rasool, S.F., Zaman, S., Jehan, N., Chin, T., Khan, S., Zaman, Q.U. (2022). Investigating the role of the tech industry, renewable energy, and urbanization in sustainable environment: Policy directions in the context of developing economies. Technological Forecasting and Social Change, 183: 121935. https://doi.org/10.1016/j.techfore.2022.121935
[126] Chien, F., Chau, K.Y., Sadiq, M., Diep, G.L., Tran, T.K., Pham, T.H.A. (2023). What role renewable energy consumption, renewable electricity, energy use and import play in environmental quality? Energy Reports, 10: 3826-3834. https://doi.org/10.1016/j.egyr.2023.10.024
[127] Amir, M., Deshmukh, R.G., Khalid, H.M., Said, Z., Raza, A., Muyeen, S.M., Nizami, A.S., Elavarasan, R.M., Saidur, R., Sopian, K. (2023). Energy storage technologies: An integrated survey of developments, global economical/environmental effects, optimal scheduling model, and sustainable adaption policies. Journal of Energy Storage, 72: 108694. https://doi.org/10.1016/j.est.2023.108694
[128] Wei, P., Abid, M., Adun, H., Kemena Awoh, D., Cai, D., Zaini, J.H., Bamisile, O. (2023). Progress in energy storage technologies and methods for renewable energy systems application. Applied Sciences, 13(9): 5626. https://doi.org/10.3390/app13095626
[129] Kabeyi, M.J.B., Olanrewaju, O.A. (2023). Smart grid technologies and application in the sustainable energy transition: A review. International Journal of Sustainable Energy, 42(1): 685-758. https://doi.org/10.1080/14786451.2023.2222298
[130] Kirmani, S., Mazid, A., Khan, I.A., Abid, M. (2023). A survey on IoT-Enabled smart grids: Technologies, architectures, applications, and challenges. Sustainability, 15(1): 717. https://doi.org/10.3390/su15010717
[131] Bhavsar, A., Hingar, D., Ostwal, S., Thakkar, I., Jadeja, S., Shah, M. (2023). The current scope and stand of carbon capture storage and utilization∼A comprehensive review. Case Studies in Chemical and Environmental Engineering, 8: 100368. https://doi.org/10.1016/j.cscee.2023.100368
[132] Yasemi, S., Khalili, Y., Sanati, A., Bagheri, M. (2023). Carbon Capture and Storage: Application in the oil and gas industry. Sustainability, 15(19): 14486. https://doi.org/10.3390/su151914486
[133] Aksnes, D.W., Langfeldt, L., Wouters, P. (2019). Citations, citation indicators, and research quality: An overview of basic concepts and theories. Sage Open, 9(1): 2158. https://doi.org/10.1177/2158244019829575
[134] Kousha, K., Thelwall, M. (2023). Factors associating with or predicting more cited or higher quality journal articles: An annual review of information science and technology (ARIST) paper. Journal of the Association for Information Science and Technology, 75(3): 215-244. https://doi.org/10.1002/asi.24810
[135] Schrot, O.G., Krimm, H., Schinko, T. (2020). Enabling early career sustainability researchers to conduct transdisciplinary research: Insights from Austria. Challenges in Sustainability, 8(1): 30-42. https://doi.org/10.12924/cis2020.08010030
[136] Florek-Paszkowska, A.K., Hoyos-Vallejo, C.A. (2023). A comprehensive bibliometric analysis and future research directions in the nexus of sustainable business practices and turnover intention. Cleaner and Responsible Consumption, 11: 100146. https://doi.org/10.1016/j.clrc.2023.100146