Ian Kurniawan![]() | Reisya Ichwani
| Reisya Ichwani![]() | Aryansyah
| Aryansyah![]() | Richa Fionasari
| Richa Fionasari![]() | Adri Huda*
| Adri Huda*![]()
© 2024 The authors. This article is published by IIETA and is licensed under the CC BY 4.0 license (http://creativecommons.org/licenses/by/4.0/).
OPEN ACCESS
This study aims to analyze the techno-economic impact of implementing a variety of export-import subsidies on the rooftop photovoltaic plant based on two Ministerial Energy and Mineral Resource (MEMR) in Indonesia: MEMR 49/2018 and MEMR 26/2021. Five of the economic parameters were used to investigate the effect of two regulations with four E-I scenarios. The result showed that the photovoltaic energy in Indonesia is considered as high potential with an average photovoltaic energy of 4.8 kWh/m2. The technical analysis presents that the energy could supply the average society's electricity demand. On the economic analysis, the result showed that all the scenarios based on two MEMR showed a positive net present value (NPV) indicating all the implementations are profitable. However, the scenario based on the new MEMR 26/21 with 100% E-I showed the half time of NPV indicates a less risky project compared to others. On the other hand, the result proved that 100% E-I scenario could be the best scenario to stimulate the RPP development since all the economic parameters showed a massive improvement. The value of Net B/C and ROI with MEMR 26/2021 shifted to approximately 63% and 21.3%, respectively, compared to the scenario on MEMR 49/2018. This result confirmed that the new MEMR 26/2021 could stimulate the growth of rooftop photovoltaic in Indonesia for energy transition to achieve 3.6 Giga-watts Solar Photovoltaic Energy (SPE) Mix by 2025.
renewable energy, export-import subsidies, PV solar energy, Indonesia
Renewable Energy (RNE) resources have been expanded up to 29% of world energy demand in 2021 which was a growth up to 3% compared to energy demand in 2019 [1]. Our World in Data reported that Hydro-Power Energy (HPE) contributed the highest RNE source followed by Windmill Energy (MWE) and Solar Photovoltaic Energy (SPE) [2]. Moreover, the SPE showed the most improved power generation in the last 10 years where the power generation improvement was moved from 31 Terra-watts (TW) in 2010 to 1289 TW in 2022 [3]. The fast growth of SPE is because the SPE stands out as one of the most promising alternatives to increase the utilization of RNE [4]. The SPE is relatively easy to maintain and the cost of having SPE including utility, commercial, and residential keeps declining in the last decade [5]. Furthermore, the SPE is considered as the most feasible energy in terms of technical and economic perspectives which could not only supply energy to society but also support the finances of the society [6, 7].
The International Renewable Energy Agency (IRENA) has published the top 10 countries that have electricity capacity by the SPE [8]. However, Indonesia has not shown good progress in the SPE development since Indonesia only produces 0.2 GW of SPE [9]. This fact could not be a piece of good news since Indonesia has an important role in reducing greenhouse emissions. As the top fourth (4th) of the largest population with 279 million people [10]. the successful energy transition to RNE in Indonesia could provide a significant change to the global environment. Furthermore, Indonesia contributes approximately 36% of energy production which includes the energy coming from fossil and RNE resources in ASEAN [11]. In the case of SPE facts, Indonesia has a very high potential for SPE resources due to its advantageous geographical location. The Global Horizontal Irradiance (GHI) of Indonesia is around 4.2 kWh/m2 to 5.0 kWh/m2 which could produce approximately 3.4 kWh/kWp to 4.0 kWh/kWp of Solar Photovoltaic Electricity (SPE) [12].
The Government of the Republic of Indonesia (GORI) has planned several strategies to enhance RNE and SPE development. The GORI has published the National General Electricity Plan where the share of RNE was targeted to 23% of Indonesia's total energy generation mix by 2025 [13]. However, the progress is little where IRENA has published the total RNE energy mix coming from RNE only produced 10,554 Megawatts (MW) or 12.2% [14] whereas SPE source only contributed 0.078% or 1.89% from the report published by the Institute of Essential Services Reform (IESR) [9].
The target of 23% of the energy mix from RNE seems impossible to achieve in 2025 but the GORI has another plan. The GORI put a goal on the SPE development to achieve 3.6 GW of the SPE by 2025 comprising the Rooftop Photovoltaic Plant (RPP), large-scale or commercial Photovoltaic Plant (LCPP), and floating Photovoltaic Plant (FPP) [15]. The target of 3.6 GW could be possible since IESR estimates the RPP in the capital cities of Jakarta and Surabaya could contribute approximately 2 GWp of SPE Alone [16]. Considering other cities in Indonesia, the target could be reached by only applying the RPP in the city's residential markets.
To achieve the target of 3.6 GW of the SPE in RNE Mix in 2025, the GORI has implemented the Ministerial Regulation of the Minister of Energy and Mineral Resources (MEMR) No 49/2018 and which regulates the Use of Rooftop Solar Power Generation Systems by Consumers of PT. Perusahaan Listrik Negara. The regulation specifies the export-import (E-I) scenario where PT. PLN could purchase the exceed of electrical production of RPP by giving the subsidy which could be an additional income for the owner of RPP System. However, only 65% of electrical exceed could be claimed as a subsidy which seems not to optimally stimulate the growth of the SPE development. Therefore, the GORI revises the MEMR No. 49/2018 by publishing the new MEMR No. 26/2021 which could cover the electrical exceed and provide a 100% subsidy to the owner of RPS. However, MEMR No. 26/2021 has been delayed temporarily by the House of Representatives of the Republic of Indonesia to ensure the impact of implementing the MEMR on subsidies and compensation in the State Revenue and Expenditure Budget [15]. Therefore, the MEMR No 26/2021 has been implemented since the beginning of 2022. On the other hand, there is no comprehensive study that explores the effect of new regulations or compares two regulations from the techno-economic perspective. This information is important to see how much the economic advantages are offered in the new MEMR.
The present study aims to do the techno-economic analysis of the implementation of two MEMRs about the Export-Import Subsidies of RPP in Indonesia. The study is focused on answering how much economic shifts have been made by forming a new regulation related to E-I subsidies in the RPP. The study began with investigating the number of SPE potential in the studied area and how much investment is needed. It is important to ensure that the energy cost does not exceed the cost of electricity in Indonesia. Furthermore, the economic analysis will use four scenarios that have been designed to mimic the MEMR 49/2018 with 65% E-I scenarios and the MEMR 26/2021 with 100% E-I scenarios. Two additional scenarios were added between 65% and 100% E-I scenarios to provide a better understanding of economic shifts as the function of E-I scenarios. The study could provide a better understanding and initial assessment about how the growth of PV investment in Indonesia will be in the future The result could provide important information, especially for the people who want to invest in the RPP about how profitable the SPP and the risky level of investing RPP.
2.1 The simulating location
The present study uses the region of the Ogan Komering Ulu (OKU), South Sumatera, Indonesia as the simulating location. The OKU region has the geographical coordinates of 4.0283°S and 104.0072°E. The capital city of the OKU district is Baturaja and located by the primary artery road of the province of South Sumatra. The main reason to choose the OKU regency is to change the background of the OKU regency which is known as the energy barn of Indonesia since there are several coal-based mining industries located in Indonesia. By giving a comprehensive study related to green energy in the OKU regency, the OKU regency could not be known not only as the fossil-based energy barn but also as the green energy barn in Indonesia. On the other hand, most of the RPP development is focused on the capital city where the regency-based city and remote areas are not well investigated. Thus, the present study could provide a different perspective on technoeconomic analysis in the capital of regency. The result could be valuable information and has originality for the local government of the OKU region and the stakeholders to understand the potential of the SPE in the region of the OKU.
2.2 Assessing the global horizontal irradiation (GHI) and energy simulated production
Assessing the GHI began the present study where the GHI represents the potential of the SPE in the studied area. The GHI was assessed using the PVsyst software which was developed at the University of Geneva, Switzerland [6]. The PVsyst has been used widely to simulate the PV system analysis and has been accepted by the Government, International Banks, and Academic Institutions to predict, design, and implement the PV system [6]. There were 13 locations used in the region of the OKU administrative area shown in Figure 1. Each location represented each district in the OKU region area where the sampling points were in the center of the village area.
To calculate the number of energy production, the rooftop photovoltaic plant (RPP) was used as the simulation of the SPE harvesting in the studied area. The nominal rating of RPP was designed for most of the residential housing size of Indonesia which was around 45-100 m2 [17] with a nominal rating of 4800 Watts. To support the nominal rating, 16 units of Jinkosolar JKM 300M-60-V module are used. To support the modules, the rooftop area needs at least 27 m2 size with a specific tilt angle of the roof around 10 degrees as the optimum tilt angle in Indonesia [18]. There is no specific design of RPP as sunlight irradiation is considered the same level at all modules. To ensure the RPP model implements the regulation of the MEMR, the RPP is related to the grid system managed by PT. Perusahaan Listrik Negara or abbreviated as PLN. Furthermore, the SolarEdge SE4K-EU-APAC was used as an inverter to convert the direct current (DC) to alternating current (AC).
Figure 1. 13 Sampling Point of GHI Assessment in the region of the Ogan Komering Ulu: (1) West Baturaja, (2) East Baturaja, (3) Lubuk Raja, (4) Lubuk Batang, (5) Muara Jaya, (6) Peninjauan, (7) Sosoh Buay Rayap, (8) Ulu Ogan, (9) Sinar Peninjauan, (10) Semidang Aji, (11) Pengandonan, (12) Lengkiti, (13) Kedaton Peninjauan Raya
2.3 Economic analysis of rooftop photovoltaic plant (RPP) model
The economic analysis aims to evaluate the RPP implemented by the two MEMR Regulations. The goals are to see if the Regulations offer economic feasibility that could trigger the investors or people in Indonesia to invest in the RPP. The detail of economic analysis will be described in detail.
2.3.1 Investment and energy cost analysis
In this study, the investment analysis began with the economic analysis of RPP where three (3) parameters were considered: The Capital Expenditure (CAPEXpv), The Operating Expenditure (OPEXpv), and The Levelized Cost of Energy (LCOE). The CAPEXpv counts how much the investment of 4800 Watts RPP costs. The CAPEXpv includes the cost of buying the PV modules Cmod, the inverter Civt accessories and tools Ct, cost of installation Cist, insurance cost during the installation and delivery Cisr, and tax Ctax. All the price was based on the present market and could be changed over time. The detail of the CAPEXpv calculation is shown in Eq. (1).
$\begin{gathered}C A P E X_{p v}=C_{\text {mod }}+C_{i v t}+C_t+C_{i s t}+C_{i s r} +C_{\text {tax }}(i)\end{gathered}$ (1)
Furthermore, the study analyzed the annual OPEXpv which specifies the Operating and Maintenance (O&M) and the labor costs. The OPEXpv is generally set up to 5% of the CAPEXpv [19, 20]. However, the present study considered a cheaper labor and maintenance cost in the first year to suppress the OPEXpv based on the data in Indonesia. Thus, the OPEXpv was set to 1% of CAPEXpv shown in Eq. (2) which is in accordance with the one reported by a previous study [19]. However, there would be an adjustment cost of OPEXpv annually which the annual OPEXpv price increase was up to 5% annually to cover any financial change during the production period.
$O P E X_{p v}=1 \% C A P E X_{p v}$ (2)
To last investment and energy analysis is the Levelized Cost of Electricity (LCOE) which presents the electricity price generated by the proposed RPP. The LCOE plays a role in determining the financial viability of RNE technologies [20]. The LCOE could be calculated using several ways [21-23]. However, the main idea of calculating the LCOE was to estimate the cost to produce the present electricity over its lifetime production. Thus, we develop Eq. (3) to show the way to calculate the LCOE of RPP for the lifetime period of 25 years [6, 21].
$L C O E=\frac{\sum_{t=1}^n \frac{1+(O P E X p v) t}{(1+r)^t}}{\sum_{t=1}^n \frac{E_t}{(1+r)^t}}$ (3)
where, n refers to the production period (25 years); r equals the discount rate where the present study uses 8% of the discount rate based on the one reported by previous study [24], and t is the year of production.
2.3.2 Economic analysis
The further economic analysis in this section aims to evaluate the E-I electricity regulation as the function of the RPP implementation in Indonesia. There are two main regulations: (1) The MEMR No. 49/2018 Concerning the Uses of Rooftop Solar Electricity Systems by the Consumer of State Electricity Company or PT. Perusahaan Listrik Negara (abbreviated as PT. PLN) and (2) The MEMR No. 26/2021 Concerning the Rooftop Solar Electricity System Connected to Electricity Grid of Holders of Electricity Supply Business License for Public Interest. In general, those two regulations have different regulations about the E-I scenarios where the MEMR No. 49/2018 allows 65% of export-import coverage of RPP while the MEMR No. 26/2021 could fully cover 100% of the E-I electricity of RPP. Therefore, the difference could provide the economic difference which is further analyzed by five (5) most used economic analysis parameters: Net Present Value (NPV), Internal Rate of Return (IRR), Net Benefit Cost Ratio (Net B/C), Return on Investment (ROI), and Payment Back Period (PBP). The detailed calculation for each economic parameter is shown in Eqs. (4)-(8).
$N P V=\frac{(\text { Benefit-Cost })}{(1+r)^n}$ (4)
$\sum\left[\frac{C}{(1+r)}\right]^n=\sum\left[\frac{B}{(1+r)}\right]^n$ (5)
Net $\frac{B}{C}=\frac{\text { Present Value of Benefits PVV }}{\text { Present Value of Cost PV }}$ (6)
ROI $=\frac{\text { Present Return }}{\text { Present Cost }}$ (7)
$P B P=T-1+\frac{\sum_{i=1}^{T-1}(B-C)}{(B-C)_T}$ (8)
where, n refers to the production period where in this study, the production period was limited to 25 years old based on the module performance lifetime warranty [25]; r equals the discount rate where the present study uses 8% of the discount rate based on the one reported by previous study [24]; and T is the first year after the cumulative profit equals to zero (start gaining profit).
To provide an overview of how the E-I scenarios affect the economic analysis, all the production of RPP would be sold to PT. PLN with a specific assumption is shown in Table 1. To compare the E-I scenarios, the present study uses four (4) scenarios of the E-I started by 65% (S1), 70% (S2), 80% (S3), and 100% (S4) to test the sensitivity of the RPP.
Table 1. General assumptions of economic analysis
|
Parameters |
Details |
|
First-year Feed-in Tariffs |
IDR1.450 per kWh |
|
Annual Tariff Adjustments |
6% per year |
|
Fixed Annual Interest |
8% [24] |
|
Annual Income Tax Rate |
15% [26] |
|
Project Lifetime Period |
25 years |
|
Source of Funding |
Private Sectors/Bank Loan |
|
Production Depreciation |
1% per year |
3.1 Global horizontal irradiation
In general, 13 sampling points show a similar amount of SPE potential shown in Figure 2. The average GHI was approximately around 4.8 kWh/m2 where the highest GHI was found in the district of Muara Jaya (5.15 kWh/m2) followed by Pengandonan (5.10 kWh/m2), Ulu Ogan (5.08 kWh/m2), and Lengkiti (5.05 kWh/m2) where all the highest GHI located in the Southwest and South part of OKU regency. Talking about the GHI in a year, the GHI in all 13 sampling locations formed a similar pathway where the highest GHI was found in April at the beginning of the dry season in Indonesia. Since Indonesia only has two seasons, the lowest GHI was found in the wet season starting from December to January as the peak of the wet season. Furthermore, the result of GHI was quite like the reports by references where the GHI of the studied area was in the range of 4.4 - 5.0 kWh/m2 [12, 27].
Assessing the GHI of the studied area confirmed that Indonesia has a high potential in developing SPE. The variation of GHI in each sampling point could provide a different SPE potential. However, the difference between each sampling point is quite low where the difference could be negligible. Furthermore, the SPE potential in the study area is high compared to the general GHI in Indonesia which is around 4.4 - 5.0 kWh/m2 [12, 27]. The high potential of SPE in the studied area is in accordance with the plan of GORI to choose SPE as the highest-targeted source of RNE in Indonesia. The SPE could contribute up to 47% alone of RNE with the electrical power capacity reached to 207.8 Gigawatts (GW) [13].
3.2 Energy production of Rooftop Photovoltaic Models (RPVM)
The RPP models consist of 16 modules using a Poly-crystalline solar panel by Jinkosolar with a specific power rate of 300 W per module. The optimization of the system was done by the PVsyst software with the output of the system including Energy Output and Loss shown in Table 2.
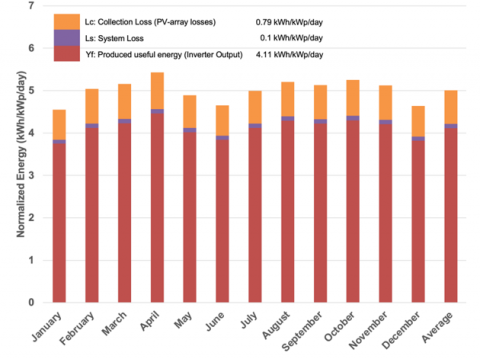
In Table 2, the proposed RPP model could produce up to 7,200 kilo-watts hour (kWh) of total RNE annually with 1501 kWh/kilo-watts peak (kWp) of annual electrical production. The total energy has exceeded the average electrical consumption of Indonesia's Residences where the average electrical consumption in Indonesia is around 1.06 MWh in 2020 or 1.173 MWh in 2022 [28]. Thus, the RPP could ideally supply the electrical consumption of a household in Indonesia in general. The electrical supply of RPP would be stable every month since Indonesia has geographical advantages located in the equator area with high sunlight exposure every day of the year. Figure 3 shows the electrical production of RPP in every production month.
Table 2. Energy production and system loss
|
Parameters |
Details |
|
Energy Production |
|
|
Global Plane Irradiation |
1838 kWh/m2 |
|
Global Plane Irradiation |
1776 kWh/m2 |
|
Annual Energy Output |
7210 kWh/year |
|
Annual Electricity Production |
1501 kWh/kWp |
|
System Loss |
|
|
Global Incidence in Coll. Plane of the Array |
-0.61% |
|
PV loss due to Irradiance Level |
-0.57% |
|
PV loss due to Temperature |
-11.17% |
|
Ohmic Wiring Loss |
-0.77% |
|
Inverter Loss |
-2.37% |
Figure 2. The global horizontal irradiance of 13 sampling points in the Ogan Komering Ulu Region
In technical details, the RPP could still have some losses where Table 2 showed that the highest losses wer coming from temperature loss. The temperature loss could be the ambient temperature or the cell temperature which further affects the performance of the PV modules. The average ambient temperature in Indonesia is around 28℃ with the max ambient temperature reaching 36.3℃ [29]. The ambient temperature in Indonesia (Average and Max Temp) has exceeded the tested temperature of the PV cell which is around 25℃. Thus, the ambient temperature could provide an effect on the RPP installed in Indonesia.
Figure 3. The normalized electrical production of simulated Rooftop Photovoltaic Plant (RPP) system
The other potential temperature loss comes from the internal cell temperature. The cell temperature was gained from the unconverted radiation adsorbed by the cell which further raised the internal temperature of the PV module. Both ambient and internal temperatures at a high-level could lower the efficiency by increasing the internal carrier recombination rate which further lowers the amount of electricity produced [7]. Studies showed that PV panels have a better performance and lifetime period with a cooling process applied [30, 31]. The other option to prevent temperature loss is by designing Floating-Photovoltaic Plant (FPV) [32]. The FPV could have the direct colling system since the module is in the water surface. However, the FPV is designed for the large-scale PV system where it could not be applied in the residential PV system.
The other considered losses on RPP were Inverter Loss due to Active and Reactive Power, Conduction, Switch, and Stray Losses [33] and some other technical losses such as internal losses (IAM factor on global), Irradiance level PV loss due to light penetration, and Ohmic wiring losses (see Table 2). To prevent the inverter and accessories-based losses, the high capacity and high technology inverter could provide a high efficiency conversion from direct current to alternating current [34].
3.3 Economic analysis
The CAPEXpv of RPP was approximately IDR. 81.150.000 with the cost details shown in Table 3. Based on the CAPEXpv and the installed power capacity, the value of PV investment per watt of RPP was around IDR 16,900 (USD 1.13 with an exchange rate of IDR 14.956). Modules and Inverter still cost the highest investment where approximately 75% of RPP investment comes from the module and inverter costs. However, the investment cost of RPP was half price compared to the investment cost in the United States where the RPP per watts of power cost around USD 2.71 per watts [35].
The OPEXpv of RPP in the present study was cost around IDR. 8.150.000 in the first year with an annual tax adjustment of around 5%. Most of the owners of RPP would use a third party such as a technical or private company to do the O&M of the RPP. In general, the OPEXpv tends to offer medium to large-sized photovoltaic models with a minimum capacity of around 500 kilowatts of power generated. The main reason is most of the owners do not have the resources to operate and maintain the RPP or the owner is not ready to make a long-term capital investment in RPP [36]. However, the present study adds the OPEXpv as the option to estimate the capital investment on the RPP.
The levelized cost of electricity of RPP was shown in Table 3. The LCOE of RPP cost IDR. 1335.8 (USD 0.089 or 8.9 cents) per kWh which is lower than the feed-in tariff used in the present study. The LCOE obtained in the present study is in accordance with the one reported by IESR [37]. Indonesian Power, a company that focused on RNE, believes that the LCOE of RPP could be suppressed to 3.7 cents per kWh [38]. The lower LCOE could be reached in the future because of the cheaper PV modules and inverters.
Table 3. Investment and cost output
|
Parameters |
Details |
|
CAPEXpv |
|
|
PV Modules and Supports |
IDR. 32 Million |
|
Inverters |
IDR. 28.5 Million |
|
Wiring and PV Accessories |
IDR. 4 Million |
|
PV Module and Inverter Installations |
IDR. 5 Million |
|
Delivery and Installation Insurance |
IDR. 2 Million |
|
Building Insurance |
IDR. 2.5 Million |
|
Purchasing Tax (10%) |
IDR. 7.15 Million |
|
OPEXpv |
|
|
1% CAPEXpv |
IDR. 8.150 Million |
|
Levelized Cost of Energy |
|
|
LCOE |
IDR. 1335.8 |
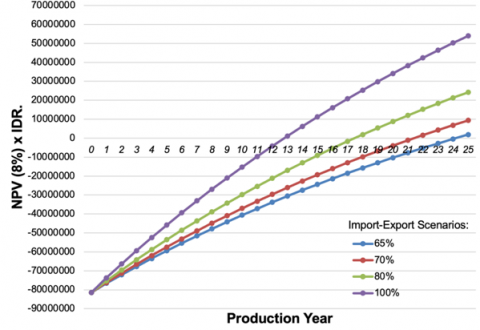
Five economic parameters were used in the present study. Figure 4 shows the Net Present Value (NPV) of the RPP with the different four (4) scenarios. In general, all the scenarios obtained a positive NPV meaning that all scenarios provide profitability or form a good value of investment. To be more specific, the main difference was the year when the RPP started gaining profit. S4 scenarios would produce the positive NPV after the twelfth (12th) years of production time which was the almost half period of RPP lifetimes. The result could be a simple math, but it could mean that revising the E-I scenarios to 100%, could make the RPP less risky compared to the other E-I scenarios. In comparison, the first scenario (S1) would not gain any interest since it generates the lowest NPV. By revising the E-I scenario from 65% to 100%, the NPV rises from IDR. 1.8 million (S1) to IDR. 53.9 million (S4).
The result of the NPV also supports the other four economic parameters shown in Table 4. The highest NPV generated by the scenario by MEMR No. 26/2021 was obtained from the highest improvement in Net B/C value and ROI of the fourth scenario (S4). The revision of E-I from 65% to 100% improves the value of Net B/C and ROI to approximately 63% and 21.3%, respectively. The result showed that the owner of RPP could still return more than half investment at the end of production.
Figure 4. Net present value of four (4) scenarios of export-import subsidies of rooftop photovoltaic plant in Indonesia
Table 4. Economic and sensitivity test
|
Economic Analysis |
Scenarios |
|||
|
S1 |
S2 |
S3 |
S4 |
|
|
IRR |
8.22% |
9.05% |
10.61% |
13.47% |
|
Net B/C |
1.02 |
1.11 |
1.30 |
1.66 |
|
ROI (%) |
29.62 |
32.67 |
38.76 |
50.96 |
|
PBP |
10.14 |
10.05 |
9.91 |
9.72 |
However, the IRR and PBP showed a slight improvement whereas the PBP showed the lowest effect on the E-I change. The route improvement of IRR values for each scenario is in accordance with the NPV result where the RPP provides an economic advantage since the IRR value of each scenario performs a value larger than 8% or larger than the interest rate of any bank in Indonesia [24]. This means that the RPP could provide additional profitability compared to depositing the same amount of money in any bank in Indonesia.
In terms of PBP, there is no significant difference between each scenario where the PBP is only short for a couple of months by changing the E-I scenario. The PBP was a half-time period of lifetime production indicating the RPP investment was less risky and regarded as appropriate for investment [6]. In the economic conclusion, the result confirmed that by revising the MEMR No. 49/2018 to the MEMR No. 26/2021 could provide a high improvement and advantages from the economic point of view especially the NPV, Net B/C, and ROI.
Techno-economic analysis of RPP based on two Ministerial Energy and Mineral Resource have been successfully made. The result in technical details demonstrated that SPE in the studied area is high and RPP could be an ideal technology to supply the daily electrical demand of society in all production years. In economic details, the changes in the regulation about RPP from MEMR from 49/2018 to MEMR 26/2021 about Export – Import Subsidies made a huge difference since the new MEMR provided a better economic advantage such as positive NPV which made RPP become the less risky project. The other advantages are the high improvement in Net B/C and ROI where the improvement is 63% and 21.3%, respectively, compared to the condition with MEMR 49/2018. However, IRR and PBP are slightly improved by changing the new regulation on E-I scenarios. The economic analysis also showed that RPP could provide better profitability compared to depositing the same amount of money in any bank in Indonesia. The result confirmed that the investing in RPP is profitable and less risky project and performing new regulation of MEMR 26/2021 is a smart movement from GORI to stimulate the growth of green energy in Indonesia. Furthermore, the financial regulation such as bankable investment regulation and green investment mechanism should be made as soon as possible to provide a financial pathway for the people in Indonesia to actively participate in the RPP investment. On the other hand, the creative and effective dissemination should be made to ensure everyone knows the advantages of transitioning energy from fossil-based energy to green energy. The combination between good regulation and implementation could make the target of 3.6 GW of SPE in RNE Mix in 2025 possible.
The authors express gratitude to the Department of Energy and Mineral Resources of South Sumatra for granting access to conduct the research.
[1] International Energy Agency, Renewables global energy review 2021. (2022). https://www.iea.org/reports/global-energy-review-2021/renewables.
[2] OurWorldinData, World renewable energy generation from 1965 – 2021. (2021). https://ourworldindata.org/- renewable-energy.
[3] OurWorldinData, Solar power generation 1965 – 2022. (2022). https://ourworldindata.org/grapher/solar-energy-consumption.
[4] Duman, A.C., Güler, Ö. (2020). Economic analysis of grid-connected residential rooftop PV systems in Turkey. Renewable Energy, 148: 697-711. https://doi.org/10.1016/j.renene.2019.10.157
[5] NREL (National Renewable Energy Lab), Documenting a Decade of Cost Declines for PV Systems, Technical Report, National Renewable Energy Laboratory. (2021). https://www.nrel.gov/news/program/2021/documenting-a-decade-of-cost-declines-for-pv-systems.html.
[6] Ozcan, O., Ersoz, F. (2019). Project and cost-based evaluation of solar energy performance in three different geographical regions of Turkey: Investment analysis application. Engineering Science and Technology, an International Journal, 22(4): 1098-1106. https://doi.org/10.1016/j.jestch.2019.04.001
[7] Dubey, S., Sarvaiya, J.N., Seshadri, B. (2013). Temperature dependent photovoltaic (PV) efficiency and its effect on PV production in the world–A review. Energy Procedia, 33: 311-321. https://doi.org/10.1016/j.egypro.2013.05.072
[8] IRENA (International Renewable Energy Agency), Top 10 countries/areas by solar electricity capacity in 2022. (2023). https://www.irena.org/Data/view-data-by- topic/Capacity-and-Generation/Country-Rankings.
[9] Hasjanah, K. (2023). What is solar energy and how is it developed in Indonesia, technical report, institute energy and services reform. https://iesr.or.id/en/what-is-solar-energy-and-how-is-it-developed-in-indonesia.
[10] United States Census Bereau, World population. (2023). https://www.census.gov/popclock/print.php?com- ponent=coun.
[11] Reyseliani, N., Purwanto, W.W. (2021). Pathway towards 100% renewable energy in Indonesia power system by 2050. Renewable Energy, 176: 305-321. https://doi.org/10.1016/j.renene.2021.05.118
[12] Global Solar Atlas, Atlas of Indonesia. (2022). https://globalsolaratlas.info/download/indone.
[13] Kementerian Energi dan Sumberdaya Mineral, Rancangan umum energi nasional. (2017). https://www.esdm.go.id/assets/media/content/content-rencana-umum-energi-nasional-ruen.pdf.
[14] IRENA (International Renewable Energy Agency), Renewable Energy Statistics 2021, Technical Report, International Renewable Energy Agency. (2021). https://www.irena.org/publications/2021/Aug/Re-newable-energy-statistics-2021.
[15] Directorate General of New Renewable Energy, E. Conservation, Aim for the installed capacity of 3.6 gw, these are a series of advantages of rooftop photovoltaic development. (2021). https://ebtke.esdm.go.id/post/ 2021/08/26/2945/bidik.kapasitas.terpasang.36.gw.ini.se- deret.keuntungan.pengembangan.plts.atap.
[16] Julian, M., Rahmawati, W. (2022). ESDM: Penundaan per-men PLTS atap bukan untuk ditinjau ulang atau di-batalkan. Technical Report, Kontan News. https://industri.kontan.co.id/news/esdm-penundaan-permen-plts-atap-bukan-untuk-ditinjau-ulang-atau-dibatalkan.
[17] Badan Pusat Statistik, Persentase rumah tangga menurut provinsi dan luas lantai (m2) (persen), 2015-2021. (2022). https://www.bps.go.id/indicator/152/138/1/pers-entase-rumah-tangga-menurut-provinsi-dan-luas-lantai-m2-.html.
[18] Darussalam, R., Rajani, A., Kusnadi, K., Atmaja, T.D. (2016). Pengaturan arah azimuth dan sudut tilt panel photovoltaic untuk optimalisasi radiasi matahari, studi kasus: Bandung €“Jawa Barat. Prosiding Seminar Nasional Fisika (E-Journal), 5: SNF2016-ERE. https://doi.org/10.21009/0305020606
[19] Asante, K., Gyamfi, S., Amo-Boateng, M. (2023). Techno-economic analysis of waste-to-energy with solar hybrid: A case study from Kumasi, Ghana. Solar Compass, 6: 100041. https://doi.org/10.1016/j.solcom.2023.100041
[20] Sommerfeldt, N., Pearce, J.M. (2023). Can grid-tied solar photovoltaics lead to residential heating electrification? A techno-economic case study in the midwestern US. Applied Energy, 336: 120838. https://doi.org/10.1016/j.apenergy.2023.120838
[21] Weinand, J.M., Hoffmann, M., Göpfert, J., Terlouw, T., Schönau, J., Kuckertz, P., McKenna, R., Kotzur, L., Linßen, J., Stolten, D. (2023). Global LCOEs of decentralized off-grid renewable energy systems. Renewable and Sustainable Energy Reviews, 183: 113478. https://doi.org/10.1016/j.rser.2023.113478
[22] Eltamaly, A.M., Mohamed, M.A. (2018). Optimal sizing and designing of hybrid renewable energy systems in smart grid applications. Advances in Renewable Energies and Power Technologies, pp. 231-313. https://doi.org/10.1016/B978-0-12-813185-5.00011-5
[23] Wang, Y., Gao, M., Wang, J., Wang, S., Liu, Y., Zhu, J., Tan, Z. (2021). Measurement and key influencing factors of the economic benefits for China’s photovoltaic power generation: A LCOE-based hybrid model. Renewable Energy, 169: 935-952. https://doi.org/10.1016/j.renene.2021.01.028
[24] Badan Pusat Statistik, Suku bunga kredit rupiah menurut kelompok bank 2023. (2023). https://www.bps.go.id/indicator/13/383/1/suku-bungakredit-rupiah-menurut-kelompok-bank.html.
[25] Tan, V., Dias, P.R., Chang, N., Deng, R. (2022). Estimating the lifetime of solar photovoltaic modules in Australia. Sustainability, 14(9): 5336. https://doi.org/10.3390/su14095336
[26] Undang-Undang, Undang - undang no 7 tahun 2021 tentang harmonisasi peraturan perpajakan. (2021). https://peraturan.bpk.go.id/Home/Details/185162/uuno-7-tahun-2021.
[27] Silalahi, D.F., Blakers, A., Stocks, M., Lu, B., Cheng, C., Hayes, L. (2021). Indonesia’s vast solar energy potential. Energies, 14(17): 5424. https://doi.org/10.3390/en14175424
[28] Ahdiat, A. Konsumsi listrik penduduk indone-sia naik pada 2022, capai rekor baru. (2023). https://databoks.katadata.co.id/datapublish/2023/02/23/konsumsi-listrik-penduduk-indonesia-naik-pada-2022-capai-rekor-baru.
[29] dan Geofisika, B.M.K. (2023). Ifs daily maximum temperature forecast. https://web.meteo.bmkg.go.id/id/model-prediksicuaca/nwpparametercuaca/temperature/maximum-temperature.
[30] Ebhota, W.S., Tabakov, P.Y. (2023). Influence of photovoltaic cell technologies and elevated temperature on photovoltaic system performance. Ain Shams Engineering Journal, 14(7): 101984. https://doi.org/10.1016/j.asej.2022.101984
[31] Boduch, A., Mik, K., Castro, R., Zawadzki, P. (2022). Technical and economic assessment of a 1 MWp floating photovoltaic system in Polish conditions. Renewable Energy, 196: 983-994. https://doi.org/10.1016/j.renene.2022.07.032
[32] Maraj, A., Kërtusha, X., Lushnjari, A. (2022). Energy performance evaluation for a floating photovoltaic system located on the reservoir of a hydro power plant under the mediterranean climate conditions during a sunny day and a cloudy-one. Energy Conversion and Management: X, 16: 100275. https://doi.org/10.1016/j.ecmx.2022.100275
[33] Grab, R., Hans, F., Flores, M. I. R., Schmidt, H., Rogalla, S., Engel, B. (2022). Modeling of photovoltaic inverter losses for reactive power provision. IEEE Access, 10: 108506-108516. https://doi.org/10.1109/ACCESS.2022.3213272
[34] Huda, A., Kurniawan, I., Purba, K.F., Ichwani, R., Fionasari, R. (2024). Techno-economic assessment of residential and farm-based photovoltaic systems. Renewable Energy, 222: 119886. https://doi.org/10.1016/j.renene.2023.119886
[35] National Renewable Energy Laboratory, U.S. solar photovoltaic system and energy storage cost benchmark: Q1 2020. (2021). https://www.nrel.gov/docs/fy21osti/77324.pdf.
[36] Nithin, T. Capex or opex - ways to finance rooftop solar systems and realize huge savings. (2020). https://www.mercomindia.com/capex-opex-financerooftop-solar.
[37] I. for Essential Services Reform, Levelized cost of electricity in Indonesia (understanding the levelized cost of electricity generation). (2019). https://iesr.or.id/wp-content/uploads/2020/01/LCOE-Full-Report-ENG.pdf.
[38] PV-Magazine, Large scale floating PV to sell power at $0.0368/kWh in Indonesia, Technical Report, PT. Indonesian Power. (2020). https://www.pv-magazine.com/2021/01/28/large-scale-floating-pv-to-sell-power-at-0-0368-kwh-in-indonesia/.