Tri Siwi Nugrahani*![]() | Hadri Kusuma
| Hadri Kusuma![]() | Johan Arifin
| Johan Arifin![]() | Rifqi Muhammad
| Rifqi Muhammad![]()
© 2023 IIETA. This article is published by IIETA and is licensed under the CC BY 4.0 license (http://creativecommons.org/licenses/by/4.0/).
OPEN ACCESS
Sustainability Reporting (SR) is a report containing economic, social, and environmental information, mandatory for public companies in Indonesia since the issuance of POJK regulation Number 51/POJK.03/2017. However, not all companies prepare SRs, and many do not focus on the determinants of SR quality, resulting in substandard reports. This study examines the determinants of SR quality using the institutional isomorphism theory approach. The research hypothesis posits that SR quality is influenced by CSR disclosures (economic, social, and environmental), creditor pressure, pressure from industry groups, government pressure, and the diffusion of shareholding structures (both high- and low-based) influences SR quality. The research sample consists of 305 public companies in Indonesia listed on the IDX during 2017-2020. Data were analyzed using content analysis and Multivariate Regression. The study results indicate that almost all hypotheses were confirmed to impact SR quality, except for government pressure, which is not supported due to the relatively small government share ownership, rendering it ineffective. The study also finds that the diffusion of shareholding structures, both high and low, can influence SR quality. On average, the quality of SR among public companies in Indonesia is 64.5% in the medium category, suggesting that companies are disclosing SR information in accordance with the POJK provisions and considering the principles of relevance and reliability, thereby making SR useful for decision-making.
quality sustainability report, public companies in Indonesia, isomorphism
A Sustainability Report (SR) is a company report that serves as a form of compliance to disclose economic, social, and environmental activities [1]. The preparation of SRs is crucial for every public company, particularly in Indonesia, as it aids the government in devising a sustainable financial roadmap through sustainable development programs. Currently, there is still a debate over whether SRs should be mandatory or voluntary [2]. A well-prepared SR should adhere to the guidelines set by the Financial Services Authority Regulation (POJK) Number: 51/03/2017, detailed in Chapter 4, Article 10, paragraph 1, on pages 10-11. The definition of a Sustainability Report is given in Article 1, paragraph 13, on page 6, which reads:" Sustainability Report (SR) is a report announced to the public which contains the economic, financial, social and environmental performance of a Lembaga Jasa Keuangan (LJK), issuers, and public companies in running a sustainable business" [3].
Based on observations and attention to the results of previous SR studies in Indonesia, it is evident that many public companies in Indonesia do not follow the POJK guidelines when preparing SRs, opting instead for other guidelines such as those from the GRI [2, 4, 5]. This deviation makes the effectiveness of the regulations less apparent. Nevertheless, companies that have prepared SRs should be commended for supporting sustainable development policies [6, 7], particularly with regard to the creation of a sustainable financial roadmap. According to a 2021 Deloitte survey of CEOs in Indonesia, 89% agree that their companies prepare SRs to comply with government regulations [8].
Assessing the quality of SRs is crucial due to the discrepancy between expectations and the actual preparation of SRs. The 2020 NCSR survey results indicate that only 44 Indonesian companies were listed in the Asia Sustainability Report Rating (ASRRAT), which is a modest figure in comparison to the overall number of public companies in Indonesia, particularly those that rank in the Asian class [9]. In 2022, out of the 50 companies participating in ASRRAT, 10 were from Indonesia, signifying an improvement. However, this represents a mere 5.33% of the companies registered on the IDX in 2022 [10]. Additionally, a PricewaterhouseCoopers (PwC) survey revealed that of the top 100 companies listed on the IDX, only 55 had published SRs in 2021 [11]. Since the enactment of SR preparation regulations, there has been an increase in the number of SRs, a trend also observed in other regions following the implementation of policies like the Directive 2014/95/EU in European countries [12, 13], in India [14], Malaysia [15, 16], and elsewhere. These instances demonstrate that regulations are influential in promoting the preparation of SRs. Nonetheless, it is also vital to ensure the substance of SRs so that their preparation transcends mere compliance and symbolism [17-19], which otherwise might result in reports that lack quality.
The quality gap in SRs arises when there is a mismatch between stakeholder expectations and company actions. For instance, shareholders typically desire a substantial return, whereas companies strive to optimize the variety of shares in circulation. Therefore, the company must carefully consider the composition of shares, which should not be classified merely by government and private shares [20], majority shares only [4, 5], public shares [21], or managerial shares [22]. The assessment of share types is often limited to the total percentage of shares without categorization into high and low groups; this approach does not reveal the company's efficiency, nor does it show whether the diffusion of the ownership structure affects the quality of the SR. This study addresses this gap by analyzing the diffusion of share ownership structures, categorizing share types into high and low, to ascertain the company's efficiency regarding share policy and its impact on the quality of SR.
A quality SR is one that is prepared in accordance with the guidelines and adheres to the principles of relevance and reliability [19]. The principle of relevance is associated with information that is timely, confirmatory, understandable, clear, comparable, predictive, and balanced, containing both positive and negative aspects. The principle of reliability encompasses materiality, completeness, and verifiability to minimize the error rate. If a company implements these principles of relevance and reliability when compiling SRs, the reports can be of high quality and serve as valuable tools for decision-making [23].
The preparation of SRs has not yet been able to convince investors to make decisions [24]. Furthermore, in preparing SRs, it is essential to consider the various expectations of stakeholders who exert pressure on the company, which, in turn, can influence the quality of the SRs. The discussion of SR quality, taking into account the determinants of SR quality, is most suitably approached using the theory of institutional isomorphism—including coercive, mimetic, and normative isomorphism [25]. This theory is relevant to accounting practices within organizations [26], which encompass organizational changes [27], including the practice of preparing quality SRs.
The preparation of a quality SR is inseparable from stakeholder pressure, which may originate from outside or within the company [4]. External stakeholder pressure, such as regulatory requirements for CSR disclosure—covering economic, social, and environmental aspects [19, 28, 29]—and creditor pressure [30, 31], can coercively isomorphically compel companies to prepare quality SRs. Government pressure, which can be indicated by state share ownership, also pushes companies to prepare SRs [32]. Additionally, industry groups exert external pressure because companies face environmental uncertainty and may not fully understand SR guidelines [2, 33]. In response to these challenges, companies might emulate other successful companies within their industry [34] or follow industry associations [4, 12], which can mimetically influence the quality of SRs.
Internal pressures that influence the quality of SRs include the diffusion of share ownership structures through normative isomorphism. Managers, as company leaders, have the authority to determine policies on the types and numbers of shares in circulation professionally and independently. These policies can reflect the spread or diffusion of share ownership structures, which in turn can impact the quality of SRs [24, 34], particularly when considering the high and low groupings of share ownership.
From the above explanation, it is evident that testing the quality of SRs in public companies in Indonesia is crucial. Questions to be addressed include the level of compliance of these companies with regulations, whether economic, social, and environmental CSR disclosure pressures affect SR quality, whether creditor and government pressures have an impact, and whether the diffusion of public share ownership structures affects SR quality.
The structure of this article is divided into several sections. Section 1 introduces the topic, while section 2 presents the literature review and hypothesis development. Section 3 describes the research method, and section 4 provides data analysis and discussion of the findings. The final section draws conclusions, outlines implications, and offers suggestions for future research.
2.1 Institutional isomorphism theory
This research adopts the institutional isomorphism theory approach because it elucidates the motivations behind the similarities in organizational forms and practices [26], as a process that constrains and induces one unit in a population to resemble others facing similar environmental conditions [25]. This theory also delineates how organizations align with stakeholder expectations and secure legitimacy from their environment, which is categorized into three mechanisms:
The pressure of isomorphism is exerted based on a mechanism that serves as a motivation in determining quality. The quality of SRs is assessed using a coercive isomorphism approach because regulatory requirements compel companies to develop SRs. Previous studies, such as the one by Khan et al. [19], evaluated the quality of SRs using institutional decoupling theory; however, this approach has limitations because the preparation of SRs must consider the alignment of expectations between stakeholders and the company to ensure that the reported SRs reflect reality. Similarly, Adaui's study [12] assessed the quality of SRs using institutional theory but did not examine it through the lens of isomorphism; thus, it failed to account for stakeholder motivation in determining SR quality. Consequently, this study investigates the quality of SRs by applying institutional isomorphism theory, which aligns with the motivations of stakeholders.
The application of the institutional theory of coercive isomorphism is also used to explain CSR disclosures, both economic, social, and environmental. Previous studies conducted by Khan et al. [19] and Adaui [12] explained CSR disclosure using institutional theory but not with isomorphism so it did not explain the role of regulatory pressure on CSR disclosure. Therefore, this study complements CSR testing by using a coercive isomorphism institutional theory approach.
CSR disclosure as part of the contents of POJK regulation Number 51/03/2017 emphasizes that SR at least contains information about the economy, society, and environment so that CSR testing is appropriate to carry out the theory of institutional isomorphism because POJK regulations force companies to disclose economic, social and environmental performance environment.
The difference between the concept of SR and CSR is in the content of SR which is carried out as a whole. The SR test contains various contents including SR disclosure compliance such as company profile, company strategy, disclosure of economic, social, and environmental performance, positive and negative impact aspects, and verification which in total consists of 71 items. Meanwhile, the CSR concept is only part of SR disclosure by focusing on economic performance consisting of 7 items, social performance consisting of 8 items, and environmental performance consisting of 8 items.
2.2 SR quality
SR quality is the disclosure of the SR which covers all aspects that must be included in the preparation of the SR by the provisions of POJK Number 51/03/2017. Previous research has tested the quality of SR, using GRI guidelines [2, 4, 5] even though Indonesia already has its own SR regulations, namely POJK. The preparation of SRs as a form of compliance with government regulations puts pressure on companies [36-38] which can force them to comply with the rules. According to the theory of institutional isomorphism in accounting practices in organizations or institutions [26, 39], it is necessary to pay attention to applicable regulations so that companies can adjust [27] the preparation of SRs [27] to be of high quality. Apart from that, in testing the quality of SR, it is necessary to ensure the content of the SR, including credibility, communication and content [12], and reliability [20]. According to Khan et al. [19], quality SR is SR that is prepared based on the principles of [19] relevance and reliability [19]. The principle of relevance means that SR can be used for decision-making according to report users [40], based on timeliness, confirmation, understandability, clarity, comparison, and having predictive and balanced value. In terms of reliability, SR must be comparable and credible [12] based on the reliability aspect, SR contains materiality, completeness, and accuracy [41].
2.2 The influence of CSR economic disclosure (X1) on SR quality
Economic CSR (X1), namely disclosure of the company's economic performance which contains information about economic activities and the company's concern for economic problems [3]. Disclosure of economic CSR is a coercive pressure of isomorphism because the provisions for disclosure of economic CSR are also contained in the POJK regulations. Economic CSR activities also include socio-economic-related activities [12, 42]. Economic CSR activities cannot be separated from disclosure of financial performance [43, 44]. Several previous studies have examined the influence of economic CSR on SR quality [12, 28, 29, 45, 46]. The research results show that economic CSR has a positive effect on SR quality. In terms of coercive isomorphism, economic CSR disclosure influences the quality of SR, so hypothesis 1 is as follows:
Hypothesis 1: Economic CSR with a coercive isomorphism approach has a positive effect on SR quality
2.3 The influence of CSR social disclosure (X2) on SR quality
Social CSR is the disclosure of company performance which includes social activities and the company's concern for social problems [3]. In social CSR disclosures, companies refer to activities related to social responsibility including information about employment opportunities, permanent employee remuneration, employee training, and other social activities that are considered moral obligations [47] and companies pay attention to issues related to social aspects [12], anti-corruption measures [48], public policies, and compliance aspects, which demonstrate that business processes have met stakeholder needs [49].
Compliance informs social CSR pressuring companies to prepare quality SRs. Several previous studies that have examined social CSR about to SR quality [42, 46, 49, 50] have proven that social CSR disclosure has a positive effect on SR quality. The higher the social disclosure, the higher the quality of SR, which means that regulatory pressure on social CSR disclosure coercively isomorphically influences the quality of SR.
Hypothesis 2: CSR social disclosure using a coercive isomorphism approach has a positive effect on SR quality
2.4 Effect of CSR environment (X3) on SR quality
Environmental CSR is the disclosure of company performance which includes environmental activities and awareness of environmental problems [3] including environmental sustainability [42]. Companies that disclose environmental CSR can increase the trust of investors and other stakeholders [51]. Several researchers have previously examined environmental CSR disclosure about SR quality [12]. Study results show that environmental CSR disclosure forces companies to prepare quality SR by paying attention to environmental costs [52]. According to the coercive isomorphism mechanism, environmental CSR disclosure can exert pressure on companies and influence corporate strategies [34] including SR quality. Based on this, hypothesis 3 is derived, namely:
Hypothesis 3: Disclosure of environmental CSR using a coercive isomorphism approach has a positive effect on SR quality
2.5 Effect of creditor pressure (X4) on SR quality
The quality of SR cannot be separated from the support of stakeholders, including creditors from outside the company. Creditors are one of the stakeholders who provide a source of company financing by lending funds to the company [31] so that creditors can pressure companies to prepare quality SRs [34]. Creditor pressure is the company's pressure because it receives the amount of funds from creditors to prepare a quality SR [32].
According to Eccles et al. [53], the more a company borrows funds from creditors, the greater the company's dependence on creditors, so creditors put pressure on the company. Creditors are measured in this study using leverage, namely the amount of debt divided by the company's total assets, as was done in previous studies [30]. Several previous studies have examined the influence of creditors on SR quality [30, 54-56]. The research results show that creditor pressure has a positive effect on SR quality. By the coercive mechanism, creditor pressure can influence companies to prepare quality SRs, so hypothesis 4 is proposed, namely:
Hypothesis 4: Creditor pressure using the coercive isomorphism approach has a positive effect on SR quality
2.6 The influence of industry association membership (X5) on SR quality
SR quality can also be determined by pressure from industrial groups because industries experience environmental uncertainty. Apart from that, industrial groups also experience difficulties in understanding SR guidelines, so in preparing SR companies imitate other companies according to their industrial group [25]. The definition of an industrial group is a company's participation in an industrial community [12, 57]. Several previous studies have examined the influence of industry groups on SR quality [12, 58, 59]. Environmentally sensitive companies or industries have better quality sustainability disclosures [57] as shown by several empirical tests [12, 60-62]. According to De Villiers and Alexander [34] when a company prepares an SR, the company feels unsure about the results achieved, so through mimetic isomorphism the company imitates other companies that are considered superior according to industry associations, thus affecting the quality of the SR. Therefore, hypothesis 5 is:
Hypothesis 5: Membership of an industry association with a mimetic isomorphism approach has a positive effect on SR quality
2.7 Effect of government pressure (X6) on SR quality
SR quality cannot be separated from government pressure which plays a role in supervising the running of the company. Government pressure is pressure on share ownership by the government which can indirectly be used to control company operations [63], meaning that the government normatively puts pressure on companies so that companies inform about SR-related activities transparent and credible manner so that SR is of high quality. Several researchers have previously examined government pressure regarding SR quality [31, 32, 64]. The research results show that government pressure has a positive effect on the quality of SR. By the normative isomorphism mechanism, the company's strategy in carrying out the company's operational success is one of the factors influenced by formal pressure [34], namely the government is one of the parties that can normatively influence the company to prepare a quality SR. Therefore, hypothesis 6 is proposed, namely:
Hypothesis 6: Government pressure with a normative isomorphism approach has a positive effect on SR quality
2.8 Effect of diffusion of share ownership structure (X7) on SR quality
Managers have professional policies in running the company, including determining the type and percentage of company shares. Several types of shares owned by a company are known as the diffuse share ownership structure or spread of company share ownership which shows information and accountability [20]. Several previous researchers have tested the diffusion of share ownership structures, but only on certain share ownership structures, namely government and private shares [20] or from public shares [21], while Arrokhman & Siswanto [65]; Qisthi and Fitri [5]; Rudyanto and Siregar [66] tested shares based on majority shares. Puspitaningrum and Atmini [67] tested the diffusion of shares with managerial shares while Singal and Putra [68]; Edison [69]; Marsinah [70]; Rustiarini [71] focused on the diffusion of institutional shares and Putri et al. [72] diffusion in foreign shares.
This study complements previous studies that never tested the diffusion of share ownership structures in high and low categories. This is a gap for researchers to examine the diffusion of share ownership structures because the level of diffusion of share ownership structures can influence the quality of SR [20]. Bohren et al. [73] tested the diffusion of share ownership structures by grouping majority and minority shares. The results of the study [73] show that the diffusion of share ownership structures can reduce stakeholder conflicts and can be used by managers for dividend payment policies and improve company reputation. Managers have the authority to determine the company's share structure using normative isomorphism [34] trying to maintain their professionalism by determining the type and percentage of share ownership which can influence the quality of SR. Therefore, it is stated that:
Hypothesis 7: Diffusion of share ownership structure using the normative isomorphism approach has a positive effect on SR quality
Several of the variables mentioned above are determining factors that are implicated in public companies in Indonesia because they have the potential to influence the quality of SR which can be presented in Figure 1 as follows:
Figure 1. Research framework
3.1 Research sample
Table 1. Determining the research sample
|
Information |
2017 |
2018 |
2019 |
2020 |
Total |
|
IDX listing company |
556 |
618 |
688 |
713 |
2591 |
|
The company conceived AR |
464 |
556 |
603 |
604 |
2178 |
|
The company structured AR & SR |
456 |
458 |
462 |
467 |
1843 |
|
AR & SR Combined |
407 |
396 |
377 |
358 |
1538 |
|
AR & SR Separate |
49 |
62 |
85 |
109 |
305 |
A total of 305 companies listed on IDX were the research sample. The sample was determined using purposive sampling using criteria, namely: 1) the company prepared an Annual Report (AR) for the period 2017-2020; 2) the company prepares a separate SR with the annual report; and 3) companies that publish AR and SR on the company website. Table 1 provides the sample details.
3.2 Research and measurement variables
Three types of variables are used: dependent, independent, and control variables. The definition and measurement of each variable is presented in Tables 2 and 3.
Table 2. Definition and measurement of dependent variable
|
Dependent Variable |
Proxies and Data Sources |
|
SR Quality (Y1) The POJK Index consists of 71 items |
SR quality is the disclosure of the SR which covers all aspects that must be included in the preparation of the SR by the provisions of POJK Number 51/03/2017 [3]. Measurement is an SR prepared based on POJK guidelines no. 03/51/2017 [46] with a total of 71 items based on the principles of relevance and reliability. SR Quality=i/$\sum n i$ SR Quality=(Relevance+Reliability)/2 $\mathrm{QSR}_{\text {it }}=\mathrm{f}$ (Relevance, Reliability $)$ $=\frac{\left[\sum_{\mathrm{n}=1}^{\mathrm{n}=7}(\text { Relevance })\right]+\left[\sum_{\mathrm{n}=1}^{\mathrm{n}=3}(\text { Reliability })\right.}{2}$ |
|
Relevance: (Y2) Consists of 9 items based on seven aspects of the relevance principle |
Relevance is SR information that can be used by report users for decision-making [40]. Relevance measurements are timely (1 item), confirmatory (2 items), understandable (1 item), clarity (1 item), comparable (1 item), predictive (1 item), and balanced (2 items) aspects [12, 19, 41, 57, 73]. Relevance is measured by the total relevance aspects in the sustainability report divided by the total relevance aspects |
|
$\frac{\left(\sum_{\mathrm{n}=1}^{\mathrm{n}=7}(\mathrm{~T} 1)+(\mathrm{CF} 2)+(\mathrm{UN} 3)+(\mathrm{CL} 4)+(\mathrm{CO1})+(\mathrm{PR} 6)+(\mathrm{B} 7))\right.}{7}$ |
|
|
Reliability: (Y3) There are 62 items based on the principle of reliability |
Reliability is that SR has comparable and credible accuracy [12, 41]. The measurement principle of reliability is information accuracy based on aspects of materiality (60 items), completeness (1 item), and accuracy (1 item). Reliability is measured from the total aspects of the sustainability report divided by the total reliability aspects |
|
$\frac{\sum_{\mathrm{n}=1}^{\mathrm{n}=8}(\mathrm{Materiality}1)+(\mathrm{Completeness}2)+(\mathrm{Accuracy}3))}{3}$ |
|
Table 3. Definition of independent variables and measurement
|
Independent Variable |
Proxies and Data Sources |
|
Coercive Isomorphism |
|
|
CSR (X1) |
Economic CSR (X1), namely disclosure of the company's economic performance which contains information about economic activities and the company's concern for economic problems [3]. Measurement of economic CSR with a score of 1 if there is economic CSR disclosure and 0 if not. Total economic CSR measurement 7 items. CSR index=e/$\sum$ nEconomi |
|
Social CSR (X2) |
Social CSR (X2) is the disclosure of company performance which includes social activities and the company's concern for social problems [3]. Social CSR measurement with a score of 1 if there is disclosure of social performance and 0 otherwise. Total measurement 8 items. CSR=s/∑n Social |
|
Environmental CSR (X3) |
Environmental CSR (X3), namely disclosure of company performance which includes activities regarding the environment and awareness of environmental problems [3]. The measurement of environmental CSR is measured by the total environmental aspect items in the sustainability report divided by the total environmental aspect POJK index. There are a total of 8 measurement items. CSR=e/$\sum$ nLingkungan |
|
Creditor Pressure (X4) |
Creditor pressure is the amount of funds a company borrows from creditors which can pressure the company to prepare a quality SR [30, 32]. Measurement of creditor pressure=$\sum \frac{\text { Total Liability }}{\text { Total Aset }}$ |
|
|
Mimetic Isomorphism |
|
Industry Association Membership (X5) |
The definition of an industrial group is the company's participation in the industrial community [12]. The measurement of industry groups is by dummy variable (1). If the company is part of an industry association and 0 if not |
|
Independent variable |
Proxies and Data Sources |
|
|
Normative Isomorphism |
|
Government Pressure (X6) |
Government pressure is pressure on share ownership by the government which can indirectly be used to control company operations [63]. Measuring government pressure with a dummy variable equal to 1 if there is share ownership by the government and 0 if not |
|
Diffusion of Share Ownership Structures |
Diffusion of share ownership structure is the spread of the types of shares owned by a company [20] Measuring the diffusion of share ownership structure in two steps, namely: step 1, namely by adding up the types of shares in the company. In this study, shares are divided into 6 types, namely: company shares, government shares, directors' shares, public shares, commissioners' shares; and foreign shares. Step 2 by scoring if the company has 4 types of shares such as company shares (score 1), public shares (score 1), directors shares (score 1), and government shares (score 1) meaning the total number of types of shares is 4, then grouped divided into two, namely total share types 1-3 with a score of 1 meaning low, and total share types 4-6 with a score of 2 grouped as high share ownership structure diffusion |
|
Control Variable |
Proxies and data sources |
|
Size (K1) |
Size is the size of the company's assets. Size is measured by the Natural Logarithm (Ln) of the asset |
3.3 Data analysis
This research uses content analysis and Multivariate Regression. The researcher tested the classical assumptions first which consisted of outlier tests, normality, multicollinearity, and heteroscedasticity, all of which were met to be continued with the Multivariate Regression test. Researchers use SPSS Version 22 software. Hypothesis testing uses a significance of 5% as an interpretation of the results, if the study results show a t with a significance of less than 5% then the hypothesis is supported which means the proposed hypothesis is by on the evidence in the field, bro, if the results of the t-test have a significance of more than 5% means the hypothesis is not supported, which means that the interpretation of the results in the field has not succeeded in proving the proposed research hypothesis.
4.1 Descriptive statistics of metric data
Table 4 shows the descriptive statistics of the variables with metric data presented as follows.
Table 4. Descriptive statistics metric data, n=305
|
Variable |
Minimum |
Maximum |
Mean |
Std. Deviation |
|
SR Quality (Y) |
0.369 |
0.956 |
0.642 |
0.087 |
|
Relevance |
0.357 |
0.929 |
0.703 |
0.089 |
|
Reliability |
0.139 |
0.989 |
0.581 |
0.136 |
|
Economic CSR (X1) |
0.140 |
1,000 |
0.758 |
0.192 |
|
Social CSR (X2) |
0.380 |
1,000 |
0.737 |
0.171 |
|
Environmental CSR (X3) |
0,000 |
1,000 |
0.676 |
0.212 |
|
Creditors (X4) |
0.040 |
1,740 |
0.563 |
0.247 |
|
Size (Z) |
13,253 |
22,062 |
17,237 |
1,876 |
Table 4 shows that the average SR of public companies in Indonesia is 64.20%. The preparation of the SR is presented separately from the annual report and uses the POJK index. The quality of SR in Indonesia shows a higher value than the study by Khan et al. [19], namely 50.70% which was tested on bank companies in Bangladesh. Judging from the results of the relevance principle, it proves that 70.3% of SRs in Indonesia can be used to make decisions. The reliability principle of 58.10% shows a lower value than the study of Khan et al. [19], namely 66.7%, which means that SR can be relied on to increase confidence in making decisions.
Economic CSR disclosure was 75.80%, a lower value than Aggarwal and Singh's [28], namely 78.33% tested in India, but higher than Yadava & Sinha's [29] study of 40 % tested on 329 companies in European countries.
The average size is 1723.70%, which means that the assets of public companies in Indonesia used in carrying out company operations are 1723.70%. Asset usage is higher than the previous study tested by Khan et al. [19] at 1118.60% in banking companies in Bangladesh.
4.2 Level of compliance with sustainability reports
This section presents the results of data processing related to the frequency of SR quality based on three levels, namely: low, medium, and high. This classification aims to determine the level of company tendencies in preparing SR. Qualification is obtained from the difference between the highest and lowest scores, namely (0.96-037=0.59), then divided by three to produce 0.197; thus showing that≤.low 0.567; 0.568-0.765 moderate; and height≥0.766).
Table 5. Compliance with SR, n=305
|
Obedience SR Qualification |
Frequency |
(%) |
|
Low |
36 |
11.80 |
|
Medium |
246 |
80.70 |
|
High |
23 |
7.50 |
|
Total |
305 |
100 |
Table 5 shows that the company has SR quality with moderate qualifications, namely 80.70%; low qualifications are 11.80%, and high qualifications are 7.50%. Most companies have SR compliance with moderate qualifications indicating that 80.70% compliance has been met.
4.3 SR quality based on the principle of relevance
The results of SR quality testing based on the relevance principle show that all aspects of the relevance principle, namely: timely, confirmatory, understandable, clear, comparable, predictable, and balanced, have increased (see Figure 2). This can indicate that the company has complied with the provisions of the SR guidelines based on POJK index No.51/03/2017. This aspect can be understood optimally, because in preparing SRs almost 100% of companies use two languages, namely Indonesian and the international language, namely English, by POJK provisions. Based on the overall clarity aspect look at whether the company includes tables and graphs as explanatory notes in the company's descriptive information. The confirmator aspect i shows low because not all companies provide feedback to stakeholders; the predictive aspect is also low, indicating that not all companies list the targets they want to achieve; while the balance aspect with an average of less than 50% is still relatively low, this shows that not all companies provide explanations regarding the positive and negative impacts of the economic, social and environmental activities carried out. However, overall public companies have prepared SRs and paid attention to seven aspects of the relevance principle, this is by previous research [12, 57, 74] which shows that they fulfill the relevance principle [19, 75].
Figure 2. Principle of relevance
4.4 SR quality is based on the reliability principle
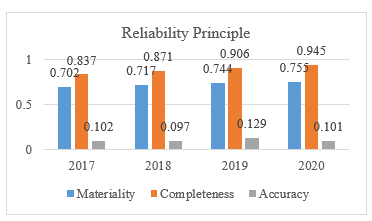
The results of SR quality testing based on the reliability principle show that almost all aspects of the reliability principle have increased (see Figure 3), especially in the aspects of materiality and completeness from 70.20% in 2017 to 75.55% in 2020, indicating that the company in preparing the SR have paid attention to the content. This research supports previous research [12, 76-80] that materiality can measure SR quality.
The completeness aspect also shows an increase, from 83.70% in 2017 to 94.5% in 2020, which means the company has approached stakeholders in preparing its SR. This research shows that SR quality based on the principle of reliability also pays attention to stakeholder involvement so that it can understand the expectations of both internal and external stakeholders [4]. The accuracy aspect experienced fluctuations, namely a decrease from 10.20% in 2017 to 9.70% in 2018; in 2019 it increased to 12.90% but in 2020 it fell again to 10.10%. The results of the accuracy aspect are very low, which means that in preparing SRs, most public companies in Indonesia have not been verified by independent parties, meaning that there are still many SRs that have not been validated by external parties. The validation results are in the form of a statement attached to the preparation of the SR, as proof that a verification test has been carried out. The very low verification results show that the accuracy of SR needs to receive serious attention as an assessment of SR content confidence so that it can show the level of SR substance that is not only symbolic [18, 41]. This research is consistent with previous research [12, 19] which shows that it is necessary to carry out careful reliability testing in assessing the quality of SR because the verification aspect is still low. However, overall this research proves that the preparation of the SR has taken into account the principle of reliability, meaning that the SR has been prepared to be reliable. The study results show that companies need to pay attention to validation measurement techniques from independent companies. Figure 3 presents a graph of reliability principles.
Figure 3. Reliability principles
4.5 Descriptive statistics of categorical data
The descriptive statistics of variables with categorical data, namely industry membership, government pressure, and diffusion of share ownership structure are shown in Table 6 as follows.
Table 6. Descriptive statistics for categorical data
|
Variable |
Low |
% |
High |
% |
|
Industry membership |
30 |
9.80 |
275 |
90.20 |
|
Government pressure |
225 |
73.80 |
80 |
26.20 |
|
Diffusion of share ownership structures |
138 |
45.20 |
167 |
54.80 |
Table 6 shows that industry membership is very high, namely 90.20%. The results of the study mean that the company is aware of being involved in the industrial community so that if the company has difficulty in preparing the SR, it can imitate other companies according to its community. A lower value for industry membership when compared to a previous study of 95.24% tested by Adaui [12] on public companies in Peru. If we look at the government pressure variable, it shows 73.80%, which means the company has low qualifications, and only 26.20% has a high classification. The achievement is almost the same as the previous study tested by Lulu [32] only 29%. The results show that government share ownership in companies is only small compared to companies without government ownership. The next description with categorical data is the diffusion of share ownership structures. Diffusion means spread. This study examines how wide the spread of company stock types is. The diffusion pressure of share ownership structure shows 54.80%, which means that it includes high share structure diffusion, meaning the company has more than 3 types of shares. Previous studies only tested share diffusion based on government shares and company shares [20] by showing more for public shares 75.47% which influenced the quality of SR. Trianaputri and Djakman's [81] study shows that the diffusion of share ownership structures has an average of 33.89% tested on companies in Asian countries, but the study does not explain the type of share diffusion.
This study elaborates on testing the diffusion of share ownership structure using two steps, namely by determining the number of types of shares and then classifying the types of shares based on high and low. Classifying stock types based on high and low can help managers assess the efficiency of the distribution of stock types. The types of sharpeners as a reference for the distribution of diffusion classifications are listed in Table 7 as follows.
Table 7. Type of shares
|
Description |
CS |
PS |
GS |
DS |
CsS |
OS |
|
Mean |
41.5 5 |
20.61 |
13.8 7 |
1.99 |
2.22 |
19.95 |
|
Median |
49.30 |
18.30 |
0.00 |
0.00 |
0.00 |
12.66 |
|
Min |
0.00 |
0.00 |
0.00 |
0.00 |
0.00 |
0.00 |
|
Max |
98.70 |
64.70 |
81.54 |
41.10 |
72.18 |
80.69 |
Notes: CS: Company Shares, PS: Public Shares, GS: Government Shares, DS: Directors Shares, CsS: Commissioner Share, OS: Other Share
Table 7 shows that the average type of company shares is 41.55% of all types of ownership. The highest share ownership is 98.70%, namely company shares, which means almost 100% of the shares are owned by the company. The type of share ownership with the least ownership is directors' shares with an average of 1.99%, followed by commissioners' shares at 2.22%. This shows that companies do not always provide compensation to directors and commissioners in the form of shares. The grouping of stock structure diffusion can be seen in Table 6 above.
4.5 Hypothesis test results
The results of content analysis and Multivariate Regression can be tested for hypotheses based on the 5% significance level shown in Table 8 as follows.
Table 8. Hypothesis testing
|
Variable |
Coefficient |
t |
Sig |
Description |
|
|
B |
St. Deviation |
|
|
|
|
|
Constant |
0.173 |
0.045 |
3,819 |
0,000 |
|
|
Economic CSR |
0.183 |
0.022 |
8,337 |
0,000*** |
H1: Supported |
|
Social CSR |
0.155 |
0.030 |
5,068 |
0,000*** |
H2: Supported |
|
Environmental CSR |
0.236 |
0.022 |
10,913 |
0,000*** |
H3: Supported |
|
Creditor Pressure |
0.047 |
0.015 |
3,218 |
0.001*** |
H4: Supported |
|
Industry Group |
0.038 |
0.012 |
3,192 |
0.002*** |
H5: Supported |
|
Government Pressure |
0.003 |
0.008 |
0.352 |
0.725 |
H6: Not Supported |
|
Diffusion of Share Ownership Structure |
0.022 |
0.007 |
3,223 |
0.001*** |
H7: Supported |
|
Size |
-0.002 |
0.002 |
-1,148 |
0.252 |
No effect |
|
F test=57.856; significance 0.000; Adjusted R2=0.599 |
|||||
Note: *** significant at 1%; ** significant at 5%; *significant at 10%
The results of testing hypothesis 1 show that the t-calculated value of the CSR economic variable is 8.337 with a significance of 0.000, which means hypothesis 1 is supported. Economic CSR disclosure is proven to coercively isomorphically influence SR quality with an influence level of 18.30%. The study results support the study of Aggarwal & Singh [28] which tested 60 companies in India with economic CSR disclosure of 47.25%. The study results are bycordance with the study by Ching et al. [82] which tested companies in Brazil with an average level of economic CSR of 56% and significant at 5%. The study results show that the higher the economic CSR disclosure, the higher the SR quality. These results are also in line with the provisions of POJK Number 51/03/2017 and support the institutional theory of coercive isomorphism which explains that POJK regulations regarding economic CSR disclosures influence the quality of SR.
The same results in testing hypothesis 2 show a social CSR significance value of 0.000 and a t-value of 5.068, which means hypothesis 2 is supported. These results indicate that corporate social CSR disclosure influences the quality of SR. The higher the social CSR disclosure, the higher the quality of SR. A total of 15.5% of social CSR disclosures showed lower achievements than the study by Ching et al. [82] which was tested on companies in China. Disclosure of social CSR in the POJK also contains a public complaint mechanism, which in a previous study was carried out by Yadava and Sinha [29] regarding corruption disclosure. In coercive isomorphism, social CSR disclosure influences the quality of SR.
Testing hypothesis 3 shows that the environmental CSR t-calculated value is 10.913 with a significance of 0.000, meaning that hypothesis 3 is also supported. The higher the environmental CSR disclosure, the higher the quality of SR. The level of influence of environmental CSR is 23.6%. The influence value is lower when compared to the Aggarwal & Singh [28] study, namely 45.9% which was tested on companies in India, and also higher in the Ching et al. [82] study of 43.5% on companies in China. The findings of this study prove that isomorphism in regulations regarding environmental CSR disclosure can improve the quality of SR.
Apart from regulatory pressure in the form of CSR disclosure, creditor pressure proves that coercive isomorphism influences SR quality. Creditors as a source of funding for companies have the authority to impose conditions on companies that will receive loans, namely to prepare SRs. Based on the results of hypothesis 4 testing, the t value (significance) of creditor pressure is 3.218 (0.000), meaning hypothesis 4 is supported. The level of creditor influence is 4.7%, although small, it can increase SR. The study results are consistent with previous studies tested by Ramadhini et al. [30], namely 0.1% tested only on manufacturing companies in Indonesia. The results also show that it is lower than the study by Gunawan and Sjarief [83], namely 40.70% which was tested only on energy and materials companies in Indonesia. The study results are consistent with the study of Karaman, et al. [84] which was tested on companies in European countries. The stronger the pressure from creditors, the higher the SR quality will be. This research is by the theory of coercive isomorphism which proves that creditors put pressure on companies to prepare quality SR.
Based on the results of testing hypothesis 5, the calculated t-value for industrial association membership was 3.192 with a significance of 0.002, which means the hypothesis is supported. Company participation in industry associations can make it easier to prepare quality SRs, because companies experience uncertainty, so they imitate other companies by referring to industry associations when preparing SRs. This research supports previous research [12] which tested public companies in Peru. Industry membership can provide benefits for companies through communication between members regarding the preparation of SRs by provisions such as POJK No: 51/3/2017.
The results of hypothesis 6 testing showed that government pressure has a t-value of 0.352 with a significance of 0.725, which means hypothesis 7 is not supported because the p-value is > 5%. Therefore, government pressure has not been shown to influence SR quality. The results of this study contradict the research of Cahaya et al. [63] and Lulu [32], but are consistent with the study of Qisthi and Fitri [5] with insignificant results tested on 35 companies in Indonesia with data for 2016-2019. The study results show that a coefficient level of 0.3% is unable to influence the quality of SR. The study results show that government pressure is not proven to coercively influence the quality of SR. The study results are consistent with the study of Lu and Abeysekera [31] which was tested on public companies in China. The reason hypothesis 6 is not supported is that the amount of government share ownership is too small, so the government lacks the power to pressure companies, including in preparing quality SRs. The existence of shares owned by the government is a normative isomorphism that is unable to supervise company operations.
Testing hypothesis 7 shows that the diffusion of share ownership structure has a t value of 3.223 with a significance of 0.001, which means hypothesis 7 is supported. Diffusion of share ownership structures influences the preparation of quality SRs. The more spread out the share ownership structure, the higher the quality of SR. This research is by previous research [72] which examined the diffusion of limited share structures in 287 banks in Norway. This study provides novelty in testing the quality of SR because previous research only tested the diffusion of share structures based on public and private shares [20], public shares [21], or majority shares [5, 83], but the study tested based on six types of shares which later based on high and low levels. This study succeeded in proving that diffusion of ownership structure can improve the quality of SR. Managers managing the company by determining the diffusion of share ownership structures can influence the quality of SR.
The control variable size shows a significance value of 0.252 with a t-value of -1.148, which means size does not affect SR quality because the p-value is > 5%. SR quality is more aligned with disclosures related to social and environmental responsibility, so size plays a smaller role in SR preparation. The results of this research are consistent with previous research by Thomas and Indriyati [85] which shows that size does not affect on the quality of SR in public companies in Indonesia in 2020. The results of the study show that size can reduce the quality of SR because size shows a negative direction, which means that the consequences of SR disclosure can reduce size, especially with the allocation of environmental costs, so companies need to pay attention again to environmental costs that do not interfere with the assets they own. This study supports the study results [86] who tested 152 companies in the Netherlands with the results that size had a negative relationship to company performance related to the environment and society, which could mean that the consequences of the company incurring costs including environmental and social costs could reduce size which ultimately also affected the quality of SR. Likewise, Darus et al. (2015)' s study was tested on companies in Malaysia which proved that size does not influence sustainable business practices, including SR quality.
After obtaining the test results for both independent and dependent variables, the following equation can be formulated:
SR Quality (Y1)=0.173+0.183 CSR_eco+0.155 CSR_soc +0.236 CSR_env+0.047 Credit+0.038 In+0.022 Dif+0.003 Gov-0.002 Size
The SR quality equation shows that the influence of CSR_economy is 0.183, which means that if it increases by 1 it will increase SR by 0.183. The Adjusted R2 value of 59.90% shows that the SR quality level is 59.90% determined by CSR_economy, CSR_social, CSR_environment, creditor pressure, membership of industry associations, diffusion of share ownership structure, government pressure and size, while the remaining 40.10% is influenced by other factors outside the research model. The F test result is 57.856 with a significance of 0.000 < 0.05, which means that this Multivariate Regression model is suitable for predicting the quality of SR, and the variables CSR economy, CSR_social, CSR_environment, creditor pressure, membership of industrial associations, diffusion of share ownership structure, government pressure and size of ownership simultaneous influence on SR quality.
The residual value of the 40.10% model needs to be tested with other factors outside the model, such as including elements of corporate governance such as the existence of a board of commissioners or a board of directors which is likely to provide better results. Apart from that, is able t is possible that future studies can also test the determinants of SR quality by separating industrial sectors which will provide better results. This study has limitations in testing SR separately, it is likely to show different results from testing SR combined with annual reports.
Based on the results of data testing and analysis of SR quality content, it shows that 305 public companies in Indonesia registered on the IDX for the 2017-2020 period have a moderate level of qualification compliance, which means the level of compliance expressed will reach 64%. In addition, companies have also paid attention to SR regulations. issued by the government, namely POJK No. 03/51/2017, and apply the principles of relevance and reliability in maintaining SR quality.
This study can contribute both theoretically and empirically. This research proves that the quality of SR using the institutional isomorphism theory approach is most appropriate to use to test the quality of SR, as proven by the institutional explanation of coercive isomorphism which can prove that the quality of SR can increase because there is forced pressure on companies to prepare quality SR, both from internal or external.
Institutionally, mimetic isomorphism is proven to be able to explain that the quality of SR in Indonesia is proven because companies imitate other companies that are superior so they can prepare quality SR. Likewise, institutionally with normative isomorphism, company policies are independent and normative, managers can develop strategies by issuing outstanding share policies, using share diffusion.
This study has implications for policymakers such as POJK as representatives of government elements in the Republic of Indonesia to pay attention to the efficiency of the SR preparation provisions so that the sustainable financial roadmap can be realized.
The implication for industry and companies is that it can be used as a reference in paying attention to the preparation of SRs, taking into account factors that can influence the quality of SRs, such as determining the diffusion of share ownership structures.
This study has implications in testing the quality of SR, especially in public companies in Indonesia, that the preparation of SR with the POJK index can be carried out as a company's compliance with regulations so that it can be used to see the efficiency of SR regulations on practices in the field, especially related to the sustainable finance roadmap.
The next implication is that the preparation of SRs using POJK guidelines can be used to determine compliance, even though the results show moderate, in the future, it needs to be re-evaluated so that companies really understand the POJK guidelines and implement SRs better and more precisely so that the quality of SRs can increase.
The research is that it can use a diffusion test of share ownership structure with two steps, namely testing the number of types of shares which are then classified, because it can be used to see the company's efficiency in determining the types of shares in circulation.
The final implication is that this study can show that the quality of SR can be determined from CSR disclosures both economic, social, and environmental, external stakeholder pressure from creditor pressure, industrial group pressure, and internal from the diffusion of share ownership structures.
This study proves that it can illustrate that public companies, especially companies in Indonesia that are listed on IDX, are required to comply with applicable regulations. Apart from that, you need to test the content from SR to see the quality of SR. SR testing which is measured using the principles of relevance and reliability will be more convincing in assessing the quality of SR. Apart from that, testing the diffusion of share ownership structure has proven to be able to be used to test the quality of SR and can be used to test the company's efficiency in policies regarding the types of shares in circulation.
This study has limitations, namely that it is unable to prove that government pressure can improve the quality of SR. and Size which can reduce the quality of SR. To overcome the weakness of the study, namely government pressure, we used a measurement of the percentage of ownership from the government using a coercive isomorphism approach. This study uses a measurement of government pressure with a score of 1 if there is government pressure, and a score of 0 if there is none with normative isomorphism which turns out to have weaknesses. Likewise, for size so as not to reduce the quality of SR, the Size measurement is the number of employees measured from the natural logarithm of the number of employees which is likely to show better results, because the number of employees can also fluctuate compared to the number of assets.
This research still has great potential to be developed both theoretically and practically, with the development of the institutional theory of coercive isomorphism, it is possible to test the quality of SR by testing the role of other stakeholders that have not been tested in this study, such as; media, consumers, the role of tax provisions, that would likely provide a better explanation.
[1] Kaplan, R., Kinderman, D. (2019). The business-class case for corporate social responsibility: Mobilization, diffusion, and institutionally transformative strategy in Venezuela and Britain. Theory and Society, 48(1): 131-166. https://doi.org/10.1007/s11186-019-09340-w
[2] Adhariani, D., Du Toit, E. (2020). Readability of sustainability reports: Evidence from Indonesia. Journal of Accounting in Emerging Economies, 10(4): 621-636. https://doi.org/10.1108/JAEE-10-2019-0194
[3] OJK RI. (2017). Peraturan OJK nomor 51/POJK.03/2017 tentang penerapan keuangan berkelanjutan bagi lembaga jasa keuangan, emiten, dan perusahaan publik.
[4] Rudyanto, A., Veronica Siregar, S. (2018). The effect of stakeholder pressure and corporate governance on the sustainability report quality. International Journal of Ethics and Systems, 34(2): 233-249. https://doi.org/10.1108/IJOES-05-2017-0071
[5] Qisthi, F., Fitri, M. (2020). Pengungkapan laporan keberlanjutan berdasarkan global reporting initiative (GRI) G4. Jurnal Ilmiah Mahasiswa Ekonomi Akuntansi (JIMEKA), 5(4): 469-484.
[6] Fihrrst. (2020). Studi laporan keberlanjutan tahun 2020 perusahaan publik di Indonesia.
[7] Tejedor-Flores, N., Galindo-Villardón, P., Vicente-Galindo, P. (2016). Sustainability multivariate analysis based on the global reporting initiative (GRI) framework, using as a case study: Brazil compared to Spain and Portugal. Urban Regeneration & Sustainability, 12: 307. https://doi.org/10.2495/SDP-V12-N4-667-677
[8] Delloite. (2022). Ini hasil survey deloitte dan GRI terbaru soal animo CEO pada aspek keberlanjutan perusahaan. Majalah CSR, pp. 18-20.
[9] NCSR. (2020). Daftar perusahaan Indonesia yang menyusun laporan keberlanjutan tahun 2020.
[10] Abdul Rahman. (2022). NCSR gelar ASRRAT 2022. Ini Deretan Perusahaan dan Organisasi Peraih Penghargaan. rakyatsulsel.co.
[11] PWC. (2023). ESG in Indonesia: Access to finance.
[12] Loza Adaui, C.R. (2020). Sustainability reporting quality of peruvian listed companies and the impact of regulatory requirements of sustainability disclosures. Sustainability, 12(3): 1135. https://doi.org/10.3390/su12031135
[13] Schulz, M., Della Vedova, B. (2014). Directive 2014/95/EU of the europan parliament and of the council.
[14] Gatti, L., Vishwanath, B., Seele, P., Cottier, B. (2019). Are we moving beyond voluntary CSR? Exploring theoretical and managerial implications of mandatory CSR resulting from the new Indian companies act. Journal of Business Ethics, 160: 961-972. https://doi.org/10.1007/s10551-018-3783-8
[15] Fatima, A.H., Abdullah, N., Sulaiman, M. (2015). Environmental disclosure quality: Examining the impact of the stock exchange of Malaysia’s listing requirements. Social Responsibility Journal, 11(4): 904-922. https://doi.org/10.1108/SRJ-03-2014-0041
[16] Jamil, A., Mohd Ghazali, N.A., Puat Nelson, S. (2021). The influence of corporate governance structure on sustainability reporting in Malaysia. Social Responsibility Journal, 17(8): 1251-1278. https://doi.org/10.1108/SRJ-08-2020-0310
[17] Mahoney, L.S., Thorne, L., Cecil, L., LaGore, W. (2013). A research note on standalone corporate social responsibility reports: Signaling or greenwashing?. Critical perspectives on Accounting, 24(4-5): 350-359. https://doi.org/10.1016/j.cpa.2012.09.008
[18] Nasution, R.M., Adhariani, D. (2016). Simbolis atau substantif? Analisis praktik pelaporan csr dan kualitas pengungkapan. Jurnal Akuntansi Dan Keuangan Indonesia, 13(1): 23-51. https://doi.org/10.21002/jaki.2016.02
[19] Khan, H.Z., Bose, S., Mollik, A.T., Harun, H. (2021). “Green washing” or “authentic effort”? An empirical investigation of the quality of sustainability reporting by banks. Accounting, Auditing & Accountability Journal, 34(2): 338-369. https://doi.org/10.1108/AAAJ-01-2018-3330
[20] Badia, F., Bracci, E., Tallaki, M. (2020). Quality and diffusion of social and sustainability reporting in Italian public utility companies. Sustainability, 12(11): 4525. https://doi.org/10.3390/su12114525
[21] Dienes, D., Sassen, R., Fischer, J. (2016). What are the drivers of sustainability reporting? A systematic review. Sustainability Accounting, Management and Policy Journal, 7(2): 154-189. https://doi.org/10.1108/SAMPJ-08-2014-0050
[22] Aman, Z., Ismail, S., Bakar, N.S. (2015). Corporate sustainability reporting: Malaysian evidence. In Proceeding of the 2nd International Conference on Management and Muamalah (No. 2ndICoMM), pp. 287-299.
[23] Suwardjono, T.A. (2005). Perekayasaan Pelaporan Keuangan. Yogyakarta: Bpfe.
[24] PWC. (2015). 18th annual global CEO survey: A marketplace without boundaries? Responding to disruption. pp. 1-44.
[25] DiMaggio, P.J., Powell, W.W. (1983). The iron cage revisited: Institutional isomorphism and collective rationality in organizational fields. American Sociological Review, 147-160.
[26] Dillard, J.F., Rigsby, J.T., Goodman, C. (2004). The making and remaking of organization context: Duality and the institutionalization process. Accounting, Auditing & Accountability Journal, 17(4): 506-542. https://doi.org/10.1108/09513570410554542
[27] Berthelot, S., Coulmont, M., Serret, V. (2012). Do investors value sustainability reports? A Canadian study. Corporate Social Responsibility and Environmental Management, 19(6): 355-363. https://doi.org/10.1002/csr.285
[28] Aggarwal, P., Singh, A.K. (2019). CSR and sustainability reporting practices in India: An in-depth content analysis of top-listed companies. Social Responsibility Journal, 15(8): 1033-1053. https://doi.org/10.1108/SRJ-03-2018-0078
[29] Yadava, R.N., Sinha, B. (2016). Scoring sustainability reports using GRI 2011 guidelines for assessing environmental, economic, and social dimensions of leading public and private Indian companies. Journal of Business Ethics, 138: 549-558. https://doi.org/10.1007/s10551-015-2597-1
[30] Ramadhini, A., Adhariani, D., Djakman, C.D. (2020). The effects of external stakeholder pressure on CSR disclosure: Evidence from Indonesia. DLSU Business and Economics Review, 29(2): 29-39.
[31] Lu, Y., Abeysekera, I. (2014). Stakeholders' power, corporate characteristics, and social and environmental disclosure: Evidence from China. Journal of Cleaner Production, 64: 426-436. https://doi.org/10.1016/j.jclepro.2013.10.005
[32] Lulu, C.L. (2020). Stakeholder pressure and the quality of sustainability report: Evidence from Indonesia. Journal of Accounting, Entrepreneurship and Financial Technology (Jaef), 2(1): 53-72. https://doi.org/10.37715/jaef.v2i1.1864
[33] Dissanayake, D., Kuruppu, S., Qian, W., Tilt, C. (2021). Barriers for sustainability reporting: Evidence from Indo-Pacific region. Meditari Accountancy Research, 29(2): 264-293. https://doi.org/10.1108/MEDAR-01-2020-0703
[34] de Villiers, C., Alexander, D. (2014). The institutionalisation of corporate social responsibility reporting. The British Accounting Review, 46(2): 198-212. https://doi.org/10.1016/j.bar.2014.03.001
[35] Fernandez-Feijoo, B., Romero, S., Ruiz, S. (2014). Effect of stakeholders’ pressure on transparency of sustainability reports within the GRI framework. Journal of Business Ethics, 122: 53-63. https://doi.org/10.1007/s10551-013-1748-5
[36] Huang, C.L., Kung, F.H. (2010). Drivers of environmental disclosure and stakeholder expectation: Evidence from Taiwan. Journal of Business Ethics, 96: 435-451. https://doi.org/10.1007/s10551-010-0476-3
[37] Joshi, S., Li, Y. (2016). What is corporate sustainability and how do firms practice it? A management accounting research perspective. Journal of Management Accounting Research, 28(2): 1-11. https://doi.org/10.2308/jmar-10496
[38] Wang, J., Tian, G., Fan, W., Luo, D. (2017). The effect of mandatory regulation on corporate social responsibility reporting quality: Evidence from China. Journal of Applied Business Research, 33(1): 67-86. https://doi.org/10.19030/jabr.v33i1.9861
[39] Dillard, J.P., Anderson, J.W. (2004). The role of fear in persuasion. Psychology & Marketing, 21(11): 909-926. https://doi.org/10.1002/mar.20041
[40] Chauvey, J.N., Giordano-Spring, S., Cho, C.H., Patten, D.M. (2015). The normativity and legitimacy of CSR disclosure: Evidence from France. Journal of Business Ethics, 130: 789-803. https://doi.org/10.1007/s10551-014-2114-y
[41] Michelon, G., Pilonato, S., Ricceri, F. (2015). CSR reporting practices and the quality of disclosure: An empirical analysis. Critical Perspectives on Accounting, 33: 59-78. https://doi.org/10.1016/j.cpa.2014.10.003
[42] Martínez-Ferrero, J., García-Sánchez, I.M. (2017). Coercive, normative and mimetic isomorphism as determinants of the voluntary assurance of sustainability reports. International Business Review, 26(1): 102-118. https://doi.org/10.1016/j.ibusrev.2016.05.009
[43] Rodriguez-Fernandez, M. (2016). Social responsibility and financial performance: The role of good corporate governance. BRQ Business Research Quarterly, 19(2): 137-151. https://doi.org/10.1016/j.brq.2015.08.001
[44] Tran, N.M., Tran, M.H., Phan, T.D. (2022). Corporate social responsibility and earning management: Evidence from listed Vietnamese companies. Cogent Business & Management, 9(1): 2114303. https://doi.org/10.1080/23311975.2022.2114303
[45] Ching, H.Y., Gerab, F., Toste, T.H. (2017). The quality of sustainability reports and corporate financial performance: Evidence from Brazilian listed companies. Sage Open, 7(2): 2158244017712027. https://doi.org/10.1177/2158244017712027
[46] Gatti, L., Seele, P. (2014). Evidence for the prevalence of the sustainability concept in European corporate responsibility reporting. Sustainability Science, 9: 89-102. https://doi.org/10.1007/s11625-013-0233-5
[47] Bansal, P., DesJardine, M.R. (2014). Business sustainability: It is about time. Strategic Organization, 12(1), 70-78. https://doi.org/10.1177/1476127013520265
[48] Baldini, M., Maso, L.D., Liberatore, G., Mazzi, F., Terzani, S. (2018). Role of country-and firm-level determinants in environmental, social, and governance disclosure. Journal of Business Ethics, 150: 79-98. https://doi.org/10.1007/s10551-016-3139-1
[49] Asif, M., Searcy, C., Zutshi, A., Fisscher, O.A. (2013). An integrated management systems approach to corporate social responsibility. Journal of Cleaner Production, 56: 7-17. https://doi.org/10.1016/j.jclepro.2011.10.034
[50] Zahid, M., Rahman, H.U., Khan, M., Ali, W., Shad, F. (2020). Addressing endogeneity by proposing novel instrumental variables in the nexus of sustainability reporting and firm financial performance: A step‐by‐step procedure for non-experts. Business Strategy and the Environment, 29(8): 3086-3103. https://doi.org/10.1002/bse.2559
[51] Del Giudice, A., Rigamonti, S. (2020). Does audit improve the quality of ESG scores? Evidence from corporate misconduct. Sustainability, 12(14): 5670. https://doi.org/10.3390/su12145670
[52] Hapsoro, D., Adyaksana, R.I. (2020). Apakah pengungkapan informasi lingkungan memoderasi pengaruh kinerja lingkungan dan biaya lingkungan terhadap nilai perusahaan? Jurnal Riset Akuntansi Dan Keuangan, 8(1): 41-52.
[53] Eccles, R.G., Ioannou, I., Serafeim, G. (2014). The impact of corporate sustainability on organizational processes and performance. Management Science, 60(11): 2835-2857. https://doi.org/10.1287/mnsc.2014.1984
[54] Darus, F., Mad, S., Nejati, M. (2015). Ethical and social responsibility of financial institutions: Influence of internal and external pressure. Procedia Economics and Finance, 28: 183-189. https://doi.org/10.1016/S2212-5671(15)01099-0
[55] Perego, P., Kolk, A. (2012). Multinationals’ accountability on sustainability: The evolution of third-party assurance of sustainability reports. Journal of Business Ethics, 110: 173-190. https://doi.org/10.1007/s10551-012-1420-5
[56] Tang, Y., Sun, M., Ma, W., Bai, S. (2020). The external pressure, internal drive and voluntary carbon disclosure in China. Emerging markets Finance and Trade, 56(14): 3367-3382. https://doi.org/10.1080/1540496X.2019.1689356
[57] Lock, I., Seele, P. (2016). The credibility of CSR (corporate social responsibility) reports in Europe. Evidence from a quantitative content analysis in 11 countries. Journal of Cleaner Production, 122: 186-200. https://doi.org/10.1016/j.jclepro.2016.02.060
[58] Ahmad, S., Wong, K.Y. (2019). Development of weighted triple-bottom line sustainability indicators for the Malaysian food manufacturing industry using the Delphi method. Journal of Cleaner Production, 229: 1167-1182. https://doi.org/10.1016/j.jclepro.2019.04.399
[59] Seguí-Mas, E., Bollas-Araya, H.M., Polo-Garrido, F. (2015). Sustainability assurance on the biggest cooperatives of the world: An analysis of their adoption and quality. Annals of Public and Cooperative Economics, 86(2): 363-383. https://doi.org/10.1111/apce.12073
[60] Putri Pertiwi, I.F., Kusuma, H., Hadi, K., Arifin, J., Yoga, I., Zakky Fahma, A. (2022). Isomorphism of integrated reporting’s sustainability embeddedness: Evidence from Indonesian listed companies. Cogent Business & Management, 9(1): 2099605. https://doi.org/10.1080/23311975.2022.2099605
[61] Fifka, M. (2012). The development and state of research on social and environmental reporting in global comparison. Journal füR Betriebswirtschaft, 62: 45-84. https://doi.org/10.1007/s11301-012-0083-8
[62] Hahn, R., Kühnen, M. (2013). Determinants of sustainability reporting: A review of results, trends, theory, and opportunities in an expanding field of research. Journal of Cleaner Production, 59: 5-21. https://doi.org/10.1016/j.jclepro.2013.07.005
[63] Roman Cahaya, F., Porter, S.A., Tower, G., Brown, A. (2012). Indonesia's low concern for labor issues. Social Responsibility Journal, 8(1): 114-132. https://doi.org/10.1108/17471111211196610
[64] Nugrahani, T.S., Atiqoh, K.I., Pertiwi, I.F.P. (2022). The effect of industry type, government pressure, and company size to disclosure of sustainability report. Journal of Business and Management Review, 3(1): 45-56. https://doi.org/10.47153/jbmr31.3092022
[65] Arrokhman, D.B.K., Siswanto, S. (2021). Effect of environmental pressure, shareholder pressure, and company size on the quality of sustainability reporting. E-Journal of Accounting, 31(12): 3162-3177.
[66] Rudyanto, A., Veronica Siregar, S. (2018). The effect of stakeholder pressure and corporate governance on the sustainability report quality. International Journal of Ethics and Systems, 34(2): 233-249. https://doi.org/10.1108/IJOES-05-2017-0071
[67] Puspitaningrum, D., Atmini, S. (2012). Corporate governance mechanism and the level of internet financial reporting: Evidence from Indonesian companies. Procedia Economics and Finance, 2: 157-166. https://doi.org/10.1016/S2212-5671(12)00075-5
[68] Singal, P.A., Putra, I.N.W.A. (2019). Pengaruh kepemilikan institusional, kepemilikan manajerial, dan kepemilikan asing pada pengungkapan corporate social responsibility. E-Jurnal Akuntansi, 29(1): 468.
[69] Edison, A. (2017). Struktur kepemilikan asing, kepemilikan institusional dan kepemilikan manajerial pengaruhnya terhadap luas pengungkapan corporate social responsibility (Csr). Bisma: Jurnal Bisnis dan Manajemen, 11(2): 164-175. https://doi.org/10.19184/bisma.v11i2.6311
[70] Marsinah, M. (2021). Pengaruh struktur kepemilikan saham, struktur modal dan profitabilitas terhadap nilai perusahaan pada perusahaan manufaktur sub sektor properti dan real estate yang terdaftar du bursa efek indonesia. Ekonomica Sharia: Jurnal Pemikiran dan Pengembangan Ekonomi Syariah, 7(1): 47-66. https://doi.org/10.36908/esha.v7i1.313
[71] Rustiarini, N.W. (2011). Pengaruh struktur kepemilikan saham pada pengungkapan corporate social responsibility. Jurnal Ilmiah Akuntansi dan Bisnis, 6(1): 1-24.
[72] Putri, T.R., Sari, R.N., Sari, R.N. (2013). Pengaruh kepemilikan asing, kinerja lingkungan dan pengaruh politik terhadap luas pengungkapan corporate social responsibility pada perusahaan pertambangan yang terdaftar di bursa efek Indonesia. Jurnal Sosial Ekonomi Pembangunan, 3(9): 268-285.
[73] Bøhren, Ø., Josefsen, M.G., Steen, P.E. (2012). Stakeholder conflicts and dividend policy. Journal of Banking & Finance, 36(10): 2852-2864. https://doi.org/10.1016/j.jbankfin.2012.06.007
[74] Martani, D., Siregar, S.V., Wardhani, R., Farahmita, A., Tanujaya, E. (2016). Akuntansi Keuangan Menengah Berbasis PSAK Konvergensi IFRS. 2nd ed. Salemba Empat.
[75] Carungu, J., Di Pietra, R., Molinari, M. (2021). Mandatory vs voluntary exercise on non-financial reporting: Does a normative/coercive isomorphism facilitate an increase in quality? Meditari Accountancy Research, 29(3): 449-476. https://doi.org/10.1108/MEDAR-08-2019-0540
[76] Sebrina, N., Taqwa, S., Afriyenti, M., Septiari, D. (2023). Analysis of sustainability reporting quality and corporate social responsibility on companies listed on the Indonesia stock exchange. Cogent Business & Management, 10(1): 2157975. https://doi.org/10.1080/23311975.2022.2157975
[77] Feliyanti, C. (2022). Analisis penilaian materialitas laporan keberlanjutan pada 15 perusahaan multifinance. Jurnal Akuntansi, 11(1): 40-52.
[78] Putri, I. H., Meutia, I., Yuniarti, E. (2022). Faktor yang Mempengaruhi Pengungkapan Materialitas pada Laporan Keberlanjutan. E-Jurnal Akuntansi, 32(7): 1771-1784.
[79] Schiehll, E., Kolahgar, S. (2021). Financial materiality in the informativeness of sustainability reporting. Business Strategy and the Environment, 30(2): 840-855. https://doi.org/10.1002/bse.2657
[80] Torelli, R., Balluchi, F., Furlotti, K. (2020). The materiality assessment and stakeholder engagement: A content analysis of sustainability reports. Corporate Social Responsibility and Environmental Management, 27(2): 470-484. https://doi.org/10.1002/csr.1813
[81] Trianaputri, A.R., Djakman, C.D. (2019). Quality of sustainability disclosure among the Asean-5 countries and the role of stakeholders. Jurnal Akuntansi Dan Keuangan Indonesia, 16(2): 180-205. https://doi.org/10.21002/jaki.2019.10
[82] Ching, H.Y., Gerab, F., Toste, T.H. (2017). The quality of sustainability reports and corporate financial performance: Evidence from Brazilian listed companies. Sage Open, 7(2): 2158244017712027. https://doi.org/10.1177/2158244017712027
[83] Gunawan, V., Sjarief, J. (2022). Analisis pengaruh profitabilitas, leverage, dan ukuran perusahaan terhadap pengungkapan sustainability report. Balance: Jurnal Akuntansi, Auditing dan Keuangan, 19(1): 22-41.
[84] Karaman, A.S., Kilic, M., Uyar, A. (2018). Sustainability reporting in the aviation industry: worldwide evidence. Sustainability Accounting, Management and Policy Journal, 9(4): 362-391. https://doi.org/10.1108/SAMPJ-12-2017-0150
[85] Thomas, G.N., Aryusmar, A., Indriaty, L. (2020). The effect of company size, profitability, and leverage on sustainability report disclosure. Journal of Talent Development & Excellence, 12(1): 4700-4706.
[86] Braam, G.J., De Weerd, L.U., Hauck, M., Huijbregts, M.A. (2016). Determinants of corporate environmental reporting: The importance of environmental performance and assurance. Journal of Cleaner Production, 129: 724-734. https://doi.org/10.1016/j.jclepro.2016.03.039