Een Zarlin*![]() | Alfitri
| Alfitri![]() | Amin Rejo
| Amin Rejo![]() | Ari Siswanto
| Ari Siswanto![]()
© 2023 IIETA. This article is published by IIETA and is licensed under the CC BY 4.0 license (http://creativecommons.org/licenses/by/4.0/).
OPEN ACCESS
The comprehensive spatial planning is a complex long-term plan prepared to achieve sustainable urban growth. To strive for an optimal drafting process, the level of participation and collaboration of each stakeholder element must be measured to avoid potential problems among stakeholders in the future. The present study aims to assess the process of stakeholder collaboration and participation in spatial planning for the Talang Kelapa urban area, Banyuasin Regency, South Sumatra Province, Indonesia. The research was conducted by qualitative interviews followed by the Structural Equation Model (SEM) to analyze the main indicators of collaboration and the level of participation of the stakeholders involved. Furthermore, Confirmatory Factor Analysis is used to measure the level of validity and reliability of each indicator used. The results of the study show that nine indicators determine the success of the participation and collaboration during spatial planning, namely (1) the history of collaboration, (2) the existence of collaborative groups on the environmental dimension, (3) mutual understanding (in the dimension of member characteristics), (4) flexibility (in the dimensions of structure and process), (5) communication intensity (in the communication dimension), (6) goal achievement, (7) shared vision (in the goal dimension), (8) adequacy of funds, and (9) human resource improvement (in the resource dimension). The level of participation and collaboration of stakeholders in the studied area is in the medium category meaning that the relationship between each stakeholder is still formal and has not occurred optimally. The results could be a first step to figure out where the participation and collaboration between stakeholder and optimally conduct the suggested model to perform spatial planning. The aim is to make the best spatial planning and avoid the future problem in Talang Kelapa.
spatial planning, qualitative descriptive analysis, Structural Equation Model (SEM), Talang Kelapa urban area
Global statistics show the population growth in cities of 54% and 56% in 2018 and 2021, respectively, as the number of urban residents expands on average every year [1, 2]. The population is expected to continue growing annually, with an estimated increase to 68% by 2050 compared to the total population in 2023 [3, 4]. The continent of Asia and the Oceania Region are listed as having a population of 54% of the world's urban population where the majority of which occur in developing countries such as Indonesia, Malaysia, and China [1, 4]. The urban areas hold the majority of the population density since they are the economic backbone of the regions. Besides, the urban areas are also the hubs of community activities. In Indonesia, the population of urban areas reaches 57.3% of the total population and this number will continue to grow in line with the increasing urbanization in Indonesia [5].
Urbanization has resulted in an increase in population, which has sparked the growth of communities nearby or in close proximity to the urban centers. As a result of high density or lack of space in urban areas, non-urban areas have emerged as hubs of several new activities. The limited residential space in cities contributes to the growth of non-urban areas. Consequently, a pattern has been established that shows a rise in the proportion of people who live in suburban areas while working in downtown areas. As a result, the edges of cities have become new cities, along with the rapid population growth in non-urban areas [6]. The growth of activities in suburban areas is sometimes not effectively managed through cautionary planning since they are not considered development priority areas [7]. Spatially, population growth has changed many non-urban areas such as changes in the use of agricultural land into residential land, or green open land into built-up land [7, 8]. Data from the United Nations shows that changes in land use average 1.5% per year where the data is taken from the growth of world cities from 2000 to 2015 [3]. However, the greatest growth occurred in low to moderate-income countries which reached between 2.6 percent to 1.9 percent [3].
In Indonesia, spatial planning is still oriented toward development growth and is more inclined through efforts to achieve economic growth targets, so it pays little attention to social, cultural, and environmental sustainability aspects [9]. Therefore, future spatial planning policies must be transparent and fair, as well as accommodate the interests of various levels of society. Likewise, spatial planning should involve the community as development actors in spatial planning, utilization, and control [10]. Furthermore, non-urban planning should be prioritized, particularly in areas that are close to or intersect with the provincial capitals.
Spatial planning in non-urban areas can be carried out collaboratively due to the characteristics of people in non-urban areas who uphold the principles of collaboration, participation and cooperation. The notion of collaborative planning has become a widespread issue in the last two decades [11] wherein an inclusive approach to governance of collective concern has become an issue offered especially regarding coexistence in areas together, and the power to pull ideas and practices through a more rationalist and corporatist way [12, 13]. However, the idea of collaborative planning has several drawbacks where problems come from the urban communities that have a different point of view than those in suburban/non-urban areas. The main problem of spatial planning in developing countries is the low enforcement of spatial regulations. In addition, several cases of spatial planning have not been carried out according to plan, so it will be difficult to realize it sustainably [14]. The failure of the collaborative process will result in land degradation such as a decrease in the amount of arable land, a decrease in the value of ecosystem services, congestion, threats of vulnerability, and even disaster risks, especially floods [15, 16]. The land degradation and disasters will then initiate more complex problems, especially the problem of determining the party who is responsible for the negative impacts caused by the failure of land management.
In this study, the level of collaboration and participation of each stakeholder will be assessed in the frame of spatial planning in the Talang Kelapa urban area, Banyuasin Regency, South Sumatra Province. The design of the collaborative concept for land management in the Talang Kelapa area will be carried out in a goal-based consensus, with the expected output being the participation and collaboration level of stakeholders in the area's spatial planning efforts. The selection of the Talang Kelapa urban area was also carried out because this area is the hinterland area of Palembang City, the capital city of South Sumatera and part of the Great Statue Metropolitan Urban Area which is one of the urban areas that has become the National Activity Center in the last ten years [17, 18]. Talang Kelapa, where governance is expected to take into account the interests of all stakeholders while remaining effective. Long-term characteristics of high governance quality and effectiveness must be present in the expected governance [11, 19]. The technical form that will be carried out is to plan land management in the Talang Kelapa area by integrating contributions from stakeholders, both government, civil society, private actors, and non-governmental organizations. This practice allows plans and policies to be obtained to prevent and resolve technical problems, deal with land use conflicts, and find a balance of available land use for agriculture, nature conservation, and housing and economic development by interactively involving affected interests through face-to-face dialogue, discussions together, and focused discussions to broaden their knowledge collectively so as to minimize the risk of conflict [12, 20].
2.1 Research location
The study was conducted in the Talang Kelapa urban area, Banyuasin Regency, South Sumatra Province. The administrative areas for the study to be carried out are Sukajadi Sub-District, Tanah Mas Sub-District, Sukomoro Sub-District, and Talang Buluh Village which is the border area between Banyuasin Regency and Palembang City, South Sumatra, Indonesia. The geographical Location of the Study Site is 1°37'32.12" to 3°09'15.03" S and 104°02'21.79" to 105°33'38.5" E (Figure 1). The choice of study location was based on the geographical location of the Talang Kelapa area which is directly adjacent to the city of Palembang, the capital city of South Sumatra Province.
Figure 1. The research location of Talang Kelapa in the region of Banyuasin, South Sumatera Province, Indonesia
2.2 Data sampling
The sampling of respondents was conducted using a purposive sampling method where 238 respondents were differentiated by their background. There were 7 backgrounds used in these studies: Regional Government, Regional People's Representative Council, TNI and Polri, Academics, Community Leaders, NGOs, and Local People. All respondents from various backgrounds are considered as parties who have an interest and have the right to participate in the spatial planning process in the Talang Kelapa. The details of respondent numbers are shown in Table 1.
Table 1. The respondent joined the participation and collaboration assessment in the Talang Kelapa
|
Participant Types |
Number of Participant (n) |
|
Regional Government |
5 |
|
Regional People's Representative Council |
5 |
|
National Army and National Police of Republic of Indonesia |
5 |
|
Academics |
5 |
|
Community Leader |
5 |
|
Non-Government Organisation |
3 |
|
Local People |
158 |
|
Total Participants |
238 |
2.3 Data collection
Measuring the value of stakeholder collaboration and participation and policy in the Talang Kelapa is carried out in two stages of research, namely: (1) exploring indicators that determine the process of collaboration and participation in the preparation of the detailed spatial plan for the Talang Kelapa urban area; and (2) assessing the level of participation and collaboration of stakeholders and policies in the preparation of detailed spatial plans in the Talang Kelapa urban area.
The assessment was conducted using the survey method by dispersing questionnaire to 238 respondents in order to identify indicators in the collaborative process of creating detailed spatial plans for the Talang Kelapa urban area, followed by direct in-depth interviews. There are 26 factors grouped into six categorical variables for determining the elements of regional collaboration, namely: (1) environmental factors, (2) membership, (3) process and structure, (4) communication, (5) objectives, and (6) resources [21, 22]. The 26 factors will be assessed based on the structure of the model with confirmatory factor analysis on three latent variables, namely the Collaboration Process (Y1), Participation (Y2), and the Level of Collaboration (Y3). Details of the variables and indicators used in this study are shown in Table 2.
2.4. Data analysis
Confirmatory Factor Analysis (CFA) and Goodness of Fit (GOF) method are used to test variables (X and Y) to see whether they support the hypothesized model [23]. The use of CFA and GOF is justified because both analyses are robust analytical methods that do not require a large sample size for testing [23]. Furthermore, the present study used two stages of CFA analysis: the first order and the second order confirmatory factor analysis. The first-order CFA analyzes the significant indicator of the latent variables, including Environment/X1, Member Characteristics/X2, Process and Structure/X3, Communication/ X4, Goal/X5, Resource/X6, Collaboration Process/Y1, Participation/Y2, and Collaboration Level/Y3, where the covariance variable will be used in the second order of CFA.
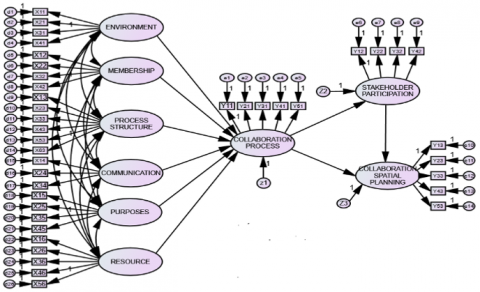
The second order of CFA is used to interpret the scale as multilevel and multidimensional. The second order of CFA will answer the second goal of how the six X variables are related to the three latent participations (Y). The analysis was carried out using a tool in the form of the IBM SPSS Amos 22 program. The construction of the model to be tested in this study is shown in Figure 2.
Table 2. Variable and indicator used to assess the collaboration and participation in Talang Kelapa
|
Variable |
Indicator |
|
Environment (X1) |
X11: Collaboration History X21: Collaboration Group X31: Political Condition X41: Social Condition |
|
Membership (X2) |
X12: Respectful X22: Trust and Understanding X32: Collaboration is a key. X42: Negotiation Skill |
|
Process and Structure (X3) |
X13: Resource Sharing X23: Participation X33: Flexibility X43: Clear Instruction X53: Adaptation Skill X63: Right Role |
|
Communication (X4) |
X14: Openness X24: Intense Communication X34: Informal Communication |
|
Objective (X5) |
X15: Concrete Objective X25: Achievable Goal X35: Clear Vision X45: Uniqueness Objective |
|
Resource (X6) |
X16: Source of Funding X26: Human Resources X36: Materials X46: Time X56: Leadership |
|
Collaboration Process (Y1) |
Y11: Open Dialog Y21: Trust Development Y31: Process Commitment Y41: Shared Understanding Y51: Intermediate Result |
|
Participation (Y2) |
Y12: Energy Participation Y22: Idea Participation Y32: Funds Participation Y42: Complete Participation |
|
Level of Collaboration (Y3) |
Y13: Managerial Y23: Administration Y33: Autonomy Y43: Mutuality Y53: Norm |
Figure 2. Structural collaboration model in the spatial planning of Talang Kelapa with six variables and three latent variables
The relationship between the first-order of CFA and the second-order of CFA can be seen from the Eqs. (1)-(4).
$X_n=\propto_n X_{(1,2,3,4,5) n}+\varepsilon_n$ (1)
$Y_1=\beta_1 X_1+\beta_2 X_2+\beta_3 X_3+\beta_4 X_4+\beta_5 X_5+\beta_6 X_6+\zeta_1$ (2)
$Y_2=\beta_7 Y_1+\zeta_2$ (3)
$Y_3=\beta_8 Y_1+\zeta_3$ (4)
where, X refers to the sub-scales of latent X variable, Y(1-3) is the three latent variables; n is the number of sub-scales (1-6; see Table 2); $\alpha$ and $\beta$ are the loading factors for the first and second order of CFA, ε is the measurement error for observed indicator, and $\zeta$ is the error in structural equation [23].
Goodness fit evaluation is also carried out to analyze the data by referring to the Structural Equation Modeling (SEM) assumptions given to the model. Several assumptions that must meet the goodness fit criteria include sample size, data normality, outliers, and multicollinearity. Based on the sample size and the provided model, all data meets the GOF and will be followed by suitability tests and statistical tests. Table 3 shows the statistical test criteria used in this study.
Table 3. Goodness of Fit (GOF) analysis critera
|
Statistical Analysis |
Criteria Goodness Fit |
|
X2 / Chi Square |
p>0.05 and p>0.10 |
|
Root Mean Square of Approximation (RMSEA) |
RMSEA £ 0.08 |
|
Goodness of Fit Index |
0 (Poor Fit) to 1 (Perfect Fit) |
|
CMIN/DF or Minimum Sample Discrepancy Function divided by Degree of Freedom (DF) |
CMIN/DF < 2.0 or 3.0 |
|
Tucker Lewis Index (TLI) |
TLI > 0.95 |
|
Comparative Fit Index (CFI) |
CFI > 0.95 |
3.1 Population growth in Talang Kelapa urban area
The urban area of Talang Kelapa is located in the administrative area of Banyuasin Regency, which is directly adjacent to the Alang-alang Lebar District of Palembang City, the capital city of South Sumatra Province. The selection of the research location was based on high population growth in the Talang Kelapa urban area. Table 4 shows data on the comparison of the population in the study location between 2014 and 2020 [24]. The increase in population growth has led to a high rate of land conversion in the Talang Kelapa area, where changes in land use patterns in various forms and ways have an impact on the environment [25].
Table 4. The population growth in the Talang Kelapa urban area
|
No. |
Sub-District |
Population Number 2014 |
Population Number 2020 |
|
1 |
Sukajadi |
26,929 |
30,810 |
|
2 |
Tanah Mas |
16,483 |
18,791 |
|
3 |
Sukomoro |
13,732 |
19,383 |
|
4 |
Talang Buluh |
2,249 |
3,258 |
Table 4 shows that the highest population growth in the last five years was in Talang Buluh, with a growth rate of 44.86%, followed by Sukomoro at 41.15%, Sukajadi at 14.41%, and Tanah Mas at 14.15%. The increasing population has resulted in the phenomenon of urbanization continuing to occur in the Talang Kelapa urban area and resulted in land changes every year. The factors triggering housing development in the Talang Kelapa urban area are influenced not only by the physical environmental factors, but also by the flat land area, and by good accessibility factors and proximity to the workplace (Palembang).
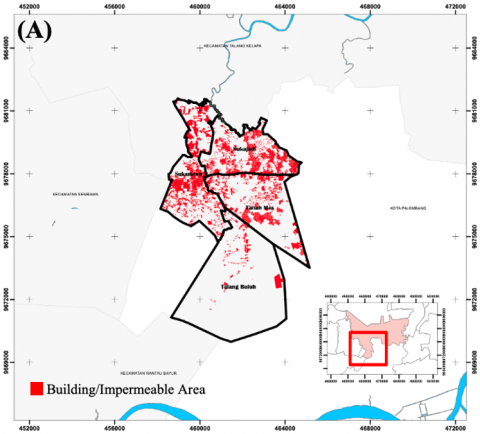
During the period from 2010 to 2020, the Talang Kelapa area saw development towards urbanization, marked by an increase in changes of open land, and permeable land (the specific area which allow water to pass through) to closed and built-up land which water is not allowed to pass through as it is in the form of cement/asphalt (impermeable). The built up area in 2010 was 902.82 ha, or around 19.88% of the area of the Talang Kelapa urban area to 1200.65 ha or around 26.14% of the area of the area by 2020 or an increase of 32%. Figures 3A and 3B show the land changes in built-up land in the Talang Kelapa urban area.
Figure 3. Land change from (A) 2010 to (B) 2020 in the Talang Kelapa. Red color indicated as the impermeable area
The land changes have resulted in several environmental degradations, such as an increase in the probability of flooding, land degradation, and the unsustainability of the physical and social structures of settlements [26]. An increase in built-up land also reduces the environment carrying capacity to against several natural phenomena such as floods, droughts, sedimentation, and abrasion. The massive increases in built-up land need to be managed properly to prevent and control the risk of land degradation.
3.2 Determination of variables and indicators for the detailled spatial planning for the Talang Kelapa urban area
To determine the variables and indicators, the constructor is carried out by giving questionnaires to respondents about the level of importance of the six determining variables to develop a detailed spatial plan. In general, the results of the responses from the 238 respondents are shown in Table 5.
Table 5. The result of important level between six variables used in the spatial planning of Talang Kelapa urban area
|
Variable |
Important Level* |
||||
|
1 |
2 |
3 |
4 |
5 |
|
|
X1 |
- |
6 |
50 |
158 |
34 |
|
X2 |
- |
7 |
72 |
89 |
70 |
|
X3 |
- |
23 |
192 |
23 |
- |
|
X4 |
7 |
27 |
92 |
95 |
17 |
|
X5 |
1 |
24 |
86 |
107 |
20 |
|
X6 |
- |
6 |
132 |
95 |
5 |
Note: *1 (Extremely Unimportant) and 5 (Extremely Important)
The results of the screening variable that the most determine the success of collaboration according to respondents are the environment variable where 62.2% of respondents stated that they support the ongoing collaboration. The second most supportive factor is the purpose variable 45%, followed by communication and resources (39.9%) and member characteristics or membership (37.4%). For process and structural variables, the majority of respondents (approximately 80%) are neutral in the opinion that process and structural variables are not so important in determining the success of collaboration in preparing detailed spatial plans in the Talang Kelapa urban area.
Data analysis using the SEM analysis structure through the confirmatory factor analysis method also supports the results from the respondents. In the first stage of the CFA test, the six variables were proven to be captable to define the latent variable constructs. However, when the CFA test phase II (full model analysis) was carried out, it was found that 26 indicators that determined the success of the collaboration. It turned out that only 15 indicators were proven to be captable to jointly define latent constructs which were then used for the analysis of the Collaborative Structural Model of Spatial Planning of the Talang Kelapa urban area where 9 indicators have proven to fit from the indicators determining the success of collaboration (Variable X), 2 indicators of the collaboration cycle (Y1), 2 indicators of participation (Y2), and 2 indicators of the level of collaboration (Y3). Details of the results of the validity and reliability tests of the variables that proved fit are shown in Table 6 and the results of the CFA analysis based on all the variables used proposed in Figure 4.
Table 6. Validity and reliability test result for proposed structural model
|
GOF Measurement |
Indicator / Cut Off |
Value |
Result |
|
Validity Test |
Regression/ Significant p-value<0.05 |
Y13 =*** Y23 =*** Y32 =*** Y42 =*** X21 =*** X11 =*** X22 =*** X13 =*** X24 =*** X35 = 0.003 X25 =*** X26 =*** X16 =*** Y31 =*** Y41 =*** |
Valid Valid Valid Valid Valid Valid Valid Valid Valid Valid Valid Valid Valid Valid Valid |
|
Loading Factor/ Value>0.045 |
Y13 = 0.764 Y23 = 0.814 Y32 = 0.448 Y42 = 0.859 X21 = 0.994 X11 = 0.492 X22 = 0.989 X13 = 0.991 X24 = 0.992 X35 = 0.494 X25 = 0.619 X26 = 0.752 X16 = 0.833 Y31 = 0.274 Y41 = 0.546 |
Valid Valid Valid Valid Valid Valid Valid Valid Valid Valid Valid Valid Valid Valid Valid |
|
|
Realibilitas Test |
R2/R2<0.20 |
Y41 = 0.299 Y31 = 0.075 X16 = 0.694 X26 = 0.565 X25 = 0.383 X35 = 0.244 X24 = 0.985 X13 = 0.982 X22 = 0.978 X11 = 0.243 X21 = 0.989 Y42 = 0.738 Y32 = 0.201 Y23 = 0.662 Y13 = 0.584 |
Reliable Reliable Reliable Reliable Reliable Reliable Reliable Reliable Reliable Reliable Reliable Reliable Reliable Reliable Reliable |
|
CR/ CR>0.70 |
0.948 |
Reliable |
|
|
AVE/ AVE>0.70 |
0.575 |
Reliable |
Figure 4. CFA model of spatial planning collaboration in the preparation of spatial planning for urban area of Talang Kelapa
Based on the GOF values in Table 6, the proposed CFA model was founded to be suitable and conformed to the criteria. The overall model was fit. The result, based on Table 6 and Table 7, confirmed that the 15 indicators significantly form the latent variable of stakeholder participation in the determinants of the success of collaboration in the preparation of the detailed spatial plan in the Talang Kelapa urban area.
Table 7. Goodness of Fit model CPA of participation latent variable
|
Goodness of Fit Analysis |
Term |
Value |
Note |
|
CHI SQAURE |
Expected Small |
90.455 |
Fit |
|
P-VALUE |
P ≥ 0.005 |
0.051 |
Fit |
|
GFI |
≥ 0.90 |
0.950 |
Fit |
|
AGFI |
≥ 0.90 |
0.914 |
Fit |
|
RMSEA |
≤ 0.10 |
0.036 |
Fit |
|
CFI |
≥ 0.90 |
0.960 |
Fit |
|
TLI |
≥ 0.90 |
0.940 |
Fit |
|
NFI |
≥ 0.90 |
0.953 |
Fit |
3.3 Critical indicators of collaboration success
The results of the CFA test show that nine indicators determine the success of the collaboration in the preparation of the spatial planning of Talang Kelapa urban area, namely: the History of Cooperation (X11), Group Collaboration (X21), Mutual Understanding and Trust (X22), Resource Sharing (X13), Intense Communication (X24), Achievable Goals (X25), Shared Vision (X35), Funding Sources (X16), and Human Resources (X26), which represent the six variables provided. The results of the study show that collaboration is more likely to occur when it is supported by environmental conditions in the form of a history of collaboration and the existence of collaboration groups. The history of collaboration is found in most stakeholders, especially stakeholders within the scope of the Banyuasin Regency Government, Vertical Agencies/institutional ministries (National Land Agency (BPN), Statistics Indonesia (BPS), Indonesian National Military (TNI) and Indonesian National Police (POLRI), Provincial Government and Palembang City Government where each has collaborated in the context of implementing development activity programs that also involve cross-government stakeholders (Regency/City, and vertical agencies), such as poverty alleviation programs, stunting reduction and inflation control. The experience of cooperation makes it easier for stakeholders to interact and communicate, including in discussing and solving problems.
The nine indicators that have been proven to determine the success of the collaboration in the preparation of the spatial planning affect the mutual trust and understanding among stakeholders in the Talang Kelapa urban area. The collaborative processes are not only about negotiations but also about building trust among stakeholders [27]. Building the trust is often the most salient aspect of the initial collaboration process and is quite difficult to develop. On the other hand, the trust-building is a time-consuming process and requires a long-term commitment. Based on the results of the analysis testing, it shows that there is a significant influence between environmental conditions, member characteristics, processes and structures, communication, objective, and resources on the collaboration process of each stakeholder.
Based on the results of the first order and second order of the CFA method, the model that determines the success of the collaboration from the preparation of a detailed spatial plan for the urban area of Talang Kelapa can be constructed through the formation of Eq. (4) as follows.
$Y_1=0.14 X_1+0.13 X_2+0.07 X_3+0.09 X_4+0.19 X_5+0.09 X_6+0.01$
3.4 Determination of stakeholder participation and collaboration level indicator
The stakeholder participation in the preparation of the spatial planning of the Talang Kelapa urban area is observed starting from planning stage followed by implementation, monitoring and participation in enjoying the results of the spatial planning. Based on the CFA analysis, the most influence indicators affected \the level of participation and collaboration of stakeholders are the commitment to the process (Y31) followed by shared the understanding of other stakeholder (Y41), cost participation (Y32), complete participation to all aspect (Y42), governance (Y13), and administration (Y23). The CFA results show that the stakeholders mostly participate in the process of monitoring, evaluating, and utilizing the implementation of the preparation of the spatial plans. The structural equation that can be given in terms of participation (Y2) and the level of collaboration (Y3) of stakeholders is shown in Eqs. (5) and (6) as follows.
$Y_2=1.55 Y_1+0.4$ (5)
$Y_3=0.3 Y_2+0.4$ (6)
3.5 The participation level measurement of stakeholder in spatial planning preparation
The stakeholder participation in this study is measured using 4 (four) indicators, namely participation in planning, participation in implementation, participation in monitoring and evaluation, and participation in enjoying the results/benefits. To measure the level of stakeholder participation, a questionnaire (Likert scale 1 - 5) is used which contains questions related to the form and intensity of participation in each stage of the spatial planning preparation. The measurement results through a questionnaire are shown in Table 8.
Table 8. The result of participation level measurement
|
Detail |
Participation Level |
Number of Respondents |
% |
|
Participation Level |
Extremely Low |
- |
- |
|
Low |
29 |
12.2 |
|
|
Moderate |
142 |
59.7 |
|
|
High |
67 |
28.2 |
|
|
Extremely High |
- |
- |
|
|
Total |
238 |
100 |
|
The results showed that more than 50% of the respondents had a moderate level of participation, which indicated that the level of stakeholder participation in the Talang Kelapa urban area was at the Consultation level. The participation level in consultation implies that communication is two-way but still participatory in a formal manner. There are several activities conducting together such as the brainstorming to find aspirations and investigate community wishes, submitting ideas/space utilization ideas, focused group discussion between the stakeholder of Talang Kelapa However, there is no guarantee that these aspirations will be realized as the result of consultation level. The measurement results show that the preparation of spatial planning must be controlled periodically to ensure that stakeholders will continue to participate because weak control and evaluation of activities will make it difficult to obtain an ideal management plan.
3.6 The collaboration level measurement in the spatial planning
The collaboration level measurement is the final part of the present study where 5 indicators are used as benchmarks for measuring the level of stakeholder collaboration [22]: management, administration, mutuality, organizational autonomy, and norms. The result showed that the collaboration is important for spatial planning in the Talang Kelapa since collaboration is a process involving shared norms and mutually beneficial interactions in which autonomous actors interact through formal and informal negotiations, together creating the rules and structures that govern their relationships and ways of acting or deciding issues that unite them. The result of collaboration level measurements is shown in Table 9.
Table 9. The result of collaboration level measurement
|
Detail |
Collaboration Level |
Number of Respondents |
% |
|
Collaboration Level |
Extremely Low |
1 |
0.4 |
|
Low |
65 |
27.3 |
|
|
Moderate |
141 |
59.2 |
|
|
High |
30 |
12.6 |
|
|
Extremely High |
1 |
0.4 |
|
|
Total |
238 |
100 |
|
The results showed that the stakeholders’ level of collaboration was also in the moderate level, indicating that the collaboration does take place during the process of developing detailed spatial plans, it remains formal. The moderate level is also an indicator that collaboration between government and non-government entities is still not yet running optimally. However, the measurement results still provide positive results where each stakeholder element, especially non-government, can work together in the spatial planning process. The collaboration between autonomous and semi-autonomous actors through formal and informal negotiations, jointly creating rules and structures that govern their relations can still be carried out. The collaboration is important because it can solve problems from various points of view. The collaboration is also important because it is a process that involves shared norms and mutually beneficial interactions from all stakeholders (multidimensional variable construct).
The level of participation and collaboration measurement of the stakeholders in the preparation of spatial plans in the Talang Kelapa urban area produces 9 indicators that determine the success of spatial planning, namely the history of collaboration, the existence of collaboration groups on environmental dimensions, mutual understanding (member characteristics dimension), flexibility (structural dimension) and process, the intensity of communication (communication dimension), objective that can be achieved, a shared vision (objective dimension), and human resource funds (resource dimension). The nine indicators played the role in the level of stakeholder participation and collaboration. The results also showed that the latent variable (Y) is at a moderate level where the pattern of participation and collaboration is still in a formal condition where the control of each element becomes an important factor for carrying out the preparation of spatial plans. It is important that the research results are to be taken into consideration by policymakers to begin to approach each stakeholder in Talang Kelapa so that the spatial planning process can occur optimally.
The authors thank the Office of Public Works and Spatial Planning of Banyuasin District for providing and supporting technical and non-technical support for this study.
[1] United Nation. (2018). 2018 Revision of world urbanization Prospects. https://www.un.org/en/desa/2018-revision-world-urbanization-prospects, accessed on Aug. 24, 2023.
[2] United Nation. (2022). Population division: World population prospects 2022. https://population.un.org/wpp/, accessed on Aug. 24, 2023.
[3] United Nation. (2020). Population data booklet. https://www.population.un.org, accessed on Aug. 24, 2023.
[4] United Nation. (2022). Envisaging the future of cities. https://unhabitat.org/, accessed on Aug. 24, 2023.
[5] United Nation. (2020). UNCTAD handbook of statistics 2021. https://www.unctad.org, accessed on Aug. 24, 2023.
[6] Mardiansjah, F.H., Wiwandari, H., Jawoto, S.S. (2018). Pertumbuhan penduduk perkotaan dan perkembangan pola distribusinya pada kawasan metropolitan surakarta. Jurnal Wilayah Dan Lingkungan, 6(3): 215. https://doi.org/10.14710/jwl.6.3.215-233
[7] Tambani, J. (2018). Kajian pengaruh urban sprawl terhadap perkembangan infrastruktur di kecamatan mapanget. Media Matrasain, 15(1): 71-89. https://doi.org/10.35792/matrasain.v15i1.21188
[8] Bjørn, A., Manuele, M., Pierre, O.R., Cécile, B., Michael Z.H. (2016). A proposal to measure absolute environmental sustainability in life cycle assessment. Ecological Indicators, 63: 1-13. https://doi.org/10.1016/j.ecolind.2015.11.046
[9] Lisdiyono, E. (2016). Pergeseran Substansi kebijakan tata ruang nasional dalam regulasi daerah (studi empirik di kota semarang). Jurnal Ilmiah Hukum Dan Dinamika Masyarakat, 4(2): 149-61. https://doi.org/10.56444/hdm.v4i2.368
[10] Matondang, M.A. (2022). Analysis of spatial management in regional development planning (Case study: Medan city). Jurnal Geografi, 14(2): 237. https://doi.org/10.24114/jg.v14i2.36643
[11] Deyle, R.E., Ryan, E.W. (2014). Collaborative planning by metropolitan planning organizations: A test of causal theory. Journal of Planning Education and Research, 34(3): 257-75. https://doi.org/10.1177/0739456X14527621
[12] Healey, P. (2010). Planning with complexity: An introduction to collaborative rationality for public policy. Planning Theory & Practice, 11(4): 623-26. https://doi.org/10.1080/14649357.2010.525376
[13] Meng, M., Marcin, D., Yuting, T., Dominic, S., Faith, C. (2019). Collaborative spatial planning in the face of flood risk in delta cities: A policy framing perspective. Environmental Science and Policy, 96: 95-104. https://doi.org/10.1016/j.envsci.2019.03.006
[14] United Nations Human Settlements Programme. (2009). Planning sustainable cities: Policy directions global report on human settlements 2009. Vol. 3. https://www.unhabitat.org, accessed on Aug. 17, 2023.
[15] Liu, W., Zhan, J.Y., Zhao, F., Yan, H.M., Zhang, F., Wei, X.Q. (2019). Impacts of urbanization-induced land-use changes on ecosystem services: A case study of the pearl river delta metropolitan region, China. Ecological Indicators, 98: 228-38. https://doi.org/10.1016/j.ecolind.2018.10.054
[16] Zeng, C., Yaolin, L., Alfred, S., Limin, J. (2015). International journal of applied earth observation and geoinformation characterization and spatial modeling of urban sprawl in the Wuhan metropolitan area, China. International Journal of Applied Earth Observations and Geoinformation, 34: 10-24. https://doi.org/10.1016/j.jag.2014.06.012
[17] National Development Planning Agency Republic of Indonesia. (2015). Rencana pembangunan jangka menengah nasional tahun 2015 - 2019. pp. 1-266. https://www.perpustakaan.bappenas.go.id, accessed on Jul. 21, 2023.
[18] National Development Planning Agency Republic of Indones. (2020). National mid-term development plan 2020-2024. p. 313. https://www.perpustakaan.bappenas.go.id, accessed on Jul. 21, 2023.
[19] Booher, D.E., Judith, E.I. (2002). Network power in collaborative planning. Journal of Planning Education and Research, 21(3): 221-236. https://doi.org/10.1177/0739456X0202100301
[20] Schaefer, E., Ulrich, S. (2014). Collaboration in spatial planning. Assessing the suitability and application potential of information and communication technologies. In Proceedings of the 28th EnviroInfo 2014 Conference, Oldenburg, Germany, pp. 645-652.
[21] Astuti, R.S., Warsono, H., Rachim, A. (2020). Collaborative governance. Dalam perspektif administrasi publik. Semarang: Program Studi Doktor Administrasi Publik. Fakultas Ilmu Sosial dan Ilmu Politik, Universitas Diponegoro Press. Tim DAP Press.
[22] Thomson, A.M., James, L.P., Theodore, K.M. (2009). Conceptualizing and measuring collaboration. Journal of Public Administration Research and Theory, 19(1): 23-56. https://doi.org/10.1093/jopart/mum036
[23] Tafarini, M.F., Yazid, M., Suryadi, F.X., Prayitno, B., Faizal, M., Purba, K.F. (2022). The development of instruments for farmers’ participation in water management in tidal lowlands using confirmatory factor analysis. Emirates Journal of Food and Agriculture, 34(9): 773-783. https://doi.org/10.9755/ejfa.2022.v34.i9.2936
[24] Badan Pusat Statistik Kabupaten Banyuasin. (2023). Jumlah Penduduk Menurut Kecamatan dan Jenis Kelamin (Jiwa). Diakses Pada Tanggal 23 Agustus 2023. https://banyuasinkab.bps.go.id/indicator/12/265/1/jumlah-penduduk-menurut-kecamatan-dan-jenis-kelamin.html, accessed on Aug. 21, 2023.
[25] Desiyana, I. (2017). Urban sprawl dan dampaknya pada kualitas lingkungan: Studi kasus di dki jakarta dan depok. Jurnal Komunikasi Visual Ultimart, 9(2): 16-24. https://doi.org//10.31937/ultimart.v9i2.745
[26] Pigawati, B., Nany, Y., Fadjar, H.M. (2017). Pembatasan perkembangan permukiman kawasan pinggiran sebagai upaya pengendalian perkembangan kota semarang. Tataloka, 19(4): 306. https://doi.org/10.14710/tataloka.19.4.306-319
[27] Ansell, C., Alison, G. (2008). Collaborative governance in theory and practice. Journal of Public Administration Research and Theory, 18(4): 543-571. https://doi.org/10.1093/jopart/mum032