Pertiwi Andarani*![]() | Syafrudin Syafrudin
| Syafrudin Syafrudin![]() | Sudarno Sudarno
| Sudarno Sudarno![]() | Anik Sarminingsih
| Anik Sarminingsih![]() | Winardi Dwi Nugraha | Wiwik Budiawan
| Winardi Dwi Nugraha | Wiwik Budiawan![]() | Kuriko Yokota
| Kuriko Yokota![]() | Takanobu Inoue
| Takanobu Inoue![]()
© 2023 IIETA. This article is published by IIETA and is licensed under the CC BY 4.0 license (http://creativecommons.org/licenses/by/4.0/).
OPEN ACCESS
Microplastics are concerning pollutants with increasing global presence. Yet, data on their occurrence in Indonesian rivers, especially in Semarang, is limited. This study aimed to assess microplastic abundance and characteristics in Greater Semarang's Babon and East Flood Canal (Kanal Banjir Timur, KBT) rivers at five stations. Sampling and analysis followed Japanese Guidelines of Riverine Microplastic Survey. Spearman's correlation analyzed the link between microplastic abundance and population served by waste services. Microplastics were found in all stations, with the highest levels downstream, likely due to accumulation along the flow. Abundance varied from 1.1-9.6 particles/m3. No significant correlation between microplastic abundance and population was found. The most prevalent microplastic form was sheet (14-75%), primarily sized 0.5-1 mm and black (1-60%). The main identified polymer type was polyethylene in sheet form, possibly originating from single-use plastic bags. These findings underscore the urgency of preventing waste leakage into rivers to reduce microplastic release into the environment. By addressing the issue of single-use plastics in hard-to-reach areas and improving waste management practices, we can work towards mitigating the impact of microplastics on the environment.
microplastic, pollution, abundance, waste management, population, river, Indonesia
Small plastic fragments of <5 mm in length are referred to as microplastics [1], which have been identified as new contaminants of concern. Due to their persistent and floatable properties serving as vehicles for the transfer of contaminants to aquatic organisms, microplastics have been found in various global ecosystems including freshwater and marine [2] thus, they are regarded as common marine contaminants in the aquatic environment [3]. When aquatic species swallow them, they bioaccumulate and exhibit particle or chemical toxicity, affecting feeding habits, development, and reproduction of an organism. The levels of their ecotoxicological risks vary depending on the species [4]. In general, microplastics can cause aquatic species to feel full more quickly, thus restricting food intake, and they interfere with the absorption of nutrients and energy. Moreover, mesopelagic fish after ingesting microplastics may find it challenging to re-enter deeper waters due to the buoyancy of microplastics [5].
Plastic waste from land is primarily found in marine environments, and up to 80% of marine debris comes from land-based sources, which are carried into oceans by natural streams, wind, sewage or drainage systems, and human negligence [6]. Indonesia has been considered as the largest source of plastic pollution for the world’s oceans [7]. Indonesia has been identified as a major producer of plastics on the Asian continent due to its high population and mismanagement of plastic waste [8]. The mismanagement of plastic waste may lead to a plastic leakage into the environment, particularly rivers. In Jakarta, the capital city of Indonesia, this leakage reached 9.9 g/person/day [9]. The residents mostly use groundwater for their water supply [10], so the microplastic can threat the population through drinking water [11, 12].
A study on Benoa Bay, Bali, Indonesia, has found that the proportions of microplastics based on sizes of 0.5-1, >1, 0.3-0.5, and <0.3 mm are 37.9, 35.7, 22.1, and 4.3%, respectively, while those based on shapes of fragments, foam, fiber, and granules were 73.19, 17.02, 6.38, and 3.40%, respectively [13]. They found average microplastic concentrations in the range of 0.38-0.61 particle/L in Surabaya’s northern coastal waters, while the waters of Lamong Bay were identified to contain both the highest and lowest concentrations of microplastics. According to a study that analyzed microplastic properties in several stations, foams were generally the most prevalent form of microplastics with sizes ranging 0.5-1 mm (48.54%) and 0.3-0.5 mm (45.48%), while polystyrene was the most prevalent type of polymer (58.44%) [1].
Semarang, the provincial government of Central Java, is the sixth largest city in Indonesia; thus, it has one of the biggest impacts on waste. Its garbage forms an island in the Kanal Banjir Timur (KBT or East Flood Canal, hereafter referred to as, KT) estuary, located in Semarang City, and various spots with waste piles along the KT have been found in 2021 [14]. Along the KT River, up to 864±204 pieces/day of plastic litter were observed [15]. Plastic wastes in river waters are potential sources of microplastics for the waters. The first peer-reviewed articles of identification of microplastic in seawater of KT estuary revealed that the abundance reached 7 particles/10 mL [16]. A study in Semarang [17] has found that KT estuary contains 179.1 particles/m3 of microplastics, mainly consisting of fibers, fragments, films, and pellets at levels of 37.8, 34.1, 18.3, and 85.9 particles/m3, respectively. Meanwhile, in Banjir Kanal Barat (West Flood Canal) estuary, the microplastic level found is 79.5 particles/m3, which primarily consists of fibers, fragments, films, and pellets at levels of 20.1, 28.1, 5.4, and 25.1 particles/m3, respectively. A study [18] reported that the coastal village of Mangunharjo contains different kinds of microplastics: fiber, pieces, films, and pellet. Moreover, fiber showed the highest microplastic concentration of 5,120 particles/m3 . Substantial differences in the amount of microplastics in coastal areas, rivers, and mangroves were also found, and their average microplastic concentrations were in the range of 3,584-8,106.6 particles/m3. It should be noted that in there is no confirmation whether the fiber was verified to be a plastic polymer leading to possible overestimation.
To the best of the authors' knowledge: (1) microplastic research in Semarang is mostly conducted in coastal areas, (2) there has been no research on microplastics in freshwater in Semarang, (3) there has been no investigation of the abundance of microplastics in Semarang rivers, (4) There is no research in Indonesia that links microplastic abundance and population, (5) there has been no study of the relationship between microplastic abundance and waste management in a watershed. In Indonesia, secondary microplastics, which result from deteriorated plastic waste released into the environment (intentionally or unintentionally), may surpass primary microplastics in abundance. The country's mismanaged waste, particularly plastic waste leakage, constitutes the largest source of plastic pollution in the world's oceans. This study adopts a waste management framework, examining the impact of effective waste management service coverage on reducing plastic leakage (including microplastics) into the environment and subsequently decreasing microplastic abundance in a watershed. Thus, this study aims to obtain preliminary findings regarding the abundance and characteristics of microplastics in river water and their relationships to the population density according to the level of municipal solid waste management services in its watershed. The study contributes to the scientific literature by providing new data and insights into the extent and characteristics of microplastics in Indonesian watersheds. It expands our understanding of microplastic pollution patterns and trends in different environmental settings, contributing to broader research on the global microplastic problem.
2.1 Study area
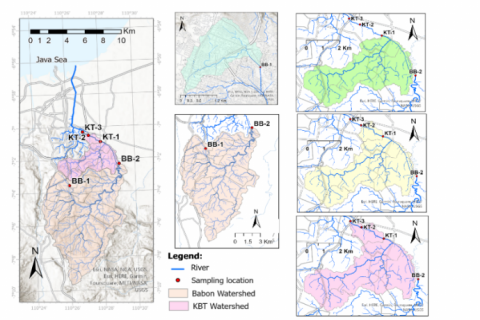
This study was conducted in two watershed in the greater area of Semarang, Central Java, Indonesia, i.e., KT watershed and Babon watershed (hereafter, referred to as, BB). Mount Butak in Ungaran, Semarang Regency, is the upstream source of the BB watershed. The streams are separated administratively among the watersheds of the following rivers: Krengseng, Dombo-Sayung, and KT River. The separations were made to stop flooding in the city (downstream). All sampling locations are located in the Greater Semarang Area (Table 1).
A watershed (KT watershed) that was identified as a hotspot of plastic pollution, primarily in its estuary, was chosen. Additionally, another watershed (Babon watershed), mainly in the upstream area, served by the municipal solid waste management system with varying population densities, was selected. The selected locations were placed in Babon River (BB-1 and BB-2), and three sampling points were selected in the KT River (KT-1-KT-3), as illustrated in Figure 1. Field survey and sampling were done on different day for each sampling location in May 2022 during the dry season. The study area under investigation experiences two distinct seasons: a dry season and a rainy season. For the purposes of this preliminary study, sampling was conducted exclusively during the dry season. This was done in order to obtain an accurate assessment of microplastic abundance that was not influenced by the particle washout due to the effects of rainfall in illegal waste disposal sites located in proximity to the river. By limiting our sampling to the dry season, we sought to minimize any potential confounding variables that may impact the accuracy and reliability of our findings. The watershed map was created using ArcGIS Pro with national digital elevation model (DEMNAS) [19].
Figure 1. Study area of rivers in the Greater Semarang
Table 1. Description of sampling point
|
Sampling Location |
Description |
|
BB-1 |
Located in the middle of a residential area (Jl. Estetika Timur, Pedalangan, Banyumanik) |
|
BB-2 |
Large rivers in the middle of densely populated areas (Sendangmulyo River Bridge, Plamongansari, Sayung) |
|
KT-1 |
Located in an urban area of about 10 m from the residential area (Gemah Bridge, Kedungmundu, Tembalang) |
|
KT-2 |
Residential area located in the urban of Semarang City, where a traditional market is available in the morning (Gotong Royong Bridge, Sendangguwo, Tembalang) |
|
KT-3 |
Located in a densely populated area (Talang Londo Bridge, Jl. Lamper Tengah IX, South Semarang) |
2.2 Sampling method
Sampling followed the Japanese Riverine Microplastic Survey Guidelines using a short cone-shaped Plankton-net (Rigosha & Co., Ltd) with diameter and mesh size of 30 cm and 0.3 mm, respectively [20]. Sampling, which was done in three replicates, was by descending directly into the middle of a river the net using a stick or rope for 10 min. The river flow velocity was measured using a mechanical flowmeter (General Oceanics, Inc.). To avoid contamination with other particles on a riverbed, all parts of the sampling net were submerged near the surface of the river. The net was removed and organic materials (e.g., leaves) with sizes of >5 mm were separated. The sampling net was washed with deionized water until it was clean. Samples were transferred to glass jars, which were then immediately closed and stored at 4℃ until analysis.
2.3 Microplastic isolation method
The collected samples were analyzed in the water laboratory, Department of Environmental Engineering, Diponegoro University, Semarang, in accordance with the Japanese guidelines. To prevent contamination, we used powder-free nitrile gloves and cotton laboratory coat. The working bench was cleaned before and after isolation. The isolation steps included filtration with a 0.3 mm nylon filter, removal of contaminations with sizes >5 mm using tweezers, and rinsing with deionized water. A filtrate was transferred to a vacuum pump for further filtration using a 0.1 mm nylon filter cloth. The resulting filtrate was transferred to a glass cup and dried in an oven at 60℃. For oxidation treatment, a dry sample was added to 100 mL of 30% H2O2 solution, and the mixture was covered with aluminum foil and heated for 3 days at 55℃.
When 3 days was not sufficient to complete the reaction, 100 mL of 30% H2O2 solution is added again, and the sample was heated for 1 day. For microplastic candidate separation, an inactive solution was filtered using a vacuum pump. A sample and appropriate amount of 5.3 M Sodium iodide solution were transferred to a glass funnel. The top of the funnel was covered with a watch glass prior, and the sample mixture was kept for 3 h. Once separation between solution and sample occurred, the sample was rinsed with filtered deionized water. The rinsed sample was vacuumed filtered using a 0.1 mm nylon filter, and the microplastic sample was transferred to a petri dish for selection of microplastic candidate particles. The microplastic samples were visually observed, and the microplastic candidate particles were separated and transferred to an individual capsule storage using metal tweezers [21]. Candidate particles were observed under a stereo microscope (Olympus SZ61) to measure their lengths and widths and were classified based on their shapes, sizes, and colors. Microplastic samples were analyzed by attenuated total reflection (ATR) Fourier transform infrared (FT-IR) spectroscopy (PerkinElmer UATR Spectrum Two) to determine their polymer composition. We analyzed 99.5% plastic particle candidate (total N = 217) found in all samples. Each analysis comprised of 32 scans with a spectrum range from 4000 to 400 cm-1 at resolution of 8 cm-1. The ATR spectra were analyzed using PerkinElmer Spectrum IR 10.6.1 software and the highest search score (>0.80) was used to confirm the polymer type.
To minimize the potential for filter contamination, any particle spectra that matched exactly with that of the nylon filter were removed from the analysis. Additionally, several precautionary measures were implemented to prevent contamination, including the use of cotton lab coats and nitrile gloves, thorough cleaning of the workbench prior to and after use, and immediate sealing of sample containers after handling. Furthermore, a laminar flow cabinet was utilized during the wet-peroxidation method to maintain a clean working environment. These measures were implemented to ensure the accuracy and reliability of the results obtained in our analysis of microplastics in the samples.
2.4 Analysis methods
The abundance of microplastics at the study site was calculated by Eq. (1).
$K=\frac{n}{V}$ (1)
where, K, n, and V are the abundance of microplastics (particles/m3), number of particles (particles), and volume of water (m3). The volume of water was calculated by Eq. (2).
$V=D \times v \times t$ (2)
where, D, v, and t are the cross-sectional area of the trawl mouth opening (m2), v is an average speed of current (m/s), and time (s).
The obtained data were analyzed descriptively by statistics using the mean value and standard deviation (represented by error bars) from triplicate analysis. The association between microplastic abundances and the population served by municipal solid waste management (MSWM) were analyzed using Spearman’s correlation with a significant level of <0.05 because the data were not normally distributed according to Saphiro-Wilk test.
3.1 Microplastic abundances and waste service coverage
The abundances of microplastics found from all sites are summarized in Figure 2, suggesting microplastic contamination in the urban waters of rivers in Greater Semarang. The variations in the abundances ranging 1.1-9.6 particles/m3 are relatively high. In Indonesia, the abundance of microplastics has been found to be higher in the Greater Semarang River than in the Metro River in East Java [22], and the abundance is lower in Greater Semarang River than in the Ganges River in India [23]. Figure 2 shows microplastic abundance and population densities that are served by municipal solid waste management (MSWM) at sites in the Greater Semarang Area. The results of the correlation analysis showed p-values of >0.05, indicating the insignificant correlations between microplastic abundances and waste services in the areas studied. KT-3, which is located downstream of the river, showed a higher abundance of microplastics (9.6 particles/m3) compared with the other stations, which was likely caused by accumulation of anthropogenic waste from its densely populated settlements. It should be noted that the residents in Semarang City is permanent resident.
Figure 2. The microplastic abundances (particles/m3) and population served by municipal solid waste management, MSWM (per km2)
It is worth noting that the population of Semarang City is predominantly composed of permanent residents. This demographic characteristic is an important factor to consider in the context of our study, as it may impact the overall quantity and distribution of microplastics within the watershed. By acknowledging the permanent nature of the local population, we aim to provide a more comprehensive understanding of the potential sources and pathways of microplastic pollution in the area.
Through our sampling efforts, we were able to identify microplastics that may have originated from direct dumping of waste into the river. However, it should be noted that more sampling campaigns are needed to strengthen the evidence in the near future studies. The presence of these microplastics highlights the potential impact of improper waste disposal practices on aquatic ecosystems, and underscores the need for effective waste management strategies to prevent further pollution of our natural waterways.
Human activity is directly proportional to the amount of waste produced, and human settlements around the river facilitate the direct disposal of their wastes into the river. The percentage of the population served by municipal solid waste management services (MSWM) is relatively high (85%) in KT-3 sub-watershed area; however, it has a high abundance of microplastics. Meanwhile, BB-1 which has the highest coverage of waste management service (90%) exhibited a low microplastic abundance. Thus, the distribution of microplastics is influenced not only by waste service but also by hydrological conditions such as river discharges, rainfall, and riverbank vegetation. Low microplastic abundance is generally caused by long immersion times and high flow rates of the river [24]. Meanwhile, microplastic concentrations are high in areas exposed often to currents [25]. In addition, Wessel et al. [26] have suggested that areas with high population activities tend to have higher microplastic abundances.
Globally, the abundance of MPs exhibited a range of ten orders of magnitude (10-3-106 particles/m3) among the various water samples [27]. Multiple studies have demonstrated that the utilization of a plankton net with a mesh size of 333 μm for sampling purposes has been associated with a decreased presence of microplastics [27]. Nevertheless, opting for the trawling method, as opposed to collecting bulk samples, enables the collection of significantly larger sample volumes [28]. Consequently, in this study, we employed a plankton net with a mesh size of 300 μm and proceeded to compare microplastic abundances with those reported in other regions.
In the Saigon River, Vietnam, microplastics were identified slightly higher at concentrations ranging from 10 to 223 particles/m3. In other regions, our findings showed microplastic abundances that were roughly within the same order of magnitude, provided that the trawling mesh size was approximately similar, or instance, in Swiss Rivers (7 particles/m3) [29], Los Angeles (<1 - 153 particles/m3) [30], Rhine River (4.96 particles/m3) [31]. These findings underscore the significant influence of sampling methods and strategies on microplastic detection. Notably, in developed countries, microplastic levels were found to be comparable to those in developing countries, particularly when the particle sizes were similar.
3.2 Shapes, colors, and sizes of microplastics
Figure 3 summarizes the microplastic shapes found. The results show that the microplastic shapes found in the rivers of Greater Semarang are more diverse than those found in the rivers of Brantas and East Java, which contained only fibers, films, and pellets [32], whereas its rivers contained fragments, films, foam, beads, and fibers. Figure 3 shows representative microscopic images of the five microplastic shapes.
The microplastics found in the rivers of Greater Semarang showed certain shapes, features, and characteristics. The shapes of fragments that are derived from large plastic pieces are rectangular and irregular [33]. Beads have irregular shapes, which are primarily generated from body care products. The foams are generally white and round and are floating microplastic particles. However, in this study, we found the foam was already irregular shapes and slightly black. At all stations, sheets comprised a greater proportion of the microplastics found, accounting for 14%-75% of total microplastics (Figure 4a). BB-1, BB-2, KT-2, and KT-3 showed sheet compositions of ≥25%, which are likely from secondary sources (e.g., degradation of plastic bags used in daily activities) [34]. The amount of microplastic fragments is quite high, accounting for 29%-67%, which is likely from a secondary source caused by the fragmentation of mesoplastics. In addition, microplastic fragments have been found to originate from cosmetic products [35]. Meanwhile, the fiber proportion ranging for 6%-29% which may originate from laundry wastewater or fishing rope. Among all the microplastic shapes, foam was the smallest contributor, and it was found only in KT-1 and KT-2 with proportions ranging 6%-14%. Foam is usually used in thermal insulation, packaging or packing, and manufacturing products [26]. Beads are the primary microplastics, because their particle formation mechanism is made intentionally and specifically to create certain sizes for specific purposes in industrial and domestic operations. Meanwhile, fragments, sheets, fibers, and foams are the secondary microplastics, because their formation mechanisms are not designed for a specific purpose; thus, they are formed by the degradation of plastic products by sunlight and erosive actions of wind and water flow [16].
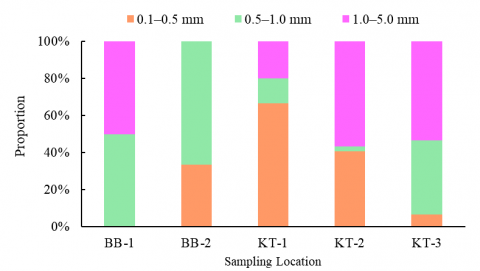
We classified microplastics found in our study area based on their sizes: 0.1-0.5, 0.5-1, and 1-5 mm (Figure 4b). The 0.5-1 mm microplastic size range showed the largest proportion (3%-67% of the total microplastics) among the other size ranges, and it was followed consecutively by 0.1-0.5 mm (7%-67%) and 1-5 mm (20%-57%) (Figure 4b). Small size of microplastics is caused by the process of degradation of large fragments into smaller ones due to exposure to abiotic factors such as ultraviolet (UV) light, heat, mechanical and/or chemical abrasion [36]. The distribution and transit of microplatics in the environment are significantly influenced by their different sizes (Table 2).
Our methods can reveal the abundance for microplastic size of 0.17 mm (yellow beads). However, FTIR could not detect the polymer spectrum due to small size and may need other methods to detect. Microplastics degraded into small particles can serve as carriers of other pollutants, and when consumed by aquatic organisms, they can cause severe impacts [37].
Table 2. Sub-watershed characteristics based on the population served by the waste management services
|
Sampling Location |
District |
Watershed Area (km2) |
Population Density (Per km2) |
Proportion Served by MSWM |
Population Served |
Total Per Sub-Watershed |
Population Density Served (Per km2) |
Microplastic Abundance (Particles/m3) |
|
BB-1 |
Banyumanik |
0.4 |
4776.90 |
100%1) |
1,846 |
12,600 |
4,069 |
3.1 |
|
Gajah Mungkur |
0.1 |
6018.11 |
100%1) |
628 |
||||
|
Gunung Pati |
0.3 |
1682.17 |
38%1) |
217 |
||||
|
Tembalang |
2.3 |
4805.74 |
91%1) |
9,909 |
||||
|
BB-2 |
Banyumanik |
2.0 |
4776.90 |
100%1) |
9,550 |
119,311 |
1,535 |
1.2 |
|
Bergas |
13.3 |
1603.79 |
25%2) |
5,322 |
||||
|
Gajah Mungkur |
0.1 |
6018.11 |
100%1) |
628 |
||||
|
Gunung Pati |
5.7 |
1682.17 |
38%1) |
3,654 |
||||
|
Mranggen |
20.5 |
2433.15 |
35%3) |
17,497 |
||||
|
Tembalang |
16.6 |
4805.74 |
91%1) |
72,394 |
||||
|
Ungaran Timur |
19.6 |
2099.60 |
25%2) |
10,266 |
||||
|
KT-1 |
Gajah Mungkur |
1.7 |
6018.11 |
100%1) |
10,504 |
57,000 |
3,682 |
1.1 |
|
Mranggen |
3.9 |
2433.15 |
35%3) |
3,284 |
||||
|
Tembalang |
9.9 |
4805.74 |
91%1) |
43,212 |
||||
|
KT-2 |
Gajah Mungkur |
1.7 |
6018.11 |
100%1) |
10,504 |
62,444 |
3,736 |
3.9 |
|
Mranggen |
3.9 |
2433.15 |
35%3) |
3,284 |
||||
|
Pedurungan |
0.0 |
9149.89 |
76%1) |
147 |
||||
|
Tembalang |
11.1 |
4805.74 |
91%1) |
48,510 |
||||
|
KT-3 |
Gajah Mungkur |
1.7 |
6018.11 |
100%1) |
10,504 |
64,702 |
3,755 |
9.6 |
|
Mranggen |
3.9 |
2433.15 |
35%3) |
3,284 |
||||
|
Pedurungan |
0.0 |
9149.89 |
76%1) |
147 |
||||
|
Tembalang |
11.6 |
4805.74 |
91%1) |
50,768 |
(1) Obtained from COWI [38]; (2) Estimated using ratio of solid waste generated [39] and transported [40]. The density was obtained from Damanhuri and Padmi [41]; (3) Estimated using ratio of solid waste generated and transported [42].
|
(a) fragment |
|
|
(b) sheet |
(c) foam |
|
(d) beads |
(e) fibers |
Figure 3. Representative microscopic images of typical microplastics obtained from the urban waters of Greater Semarang River
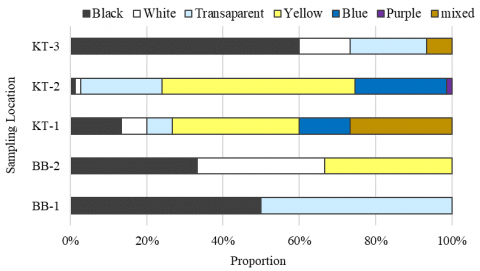
Microplastics with <0.5 mm sizes were difficult to extract fully and monitor. The microplastic sizes may also affect the microplastic abundance in the environment. The considered color categories of microplastics found in the rivers of Greater Semarang are black, yellow, white, transparent, blue, purple, and mixed (Figure 4c), indicating the various sources of the microplastics. The most dominant color is black (1%-60% of the total microplastics) in all stations, followed by yellow (33%-51%), transparent (9%-50%), white (1%-33%), mixed (7%-36%), blue (18%-24%), and purple (about 1%). The black color is possibly caused by the original color of a plastic before degradation or the absorption by microplastics of many pollutants and other organic materials.
It is possible that black microplastics may be more common in certain environments because black plastic is more likely to absorb light. The black plastic bag is common color of single-use plastic bag in Indonesia, particularly for middle-low income population Additionally, black plastic may be more likely to be mistaken for food by marine animals, leading to greater ingestion of this type of plastic, increasing the chance of microplastic entering the human food chain. Color of a microplastic can fade, wear out, or turn white due to heat, light, and standing water; thus, white microplastics are common and can be found in high proportions [43].
3.3 Polymer identification in microplastics
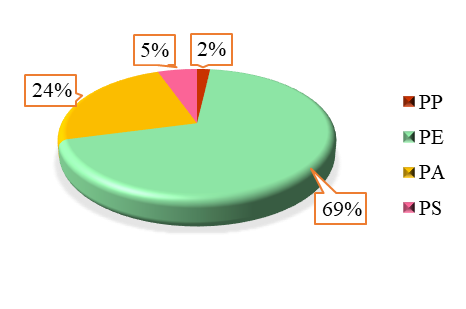
Based on the FT-IR measurements, several types of microplastic polymers including polyamide (PA), polypropylene (PP), polyethylene (PE), and polystyrene (PS) polymers were found, and they are summarized in Figure 5. The proportions of PE, PA, PS, and PP are 69%, 24%, 5%, and 2%, respectively, in the microplastics. The prevalence of PE in this study is in agreement with the finding of majority polymer of plastic debris in the KT River [15].
(a) shape
(b) size
(c) color
Figure 4. Percentage of microplastic concentration found in the urban waters of Greater Semarang River
PE is a dominant polymer in body care products; thus, the proportion of this polymer is high compared with the other polymers. PE can be found in all body care products because these polymers have the ability to dissolve solids or increase oil viscosity in a product [44]. Moreover, PEs are sourced from single-use plastic bags, shampoo bottles, toys, and plastic bottles, whereas PEs are from various packaging (e.g., food), straws, bottle caps, ropes, and carpets [45].
PA, also known as nylon, is used in textiles, fishing nets, and industrial applications. It can release toxic additives and monomers during breakdown, potentially affecting aquatic life [46]. The presence of PA microplastics indicates contributions from textile [47] and fishing gear [48]. The textile may come from the domestic wastewater (clothes washing) directly discharge into the river. PS is used in packaging materials, disposable cutlery, and foam products. It can break down into smaller fragments [49], which can be mistaken for food by marine organisms. Ingestion of PS microplastics can harm marine life and potentially enter the food chain [49]. The abundance of PS microplastics suggests inadequate waste management practices, including poor disposal of single-use items. PP is found in various products like food containers, straws, and textiles. It is relatively lightweight and can easily become airborne, contributing to microplastic pollution in terrestrial and aquatic environments. PP microplastics can adsorb toxic chemicals from the surrounding environment, leading to potential impacts on organisms that ingest them [50].
Figure 5. Typical FT-IR spectra of microplastics selected randomly from the urban waters of Greater Semarang River and their percentage contributions
The prevalent color of polyethylene (PE) microplastics in this study was black, which is a common color used in the production of single-use plastic bags in Indonesia due to their low cost. Environmental awareness has been shown to exist in Indonesia, as reported by a previous study [51]. However, this study did not report on the economic and educational levels of the respondents. Despite the implementation of the plastic bag levy and conversion to reusable bags, the leakage of plastic bags into the environment remains a significant concern, particularly in Semarang, as noted by Sarminingsih et al. [15]. Over time, plastic waste undergoes degradation processes like oxidation, photodegradation, and hydrolysis, breaking down into microplastics [52]. The presence of abundant microplastics in this environment has been observed to negatively impact the ecosystem [53, 54]. The impact of plastic pollution on human health remains a subject of debate [55, 56]. However, alarming discoveries of microplastic particles in various human body parts, such as blood [57], lungs [58], placenta [59], and breast milk [60], cannot be ignored. This indicates that plastic has entered the human food chain [61], and even the air we breathe [62], capable of reaching human tissues. Therefore, it is necessary to educate the community about the benefits of sustainable waste management, including the economic advantages of recycling plastic waste. To achieve sustainable waste management, financial support and community participation should be increased [63].
Urban waters in the rivers of Greater Semarang Area are found to be polluted by microplastics. The most downstream point of KT River showed the highest abundance of microplastics among all the identified sampling stations. The microplastic abundance in Greater Semarang Area were similar to Swiss River and Rhine River with the similar sampling methods. In all stations, the shapes of fragments, sheets, foam, beads, and fibers for microplastics are observed, and the most dominant microplastic size range is 0.5-1 mm. The colors of the microplastics include black, yellow, white, transparent, blue, purple, and mixed, and the types of microplastic polymers are PE, PA, PS, and PP. The ATR-FTIR spectra show that PE was the highest type of polymer that may be associated with the single-use plastic bags, emphasizing that black plastic sheet was also dominated. Different polymers have varying degrees of persistence and potential to adsorb pollutants, which affects their potential impacts on both ecosystems and human health. In terms of health, these microplastics can enter the food chain when ingested by aquatic organisms, potentially reaching humans through seafood consumption. The long-term health effects of consuming microplastics are still being studied, but there are concerns about the potential transfer of toxic substances associated with plastics to humans.
It is imperative to acknowledge that further research is necessary to comprehend the full extent of the potential health risks associated with microplastics and to identify the optimal measures to mitigate these risks. However, in the interim, it is crucial to take action to minimize the amount of plastic that is released into the environment to reduce the overall abundance of microplastics. Urgent measures must be taken to develop effective and sustainable waste management strategies to reduce the discharge of microplastics into the environment. The strategy should involve a combination of plastic reduction, improved waste management infrastructure, regulatory measures, and continuous research and monitoring. Addressing these strategies' challenges requires a collaborative effort involving governments, industries, communities, and scientific experts to safeguard the health of aquatic ecosystems and the overall environment. This research contributes evidence that the plastic reduction, mainly single-use plastic bag reduction in supermarket and minimarket, is not enough to reduce the microplastic abundance.
Although the current municipal solid waste management (MSWM) practices may help to minimize plastic leakage into rivers, the insignificant Spearman's correlation found in this study underscores the need for further research to verify these results. Therefore, it is crucial to undertake additional research to improve our understanding of the impact of existing MSWM practices and to identify ways to further reduce plastic waste leakage.
We thank Institute for Research and Community Service (LPPM) of the Diponegoro University for funding under the International Publication Research Grant (No. 569-160/UN7.D2/PP/V/2023). We appreciate all supports from students, particularly Ms. Bella Despasari, Ms. Rahma Safitri, and Ms. Vina Rofikoh.
[1] Cordova, M.R., Purwiyanto, A.I.S., Suteja, Y. (2019). Abundance and characteristics of microplastics in the northern coastal waters of Surabaya, Indonesia. Marine Pollution Bulletin, 142: 183-188. https://doi.org/10.1016/j.marpolbul.2019.03.040
[2] Law, K.L., Morét-Ferguson, S.E., Goodwin, D.S., Zettler, E.R., DeForce, E., Kukulka, T., Proskurowski, G. (2014). Distribution of surface plastic debris in the eastern Pacific Ocean from an 11-year data set. Environmental Science & Technology, 48(9): 4732-4738. https://doi.org/10.1021/es4053076
[3] Rodrigues, J.P., Duarte, A.C., Santos-Echeandía, J., Rocha-Santos, T. (2019). Significance of interactions between microplastics and POPs in the marine environment: A critical overview. TrAC Trends in Analytical Chemistry, 111: 252-260. https://doi.org/10.1016/j.trac.2018.11.038
[4] Campanale, C., Massarelli, C., Savino, I., Locaputo, V., Uricchio, V.F. (2020). A detailed review study on potential effects of microplastics and additives of concern on human health. International Journal of Environmental Research and Public Health, 17(4): 1212. https://doi.org/10.3390/ijerph17041212
[5] Lusher, A.L., O'Donnell, C., Officer, R., O'Connor, I. (2016). Microplastic interactions with North Atlantic mesopelagic fish. ICES Journal of Marine Science, 73(4): 1214-1225. https://doi.org/10.1093/icesjms/fsv241
[6] Niaounakis, M. (2017). Degradation of plastics in the marine environment. In Management of Marine Plastic Debris, pp. 127-142. https://doi.org/10.1016/B978-0-323-44354-8.00003-3
[7] Law, K.L., Starr, N., Siegler, T.R., Jambeck, J.R., Mallos, N.J., Leonard, G.H. (2020). The United States’ contribution of plastic waste to land and ocean. Science Advances, 6(44): eabd0288. https://doi.org/10.1126/sciadv.abd0288
[8] Lebreton, L.C., Van Der Zwet, J., Damsteeg, J.W., Slat, B., Andrady, A., Reisser, J. (2017). River plastic emissions to the world’s oceans. Nature Communications, 8(1): 15611. https://doi.org/10.1038/ncomms15611
[9] Sari, M.M., Andarani, P., Notodarmojo, S., Harryes, R.K., Nguyen, M.N., Yokota, K., Inoue, T. (2022). Plastic pollution in the surface water in Jakarta, Indonesia. Marine Pollution Bulletin, 182: 114023. https://doi.org/10.1016/j.marpolbul.2022.114023
[10] Ardhianie, N., Daniel, D., Purwanto, P., Kismartini, K. (2022). Jakarta water supply provision strategy based on supply and demand analysis. H2Open Journal, 5(2): 221-233. https://doi.org/10.2166/h2oj.2022.076
[11] Singh, S., Bhagwat, A. (2022). Microplastics: A potential threat to groundwater resources. Groundwater for Sustainable Development, 100852. https://doi.org/10.1016/j.gsd.2022.100852
[12] Singh, S., Trushna, T., Kalyanasundaram, M., Tamhankar, A.J., Diwan, V. (2022). Microplastics in drinking water: A macro issue. Water Supply, 22(5): 5650-5674. https://doi.org/10.2166/ws.2022.189
[13] Suteja, Y., Atmadipoera, A.S., Riani, E., Nurjaya, I.W., Nugroho, D., Cordova, M.R. (2021). Spatial and temporal distribution of microplastic in surface water of tropical estuary: Case study in Benoa Bay, Bali, Indonesia. Marine Pollution Bulletin, 163: 111979. https://doi.org/10.1016/j.marpolbul.2021.111979
[14] Wulandari, A.A. (2021). Design of recreational inland port of banjir kanal timur semarang.
[15] Sarminingsih, A., Andarani, P., Nugraha, W.D. (2022). Developing a visual counting method to quantify riverine plastic litter: A case study of rivers in Semarang City, Indonesia. In IOP Conference Series: Earth and Environmental Science, 1098(1): 012050. https://doi.org/10.1088/1755-1315/1098/1/012050
[16] Khoironi, A., Hadiyanto, H., Anggoro, S., Sudarno, S. (2020). Evaluation of polypropylene plastic degradation and microplastic identification in sediments at Tambak Lorok coastal area, Semarang, Indonesia. Marine Pollution Bulletin, 151: 110868. https://doi.org/10.1016/j.marpolbul.2019.110868
[17] Shafani, R.H., Nuraini, R.A.T., Endrawati, H. (2022). Identifikasi dan kepadatan mikroplastik di sekitar muara sungai banjir kanal barat dan banjir kanal timur, Kota Semarang, Jawa Tengah. Journal of Marine Research, 11(2): 245-254. https://doi.org/10.14710/jmr.v11i2.31885
[18] Laila, Q.N., Purnomo, P.W., Jati, O.E. (2020). The abundance of microplastics in sediment at the coast of Mangunharjo Village, Tugu District, Semarang. Jurnal Pasir Laut, 4: 28-35.
[19] Geospatial Information Agency of Indonesia. (2018). Seamless digital elevation model (DEM) and National bathymetry. Geospatial Information Agency.
[20] Ministry of Environment of Japan. (2021). Riverine microplastic survey guidelines. Tokyo.
[21] Kobayashi, T., Yagi, M., Kawaguchi, T., Hata, T., Shimizu, K. (2021). Spatiotemporal variations of surface water microplastics near Kyushu, Japan: A quali-quantitative analysis. Marine Pollution Bulletin, 169: 112563. https://doi.org/10.1016/j.marpolbul.2021.112563
[22] Sari, S.P., Kartikaningsih, H., Yanuar, A.T., Kurniawan, A. (2022). Analysis of microplastics in water and biofilm matrices in Metro River, East Java, Indonesia. The Journal of Experimental Life Science, 12(1): 23-29. https://doi.org/10.21776/ub.jels.2022.012.01.04
[23] Singh, N., Mondal, A., Bagri, A., Tiwari, E., Khandelwal, N., Monikh, F.A., Darbha, G.K. (2021). Characteristics and spatial distribution of microplastics in the lower Ganga River water and sediment. Marine Pollution Bulletin, 163: 111960. https://doi.org/10.1016/j.marpolbul.2020.111960
[24] Wu, F., Pennings, S.C., Tong, C., Xu, Y. (2020). Variation in microplastics composition at small spatial and temporal scales in a tidal flat of the Yangtze Estuary, China. Science of The Total Environment, 699: 134252. https://doi.org/10.1016/j.scitotenv.2019.134252
[25] Wessel, C.C., Lockridge, G.R., Battiste, D., Cebrian, J. (2016). Abundance and characteristics of microplastics in beach sediments: Insights into microplastic accumulation in northern Gulf of Mexico estuaries. Marine Pollution Bulletin, 109(1): 178-183. https://doi.org/10.1016/j.marpolbul.2016.06.002
[26] Wen, X., Du, C., Xu, P., Zeng, G., Huang, D., Yin, L., Yin, O., Hu, L., Wan, J., Zhang, J., Tan, S., Deng, R. (2018). Microplastic pollution in surface sediments of urban water areas in Changsha, China: Abundance, composition, surface textures. Marine Pollution Bulletin, 136: 414-423. https://doi.org/10.1016/j.marpolbul.2018.09.043
[27] Tan, Y., Dai, J., Xiao, S., Tang, Z., Zhang, J., Wu, S., Wu, X., Deng, Y. (2023). Occurrence of microplastic pollution in rivers globally: Driving factors of distribution and ecological risk assessment. Science of The Total Environment, 904: 165979. https://doi.org/10.1016/j.scitotenv.2023.165979
[28] Mendoza, L.M.R., Balcer, M. (2019). Microplastics in freshwater environments: A review of quantification assessment. TrAC Trends in Analytical Chemistry, 113: 402-408. https://doi.org/10.1016/j.trac.2018.10.020
[29] Faure, F., Demars, C., Wieser, O., Kunz, M., De Alencastro, L.F. (2015). Plastic pollution in Swiss surface waters: Nature and concentrations, interaction with pollutants. Environmental Chemistry, 12(5): 582-591. https://doi.org/10.1071/EN14218
[30] Moore, C.J., Lattin, G.L., Zellers, A.F. (2011). Quantity and type of plastic debris flowing from two urban rivers to coastal waters and beaches of Southern California. Revista de Gestão Costeira Integrada-Journal of Integrated Coastal Zone Management, 11(1): 65-73.
[31] Mani, T., Hauk, A., Walter, U., Burkhardt-Holm, P. (2015). Microplastics profile along the Rhine River. Scientific Reports, 5(1): 17988. https://doi.org/10.1038/srep17988
[32] Buwono, N.R., Risjani, Y., Soegianto, A. (2021). Distribution of microplastic in relation to water quality parameters in the Brantas River, East Java, Indonesia. Environmental Technology & Innovation, 24: 101915. https://doi.org/10.1016/j.eti.2021.101915
[33] Ter Halle, A., Ladirat, L., Gendre, X., Goudouneche, D., Pusineri, C., Routaboul, C., Tenailleau, C., Duployer., B., Perez, E. (2016). Understanding the fragmentation pattern of marine plastic debris. Environmental Science & Technology, 50(11): 5668-5675. https://doi.org/10.1021/acs.est.6b00594
[34] Ding, J., Jiang, F., Li, J., Wang, Z., Sun, C., Wang, Z., Sun, C., Wang, Z., Fu, L., Ding, N.X., He, C. (2019). Microplastics in the coral reef systems from Xisha Islands of South China Sea. Environmental Science & Technology, 53(14): 8036-8046. https://doi.org/10.1021/acs.est.9b01452
[35] Ballent, A., Corcoran, P.L., Madden, O., Helm, P.A., Longstaffe, F.J. (2016). Sources and sinks of microplastics in Canadian Lake Ontario nearshore, tributary and beach sediments. Marine Pollution Bulletin, 110(1): 383-395. https://doi.org/10.1016/j.marpolbul.2016.06.037
[36] Andrady, A.L., Barnes, P.W., Bornman, J.F., Gouin, T., Madronich, S., White, C.C., Zepp, R.G., Jansen, M.A.K. (2022). Oxidation and fragmentation of plastics in a changing environment; from UV-radiation to biological degradation. Science of The Total Environment, 851: 158022. https://doi.org/10.1016/j.scitotenv.2022.158022
[37] Huerta Lwanga, E., Gertsen, H., Gooren, H., Peters, P., Salánki, T., Van Der Ploeg, M., Besseling, E., Koelmans., A.A., Geissen, V. (2016). Microplastics in the terrestrial ecosystem: Implications for Lumbricus terrestris (Oligochaeta, Lumbricidae). Environmental Science & Technology, 50(5): 2685-2691. https://doi.org/10.1021/acs.est.5b05478
[38] COWI. (2018). Master plan revision of municipal solid waste management in Semarang City. Semarang City.
[39] Indonesian Ministry of Environment and Forestry. (2022). SIPSN - National Waste Management Information System.
[40] Semarang Regency Statistics Indonesia. (2022). Waste transported from sources. Https://SemarangkabBpsGoId/Indicator/152/45/1/Banyaknya-Sampah-Yang-Terangkut-per-BulanHtml.
[41] Damanhuri E, Padmi, T. (2018). Pengelolaan Sampah Terpadu. Penerbit ITB.
[42] Demak Environmental Agency. (2020). Open Data - Demak regency. http://DataDemakkabGoId/Id/User/Dinlh.
[43] Zhu, K., Jia, H., Zhao, S., Xia, T., Guo, X., Wang, T., Zhu, L. (2019). Formation of environmentally persistent free radicals on microplastics under light irradiation. Environmental Science & Technology, 53(14): 8177-8186. https://doi.org/10.1021/acs.est.9b01474
[44] Akanyange, S.N., Zhang, Y., Zhao, X., Adom-Asamoah, G., Ature, A.R.A., Anning, C., Tianpeng, C., Zhao, H., Lyu, X., Crittenden, J.C. (2022). A holistic assessment of microplastic ubiquitousness: Pathway for source identification in the environment. Sustainable Production and Consumption, 33: 113-145. https://doi.org/10.1016/j.spc.2022.06.020
[45] Natesan, U., Vaikunth, R., Kumar, P., Ruthra, R., Srinivasalu, S. (2021). Spatial distribution of microplastic concentration around landfill sites and its potential risk on groundwater. Chemosphere, 277: 130263. https://doi.org/10.1016/j.chemosphere.2021.130263
[46] Cole, M., Coppock, R., Lindeque, P.K., Altin, D., Reed, S., Pond, D.W., Sørensen, L., Galloway, T.S., Booth, A.M. (2019). Effects of nylon microplastic on feeding, lipid accumulation, and moulting in a coldwater copepod. Environmental Science & Technology, 53(12): 7075-7082. https://doi.org/10.1021/acs.est.9b01853
[47] Karbalaei, S., Hanachi, P., Walker, T.R., Cole, M. (2018). Occurrence, sources, human health impacts and mitigation of microplastic pollution. Environmental Science and Pollution Research, 25: 36046-36063. https://doi.org/10.1007/s11356-018-3508-7
[48] Dantas, D.V., Barletta, M., Da Costa, M.F. (2012). The seasonal and spatial patterns of ingestion of polyfilament nylon fragments by estuarine drums (Sciaenidae). Environmental Science and Pollution Research, 19: 600-606. https://doi.org/10.1007/s11356-011-0579-0
[49] Turner, A. (2020). Foamed polystyrene in the marine environment: Sources, additives, transport, behavior, and impacts. Environmental Science & Technology, 54(17): 10411-10420. https://doi.org/10.1021/acs.est.0c03221
[50] Montero, D., Rimoldi, S., Torrecillas, S., Rapp, J., Moroni, F., Herrera, A., Gómez, M., Fernández-Montero, A., Terova, G. (2022). Impact of polypropylene microplastics and chemical pollutants on European sea bass (Dicentrarchus labrax) gut microbiota and health. Science of the Total Environment, 805: 150402. https://doi.org/10.1016/j.scitotenv.2021.150402
[51] Tyllianakis, E., Ferrini, S. (2021). Personal attitudes and beliefs and willingness to pay to reduce marine plastic pollution in Indonesia. Marine Pollution Bulletin, 173: 113120. https://doi.org/10.1016/j.marpolbul.2021.113120
[52] Kameda, Y., Yamada, N., Fujita, E. (2021). Source-and polymer-specific size distributions of fine microplastics in surface water in an urban river. Environmental Pollution, 284: 117516. https://doi.org/10.1016/j.envpol.2021.117516
[53] Molina, A.M., Abril, N., Lora, A.J., Huertas-Abril, P.V., Ayala, N., Blanco, C., Moyano, M.R. (2021). Proteomic profile of the effects of low-dose bisphenol A on zebrafish ovaries. Food and Chemical Toxicology, 156: 112435. https://doi.org/10.1016/j.fct.2021.112435
[54] Schönemann, A.M., Abril, S.I.M., Diz, A.P., Beiras, R. (2022). The bisphenol a metabolite MBP causes proteome alterations in male Cyprinodon variegatus fish characteristic of estrogenic endocrine disruption. Environmental Pollution, 300: 118936. https://doi.org/10.1016/j.envpol.2022.118936
[55] Leslie, H.A., Depledge, M.H. (2020). Where is the evidence that human exposure to microplastics is safe? Environment International, 142: 105807. https://doi.org/10.1016/j.envint.2020.105807
[56] Goodman, K.E., Hare, J.T., Khamis, Z.I., Hua, T., Sang, Q.X.A. (2021). Exposure of human lung cells to polystyrene microplastics significantly retards cell proliferation and triggers morphological changes. Chemical Research in Toxicology, 34(4): 1069-1081. https://doi.org/10.1021/acs.chemrestox.0c00486
[57] Leslie, H.A., Van Velzen, M.J., Brandsma, S.H., Vethaak, A.D., Garcia-Vallejo, J.J., Lamoree, M.H. (2022). Discovery and quantification of plastic particle pollution in human blood. Environment International, 163 107199. https://doi.org/10.1016/j.envint.2022.107199
[58] Jenner, L.C., Rotchell, J.M., Bennett, R.T., Cowen, M., Tentzeris, V., Sadofsky, L.R. (2022). Detection of microplastics in human lung tissue using μFTIR spectroscopy. Science of The Total Environment, 831: 154907. https://doi.org/10.1016/j.scitotenv.2022.154907
[59] Ragusa, A., Svelato, A., Santacroce, C., et al. (2021). Plasticenta: First evidence of microplastics in human placenta. Environment International, 146: 106274. https://doi.org/10.1016/j.envint.2020.106274
[60] Ragusa, A., Notarstefano, V., Svelato, A., Belloni, A., Gioacchini, G., Blondeel, C., Zucchelli, E., De Luca, C., D’Avino, S., Gulotta, A., Carnevali, O., Giorgini, E. (2022). Raman microspectroscopy detection and characterisation of microplastics in human breastmilk. Polymers, 14(13): 2700. https://doi.org/10.3390/polym14132700
[61] Petrlik, J., Ismawati, Y., DiGangi, J., Arisandi, P., Bell, L., Beeler, B. (2019). Plastic waste poisons Indonesia’s food chain. IPEN (International Pollutants Elimination Network).
[62] Syafina, P.R., Yudison, A.P., Sembiring, E., Irsyad, M., Tomo, H.S. (2022). Identification of fibrous suspended atmospheric microplastics in Bandung Metropolitan Area, Indonesia. Chemosphere, 308: 136194. https://doi.org/10.1016/j.chemosphere.2022.136194
[63] Joseph, K. (2006). Stakeholder participation for sustainable waste management. Habitat International, 30(4): 863-871. https://doi.org/10.1016/j.habitatint.2005.09.009