Chemseddine Derbal![]() | Adel Djellali
| Adel Djellali![]() | Moussa Attia*
| Moussa Attia*![]() | Fares Zaamouche
| Fares Zaamouche![]() | Anissa Belkhiri
| Anissa Belkhiri![]()
© 2023 IIETA. This article is published by IIETA and is licensed under the CC BY 4.0 license (http://creativecommons.org/licenses/by/4.0/).
OPEN ACCESS
Optimizing fragmentation in mining operations is a multifaceted challenge, compounded by natural and induced fractures, cleavage, and the inevitable approximations in blast design parameters. Current research predominantly emphasizes the optimization of mining progression with respect to power and grade distribution; however, the dynamic behavior of fractures within the rock mass also plays a crucial role. These fractures not only impact the rock mass stability but also dictate the choice of blasting techniques. This study aims to enhance the control over blasting outcomes by incorporating the evolution of fractures, thereby improving the technical efficiency, economic viability, and safety of mining operations. We apply geometric modeling that utilizes digital cartography and stereography to account for these evolving fractures. The primary goal is to reduce oversized material volume, hence contributing to more sustainable mining practices. We illustrate our approach with a case study at the Aïn El Kebira limestone quarry in Setif province, northeastern Algeria, where we measure rock fragmentation post-blasting and discuss implications for sustainable mining.
rock fragmentation, fracture dynamics, sustainable mining practices, blasting techniques, geometric modeling, digital cartography, Ain El Kebira quarry
The ever-increasing global demand for raw materials necessitates efficient utilization of mineral resources, playing a pivotal role in the economic prosperity of nations worldwide [1]. Mining enterprises are tasked with maximizing resource extraction while navigating diverse technical, economic, and human considerations.
The science and art of blasting for rock fragmentation in mining has evolved dramatically. Historically, chemists played a crucial role in developing stable, powerful explosives and tailoring mixtures for specific applications. Recent years have seen intensified research driven by the need to minimize blasting costs and enhance fragmentation quality. This research encompasses advancements in computer modeling, explosive formulation, and high-speed photography [2]. Despite these efforts, achieving precise control over fragmentation variables remains a significant challenge [3].
The advent of high-powered computers has spurred research into continuous, discontinuous, and continuous-discontinuous models to simulate fracturing and fragmentation. Some researchers have adopted a micro-static approach to analyze solid explosive fracturing and fragmentation [4]. Although numerous numerical models exist, they still struggle to provide reliable and accurate predictions of particle size distribution based on rock geometry, mechanical, and physical properties [5].
For example, in the Krivoï-Rog quarries, rocks with a hardness of f=12 or higher typically yield minimal oversized fractions (less than 0.5%), while the -400mm fraction accounts for 75% to 90%. For softer rocks (f<12), the percentage of these fractions can reach 92-97% [6].
Achieving consistently uniform fragmentation through blasting paves the way for implementing cyclic and continuous technologies in quarries. These technologies utilize various transportation methods within the quarry, such as excavators, rail transport, trucks, and conveyors, to move blasted ore to processing sites [7]. To justify the economic viability of combined technology, the blasted ore must contain less than 80% of the -400mm fraction [8]. The maximum economic benefit is achieved with a fraction size of -300mm, constituting 77-85% of the total [9]. Therefore, improving rock fragmentation quality is crucial for the widespread adoption of combined and future continuous technologies in quarries [10].
Several avenues exist for enhancing the technical and economic performance of drilling and blasting operations [11]. These include:
Modernizing methods and techniques for rock destruction through explosives. This includes optimizing drilling and blasting parameters, selecting efficient drilling techniques, tools, and explosives, and exploring new forms of energy-based rock destruction methods.
Developing and introducing new technologies. This encompasses innovative explosives, drill types, and associated components, along with novel drilling and blasting technologies specifically designed for quarries.
Exploring alternative forms of energy for rock destruction.
This article specifically focuses on the future prospects for modernizing drilling and blasting operations. We chose to study the mining conditions at Ain El Kebira, which primarily involves sedimentary limestone. We observe the presence of two fracturing systems and a third, diffuse system with no preferred orientation [12].
In some instances, the occurrence of oversized fractions is remarkably high, reaching up to 40%. This article draws upon meticulously analyzed data provided by CETIM (Center for the Study and Technological Services of the Construction Materials Industry), supplemented by firsthand observations, measurements, determinations, and expert reports [12]. Our blasting methodology relies on geometric modeling and utilizes original, previously unpublished formulas. This article presents a comprehensive analytical summary, incorporating a fresh scientific perspective through digital mapping to provide all essential data for its compilation [13].
This study takes into consideration the following points:
The need to fragment diversity in the practice of discrimination and contribute to strengthening the Algerian community. It also aims to address the current issues faced by Algerian limestone quarries.
The focus is on relevant studies related to fracking, drilling techniques, and sustainability outcomes. This provides a more precise scope for the literature review.
Our research tackles the critical challenge of excessive oversized materials in our mining operation (Figures 1 and 2). This issue is rooted in suboptimal energy utilization at the bench toe, hindering efficient explosive energy conversion (gas effect) [14].
To address this challenge, our study is structured around three key tasks:
Analytical Blast Design: We employ an empirical approach to analyze blast patterns and optimize their design.
Geometric Rock Mass Characterization: We leverage digital mapping technologies to obtain modern and insightful data about the rock mass geometry.
Blast Pattern Design Recommendations: Based on the findings from the first two tasks, we develop practical recommendations for improved blast pattern design.
In some areas, the estimated percentage of oversized materials reaches a staggering 40%, with a 20% median for the entire deposit (confirmed through photoplanimetry). This underscores the urgency of addressing this problem.
Figure 1. Pile displaying a high rate of oversized materials to be processed
Figure 2. Blast resulting in the fragmentation of large oversized blocks beyond the mid-range +400mm
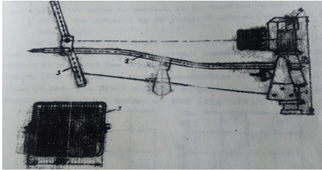
The volume of oversized materials was determined through photogrammetry, as illustrated in Figure 3:
Figure 3. Diagram of the equipment setup for capturing a photoplane image of the blasted rock slope
The planimetry measurement method is one in which the volume of oversized materials is determined as the ratio of the total surface area of the oversized pieces in the plan to the overall surface area over which the measurement is taken.
In situations where precise measurements are required within a pile of rocks, a favorable spot is photographed, and then the analysis of the photos is carried out at a specific scale. This method is referred to as photoplanimetry [15, 16].
Prior to the conception of any blasting pattern, a geometric characterization of the mining rock mass is methodologically necessary. Regarding digital mapping, where we have digitized Wülff's templates and obtained block diagrams depicting grade distribution using various modern software tools such as ArcGIS, Rockworks, Python, etc., the purpose is to [17]:
1). Precisely orient our boreholes perpendicular to the predominant (major) fracture system. 2). Choose the optimal progression direction based on grade distribution, power (which is not an issue for us, given that we are dealing with a massive deposit in a mountainous terrain), and the requirements for effective fragmentation control.
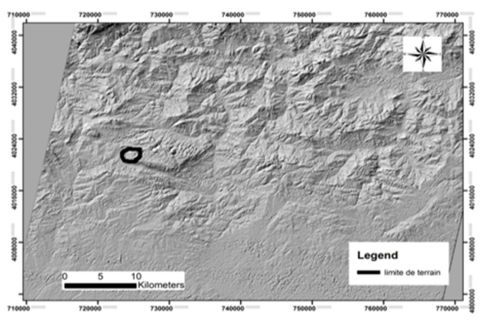
Figure 4. Digital elevation model (DEM)
For digital mapping, two topographic maps at a 1/50000 scale were used to locate the site (see Figure 4), situated in the neighboring Algerian cities of Sétif and Kherrata. A digital terrain model from digital photos was also employed to digitize the discontinuities of the deposit, including fractures and bedding joints.
The data was primarily processed using the ArcGIS and Rockworks software programs to calculate statistical parameters.
4.1 Delimitation of deposits and site location
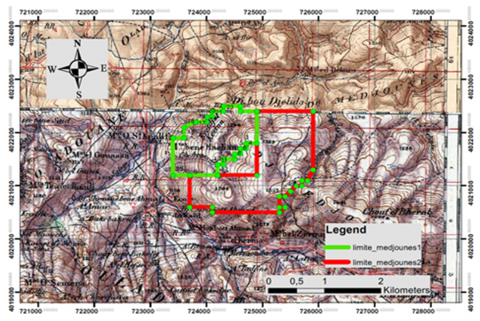
The maps were initially imported into the ArcGIS software and georeferenced to UTM WGS 84 coordinates. The property boundaries from the cement factory were added using the "Display data" function. By employing the "Add Shapefile" function, the property boundary was delineated (see Figure 5).
Figure 5. Site location map
4.2 Processing of satellite images and extraction of lineaments and discontinuities
To obtain good results, the extraction and identification of discontinuities were carried out in a semi-automated manner, involving several distinct steps:
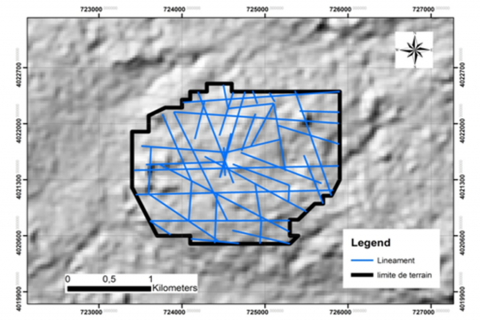
Step 1: Initially, lineaments were extracted using visual interpretation and the Hill-shade function (see Figure 6) in the ArcGIS software from the generated image of the SRTM DEM (see Figure 7).
Figure 8 displays the rose diagram depicting the orientation of lineaments resulting from the statistical analysis of digitized fracture lines using ArcGIS. Artificial elements such as tracks and other linear structures were excluded from the interpreted lineaments. The extracted lineaments were overlaid onto the satellite image for verification, and some of these lineaments were confirmed in the field. The Rockworks software was utilized to extract statistical parameters (number and length) and create the rose diagram in angular increments of 10° [18].
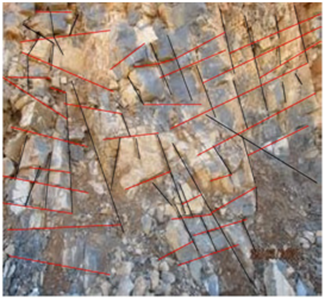
Step 2: To gather a substantial number of measurements of discontinuities (lengths, dips, directions), along with field measurements using a geological compass, photos were taken and imported into ArcGIS. By creating shapefiles, the discontinuity lines were digitized as shown in Figure 9.
The processing of statistical parameters using the Rockworks software enabled the creation of the rose diagram of directions (see Figure 10).
Figure 6. Digital elevation model (DEM) map, shaded study area
Figure 7. Map of extracted lineaments from the hill-shade function
Figure 8. Rose diagram of the lineaments extracted using the Hill-shade function
(a) Bedding joints
(b) Fractures
Figure 9. Rose diagram of discontinuities digitized from field photos and final dip
Figure 10. Rose diagram of discontinuities digitized from field photos and final dip
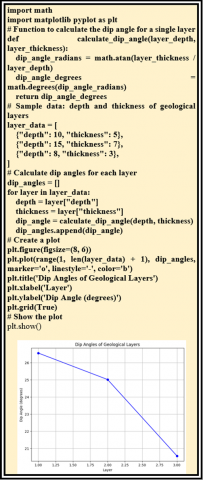
Step 3: In the absence of a software tool for calculating dips, a script was created in the PYTHON programming language within the Google COLAB environment. This allowed for the calculation of the dip angle of the layers based on the geometric data of the lines digitized on the bedding joints, namely, the coordinates x1 y1 at the beginning of a line and the coordinates x2 y2 at the end of a line (see Figure 11).
Figure 11. Python code for calculating the dip angle of layers
240 dip angles have been calculated and are listed in the following Table 1.
Step 4: Using the Rockworks software for block diagram drawing, a conceptual schema of the deposit was created based on geological surveys in the "Medjounes II" part of the deposit. An Excel file containing the coordinates of geological surveys, depth, and CaO content was imported using the "Solid" function to proceed with the schematization of the 3D terrain model showing the distribution of CaO content (see Figure 12).
Table 1. Dip angles calculated for 240 measurements
|
Angle ° |
Angle ° |
Angle ° |
Angle ° |
Angle ° |
Angle ° |
Angle ° |
Angle ° |
Angle ° |
Angle ° |
|
8 |
5 |
32 |
20 |
0 |
21 |
32 |
0 |
25 |
21 |
|
16 |
5 |
34 |
20 |
0 |
21 |
32 |
16 |
1 |
21 |
|
16 |
5 |
16 |
20 |
0 |
21 |
32 |
16 |
12 |
5 |
|
16 |
5 |
16 |
20 |
13 |
21 |
32 |
9 |
12 |
16 |
|
16 |
5 |
32 |
22 |
12 |
2 |
28 |
11 |
21 |
16 |
|
16 |
42 |
32 |
22 |
35 |
2 |
28 |
35 |
15 |
16 |
|
9 |
42 |
32 |
38 |
0 |
42 |
32 |
36 |
17 |
21 |
|
9 |
42 |
32 |
38 |
0 |
42 |
21 |
36 |
3 |
21 |
|
9 |
42 |
5 |
38 |
1 |
42 |
21 |
36 |
7 |
21 |
|
9 |
42 |
32 |
38 |
4 |
42 |
6 |
36 |
1 |
21 |
|
65 |
21 |
32 |
38 |
4 |
42 |
6 |
36 |
0 |
21 |
|
29 |
5 |
32 |
38 |
4 |
26 |
6 |
16 |
0 |
21 |
|
29 |
21 |
32 |
39 |
4 |
26 |
6 |
16 |
0 |
21 |
|
29 |
21 |
11 |
39 |
4 |
26 |
7 |
16 |
22 |
21 |
|
29 |
21 |
32 |
0 |
4 |
26 |
7 |
16 |
25 |
21 |
|
32 |
23 |
4 |
26 |
8 |
11 |
32 |
22 |
4 |
26 |
|
7 |
16 |
32 |
22 |
4 |
26 |
7 |
16 |
32 |
26 |
|
16 |
26 |
16 |
7 |
35 |
25 |
16 |
26 |
16 |
7 |
|
35 |
26 |
23 |
26 |
9 |
6 |
32 |
1 |
28 |
7 |
|
9 |
1 |
32 |
26 |
5 |
15 |
9 |
2 |
32 |
26 |
|
5 |
15 |
9 |
7 |
32 |
16 |
32 |
30 |
20 |
30 |
|
32 |
1 |
4 |
26 |
2 |
5 |
32 |
25 |
4 |
26 |
Figure 12. Block diagram illustrating the CaO content
Many referenced authors do not present a clear methodology for rock blasting under Algerian conditions. In this work, using modern digital mapping tools and reliable references from leading institutions, we are addressing the development of an explosive blasting methodology that takes into account the Algerian mining conditions [19].
Upon reviewing the existing research, it is evident that the understanding of the explosive working mechanism remains unresolved due to the lack of precise observation means for all detonation sequences and the rather complex mathematical interpretations that result. Unfortunately, explosives still remain a destructive agent when they could be an effective regulator of fragmentation [20].
5.1 Classification of methods for controlling rock fragmentation with explosives
The known methods for controlling the fragmentation of rock masses with explosives can be classified based on various factors [21]:
Adjustment through the influence of the explosion on the rock mass can be achieved by varying:
a) Specific explosive consumption calculated.
b) Diameter of the charge.
c) Type of explosive used.
d) Charge construction.
e) Orientation of the initiation of continuous charge.
f) The order of initiation of parts of the discontinuous charge.
g) Quality of stemming and its length, and more ...
During the change in the character of the charge's effect in the regulated fragmentation zone, the part of the energy transmitted in the practically unregulated fragmentation zone varies, resulting in changes in the dimensions of these zones and the intensification of fragmentation in the mass.
Adjustment of the explosive effect on the rock mass in the unregulated fragmentation zone can be achieved by the interaction of adjacent charges and groups of charges through the variation of:
a) Hole layout and the number of rows.
b) Delay intervals and the sequence of charge firing, bench height, hole layout patterns on the bench.
Methods for controlling fragmentation can be divided into two classes:
The first class relates to methods that ensure the desired level of fragmentation: specific explosive consumption, calculated diameter, and hole layout.
The second class includes methods that allow for changing the level of fragmentation in limited zones and do not exclude the flow of oversized fractions. This encompasses various methods that may reduce the volume of oversized material by 10-20%, including the use of discontinuous charges (solid, air, water stemming), charges with empty or water-filled intervals in sub-drilling or between the charge and stemming, sequential initiation of different parts, reverse initiation of continuous charges, different types of explosives with varying detonation velocities, densities, and volumetric energy concentrations, paired hole blasting, block blasting from high benches, combination of charges with different diameters and lengths, micro-delay blasting patterns, blasting in confined spaces, pre-splitting, and more.
5.2 Calculation of the blasting plan parameters
5.2.1 Theory for calculating specific explosive consumption
To improve blasting plan design, we propose a framework for choosing specific explosive consumptions and starting directions. This framework prioritizes minimizing oversize material while considering energy expenditure, rock properties, and economic feasibility. We utilize experimental blasts and data analysis to determine optimal q values for different rock types, ensuring efficient and sustainable blasting operations.
For the destruction of rock masses down to a specific particle size, a certain amount of energy needs to be expended (energy capacity, etc.). This dependency is known based on the fundamental laws of fragmentation and remains true for explosive destruction [2].
However, there are several distinguishing features between explosive fragmentation and mechanical fragmentation. Mechanical fragmentation has a two-sided force pattern (Figure 13a), whereas explosive fragmentation (except for oversize reduction and tight-space blasting) exhibits a one-sided force pattern (Figure 13b).
Figure 13. Force diagram
In mechanical fragmentation, different pieces of rock are involved, while in blasting, fractured rock masses of significant dimensions are encountered. The fissures and heterogeneity during blasting facilitate the division of large rock pieces and reduce the specific energy capacity for destruction. During blasting, fissures act as a barrier to the expansion of energy, reducing the possibility of fragmentation and often increasing the specific explosive consumption required to achieve the desired particle size [22].
The smaller the diameter of the charge, the less likely the energy expansion screen effect is between the charge and the free surface of the bench.
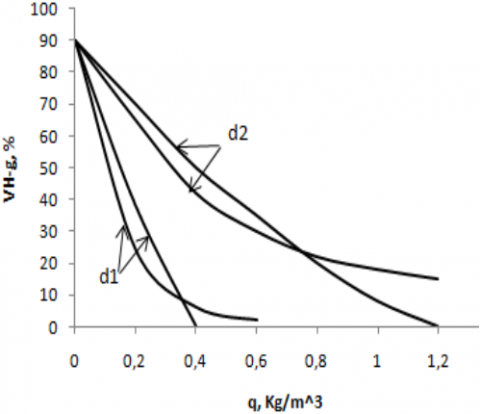
With an increase in specific explosive consumption, the degree of fragmentation in the rock mass increases more intensively over the output (Figure 14). Then comes the so-called state of saturation of the rock mass with blast energy, where it can't absorb a large amount of energy spent unnecessarily on rock dispersion. In this case, the change in fragmentation intensity remains insignificant, and the curve roughly parallels the x-axis. The curve's smoothness is also influenced by the direction of practically unregulated fragmentation [14, 15].
For a small charge diameter (d < 150mm), the curve passes lower, and in some cases, it can even reach the x-axis (in this case, the oversize output is zero). With a large charge diameter (d > 250mm), the curve passes higher, and practically, for any specific explosive consumption (q), it's impossible to achieve a zero-oversize output; in other words, there are minimum values for the oversize output, denoted as Vct and Vtc [21].
The curve intersects the y-axis at a point that represents the content of oversize material in the rock mass before blasting.
Figure 14. Dependence of the oversize output on q for different charge diameters and their rock breakability. 1-2: Oversize output from the unregulated fragmentation zone, 1_for d1, 2_for d2 [4]
Depending on the rock's fissure category and the permissible fragment size in the operations, this value can vary from 100% to 0.
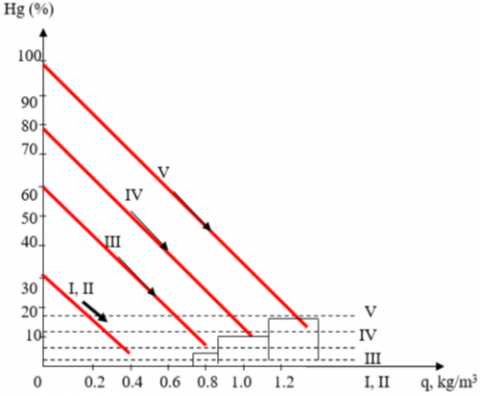
When calculating explosive consumption, it is practical to replace the curves on the graph with straight lines. In this case, the precision of the results obtained falls within the range of 15-20%, which is generally acceptable. The selection of a rational specific consumption is a techno-economic issue that is resolved based on the cost of extracting valuable minerals for all processes. However, in most cases during blasting, efforts are made to minimize the oversize output, aiming for a value close to 0%.
In the graph (Figure 15) showing the variation of q for a given charge diameter and different rocks based on their workability, the percentage of oversize blocks (dhg > 700mm) in the rock mass before blasting is plotted on the y-axis.
Figure 15. Dependency of the oversize output rate on q for different rock categories [4]
As the acceptable rock fragment size changes, the content of this fraction in the rock mass also varies. The slope angle of the lines and the flow rate of the large fractions in the non-regulated fragmentation zone change. Therefore, the threshold values for specific explosive consumption change, but the methodological principle of choosing q to ensure the minimal oversize flow remains the same [15-17].
With increasing fragment sizes, all the lines shift downward, meaning the specific explosive consumption decreases. To determine its value, if you know the content of the large fraction in the mass (the point on the line on the ordinate axis), it is necessary to carry out one or, preferably, two experimental blasts with selected different specific consumptions, plot the large fraction flow rate obtained on the graph, and connect the point on the ordinate axis to the point obtained using a straight line. By extending this line to its intersection with the line representing the minimum oversize flow rate, you can find the threshold value of q. Beyond this threshold, it is not rational to go because, in this zone, the curve of the large fractions' flow rate with varying specific consumption already levels off [20].
Most often, it is not practical to apply the specific consumptions determined in this way because they result in a broad rock pile and mining operations that are not feasible according to the technology. When carrying out experimental blasts, you should select rock blocks with similar properties based on hardness and fissuring and use a method for conducting experimental blasts developed by researchers from the Moscow Mining Institute [22].
The practical method for determining specific explosive consumptions for 234 mm diameter holes, taking into account the fissuring of the rock mass and the strength properties of its components, is based on the fundamental work of Academician Rjevsky [6]. The dependence of q on rock strength properties (hardness coefficient f) during the blasting of divisions to fragment sizes less than 100 mm is as follows:
$q=f . e . b . \sigma_c^2 0.73 \times 10^2 \times 0.349$ (1)
where, this formula is analogous to the theoretical formula by Academician Rebinder, encompassing the laws of Patinger, and Kirpitchev [6].
$K w^2=\frac{\sigma_c^2}{2 E}+\frac{S_p P_n}{V}$ (2)
The formula contains the following variables: K: A coefficient for unit conversion into the SI system; w: The specific energy consumption for rock fragmentation in J/m3; σc: The uniaxial compressive strength of the rock in Pascals (Pa); E: The rock's modulus of elasticity in Pascals (Pa); Pn: The specific surface energy in J/m2; Sp: The new surface area created in square meters (m2); V: The volume of the rock to be fragmented in cubic meters (m3).
Let us apply the notion of fragmentation coefficient Kfrag as the ratio of the surface of the block before the shot (Sn) and the surface after the shot (Sp). Afterwards, the energy expenditure equation, for the case of fragmentation at the explosive, takes the form:
$W=\frac{\sigma_c^2}{2 E}+\theta \mathrm{K}_{\mathrm{frag}}+\varepsilon$ (3)
where, θ: Coefficient taking into account energy expenditure for fragmentation; ε: Coefficient taking into account energy losses.
The processing of the results of the experimental shots made it possible to design the above formula as follows:
$W=\frac{\sigma_c^2}{2 E}+1111,004 K_{\text {frag }}+39.693$ (4)
Taking for the average conditions σc2/(2E)=11.10-4 and returning to the specific consumption taking into account the mechanical equivalent we will have :
$Q_s=25.10^{-10} \cdot \sigma_c+2.6 K_{\text {frag }}+0.093$ (5)
The dependence of the fragmentation coefficient on the limit of the rock to compression according to experimental data in the form:
$K_{\text {frag }}=20 \times 10^{-10} \sigma_c+0.0965$ (6)
The specific consumption characterizing the fragmentation of the divisions in Kg/m3:
$q_s=0.77 \times 10^{-8} \sigma_c+0.345$ (7)
Taking into account the dependencies obtained previously:
$q=q_s\left(a+b \cdot d_{\text {charg }}+d_c\right)$ (8)
We obtain :
$q=q_s\left(0.6+3.3 \times 10^{-3} \cdot d_{\text {charg }} \cdot d_c\right) \cdot\left(\frac{d_c}{d_k}\right)^{\frac{2}{5}} \cdot e \cdot\left(\frac{\rho}{2.6}\right)$ (9)
And finally:
$q=\left(0.77 \times 10^{-8} \sigma_c+0.345\right) \cdot\left(0.6+3.3 \times 10^{-3} \cdot d_{\text {charg }} \cdot d_c\right) \cdot\left(\frac{d_c}{d_k}\right)^{\frac{2}{5}} \cdot e \cdot\left(\frac{\rho}{2.6}\right)$ (10)
where, q: specific consumption calculated to obtain the required degree of rock fragmentation, Kg/m3; b: coefficient taking into account the degree of cracking of the rock; a: coefficient taking into account the energy expenditure to overcome the connections between the divisions; dc: average diameter of the division in the massif, m; dk: admissible (fixed) dimension of the piece, m; e: relative working capacity of the explosive; ρ: density of the rock, t/m3.
Based on the generalization of firing work through experience in quarries and the method proposed by researchers of the Moscow Mining Institute and the Scientific Research Institute of Ferrous Metals, a classification on the firingability of massifs of rocks was established when applying loads of Φ 250 mm and according to which it is recommended to choose the specific consumption of the explosive (Table 2).
Table 2. Rock classification based on drillability for quarries
|
Category (Class) of Rocks According to Drawability |
Calculated Specific Consumption, Kg/m3 |
Distance between Natural Cracks of all Systems in the Massif, m |
Content of Divisions in the Massif (%), Size |
Compressive Strength of Rock, Pa |
Rock Density, t/m3 |
Approximate Categories (Group) of Rocks |
|||
|
Class Limit |
Class Average |
+500 |
+1500 |
According to Professor Protodiakonov's scale |
Seloern Forability |
||||
|
I |
0.12-0.18 |
0.150 |
0.10 |
0-2 |
0 |
100-300 |
1.40-1.80 |
VII-VI |
V-VIII |
|
II |
0.18-0.27 |
0.225 |
0.10-0.25 |
2-16 |
0 |
250-450 |
1.75-2.35 |
VI-V |
VI-X |
|
III |
0.27-0.38 |
0.320 |
0.20-0.50 |
10-52 |
0-1 |
300-650 |
2.25-2.55 |
V-IV |
IX-XII |
|
IV |
0.38-0.52 |
0.450 |
0.45-0.75 |
45-80 |
0-4 |
300-900 |
2.50-2.80 |
IV-IIIa |
XI –XIII |
|
V |
0.52-0.68 |
0.600 |
0.75-1.00 |
75-98 |
2-5 |
700-1200 |
2.75-2.90 |
IIIa-III |
XIII-XV |
|
VI |
0.68-0.88 |
0.780 |
0.95-1.25 |
96-100 |
10-30 |
1100-1600 |
2.85-3.00 |
III-II |
XIV-XVI |
|
VII |
0.88-1.10 |
0.990 |
1.20-1.50 |
100 |
25-47 |
1450-2050 |
2.95-3.20 |
II-I |
XVI-XVIII |
|
VIII |
1.10-1.37 |
1.235 |
1.45-1.70 |
100 |
43-63 |
1950-2500 |
3.15-3.40 |
I |
XVII-XX |
|
IX |
1.37-1.68 |
1.525 |
1.65-1.90 |
100 |
58-78 |
2350-3000 |
3.35-3.60 |
I |
XIX-XX |
|
X |
1.68-2.03 |
1.855 |
1.85 and + |
100 |
75-100 |
2850 and + |
3.55 et + |
|
|
The distinctive features of the proposed classification include: the introduction of about ten categories that group the various rock formations encountered in quarries, taking into account their main properties, which significantly influence the results of fragmentation, namely, fissuring and mesh hardness. According to this classification, for each quarry, no more than four types of rock are selected, taking into account the required specific consumption. This approach eliminates one of the main drawbacks of existing classifications: in each quarry, there are rocks that are easily, moderately, and difficult to drill, but the specific consumption of explosives for mass blasting for a given category can vary by two times or more. When using the given classification, the corresponding drillability categories are chosen based on the specific consumption of explosives. This approach provides an objective characteristic of the specific rock formation [23].
In the future, within this classification, it is advisable to replace the mesh hardness with impact resistance (resilience), which to a large extent characterizes the destruction of the mesh during blasting. It is necessary to take into account the degree of water saturation in the rock masses to be blasted, as well as the methods of transitioning from the standard blasting conditions of the given classification to other conditions (different bench heights, charge diameters, explosive types, permissible fragment sizes, micro-delay schemes, etc.) [24].
Other authors provide its approximate value, which is determined based on experimental results or industrial blasting, taking into account rock properties. The specific consumption of explosives for multi-row blasting is applied for the first row from the tables provided, but for the second and subsequent rows, it is increased by 5-10% in rocks of fissure categories I-III and by 10-15% in rocks of categories III-X.
5.2.2 Theory of calculating charge diameter
For quarries, the following specific features of boreholes can be formulated [25]:
(1) For rocks in the drillability category I-III, it is advisable to choose the largest possible diameter (250-300 mm).
(2) For rocks in the drillability category IV-VIII, as well as homogeneous category III rocks in the case of the possibility of using multi-row delay blasting, the preferred diameter is (200-250 mm).
(3) For rocks with large meshes in drillability category VIII-X, as well as heterogeneous and often alternating category III rocks, it is advisable to reduce the charge diameter to 150 mm.
Since the output of mined material per meter of borehole is proportional to the square of the charge diameter, in this case, the efficiency of drills increases with the amount of material drilled by large-diameter holes, and the drilling cost per cubic meter decreases. That's why in modern conditions, there is a trend toward using large-diameter holes, especially for high-capacity quarries.
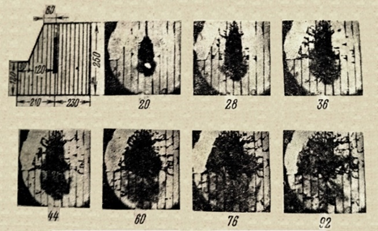
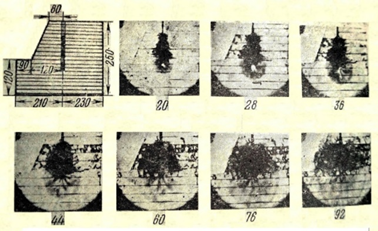
It is necessary to adapt inclined boreholes to the main fissure system, as studies and tests demonstrate through the four cases in Figure 16.
The geometric representation of fissures is achieved through digital mapping and other stereoscopic canvases like the Wulff net, which provide information about the number of fissure systems and their orientations. For the initiation direction of the charges, the following scheme is recommended when planning multi-row blasting (Figure 17):
a) vertical fissure model
b) horizontal fissure model
c) inwardly inclined fissure model
d) outwardly inclined fissure model
Figure 16. Destruction process on different fissure models [8:10]
a) from bottom to top
b) from top to bottom
c) mixed (recommended)
Figure 17. Initiation direction of charges [8:10]
(1) Determination of drillability (standard q): The resistance of rocks to blasting is characterized by the specific standard consumption of explosives (Tables 3-5). It is determined by the following formula:
$q_{\text {ét }}=0.02\left(\sigma_{c o m p}+\sigma_{\text {dép }}+\sigma_{t r}\right) 2 \gamma$ (11)
where, σcomp: Compressive strength of rocks; kgf/cm2; σdép: Displacement strength of rocks; kgf/cm2; σtra: Tensile strength of rocks; kgf/cm2; γ: Density; kg/m3.
σcomp =75.74 MPa= 772.4 kgf/cm2 (Medjounes I)
σcomp =104.15 MPa=1062.03 kgf/cm2 (Medjounes II)
σdépl: It is the resistance of the rock to displacement; it depends on the compressive stress and can be calculated using the following formula:
$\sigma_{\text {dép }}=(0.13 \div 0.33) \sigma_{\text {comp }}$ (12)
σdépl=0.23×772.4 = 177.65 kgf/cm2 (Medjounes I);
σdépl=0.23×1062.03 = 244.26 kgf/cm2 (Medjounes II).
The tensile strength, which is determined by the following empirical formula:
$\sigma_t=(0.08 \div 0.12) \sigma_{\text {comp }}$ (13)
σt=0.10x772.4=77.24 kgf/cm2 (Medjounes I)
σt=0.10x1062.03=106.20 kgf/cm2 (Medjounes II).
Table 3. Initial data
|
|
Ps (g/cm3) |
Compression Resistance σcomp |
Displacement Resistance σdépl kgf/cm2 |
Tensile Strength σt kgf/cm2 |
|
|
(Mpa) |
kgf/cm2 |
||||
|
Medjounes I |
2.76 |
75.75 |
772.4 |
177.65 |
77.24 |
|
Medjounes II |
2.68 |
104.15 |
1062.03 |
244.26 |
106.20 |
qét=0.02 (772.4+177.65+77.24) +2* 2.76 = 26.07 g/m3 ... Medjounes I;
qét=0.02 (1062.03+244.26+106.2) +2* 2.68 = 33.61 g/m3 ... Medjounes II.
Table 4. Classification of rock by drillability index
|
Rock Drillability Level |
Qét |
Classes |
Categories |
|
Very easy drillability |
≤10 |
I |
1, 2, 3, 4, 5 |
|
Average drillability |
10.1÷20 |
II |
6, 7, 8, 9, 10 |
|
Difficult drillability |
20.1÷30 |
III |
11, 12, 13, 14, 15 |
|
Very difficult drillability |
30.1÷40 |
IV |
16, 17, 18, 19, 20 |
|
Exclusively difficult drillability |
40.1÷50 |
V |
21, 22, 23, 24, 25 |
Medjounes I → Difficult tirability, Class III, Category 14.
Medjounes II → Very difficult tirability, Class IV, Category 17.
(2) The drillability of rocks can be determined using the empirical formula of Academician Rjevsky.
$D_f=0.007\left(\sigma_{c o m p}+\sigma_{\text {dép }}\right)+0.7 \rho$ (14)
Df=0.007(772.4+177.65)+0.7*2.76= 8.58; easy drillability, category 8; Medjounes I.
Df=0.007(1062.03 + 244.26) + 0.7*2.68 = 11.02; moderate drillability, category 11; Medjounes II.
Table 5. Rock classification by drillability index
|
Degree of Drillability |
Df |
Classes |
Categories |
|
Very easy drillability |
1÷5 |
I |
1, 2, 3, 4, 5 |
|
Average drillability |
5.1÷10 |
II |
6, 7, 8, 9, 10 |
|
Difficult drillability |
10.1÷15 |
III |
11, 12, 13, 14, 15 |
|
Very difficult drillability |
15.1÷20 |
IV |
16, 17, 18, 19, 20 |
|
Exclusively difficult drillability |
20.1÷25 |
V |
21, 22, 23, 24, 25 |
The permissible particle size of large blocks after blasting is limited by the following conditions:
(a) By the capacity of the loader bucket:
$C \leq 0.8 \sqrt[3]{E}, C \leq 0.8 \sqrt[3]{8} \leq 1.6(\mathrm{~m})$ (15)
where, C: maximum block size, (m); E: loader bucket capacity, m3.
(b) According to the capacity of the truck's bed (or volume). The volume of the truck's bed is 34.2 m3, so the average diameter of the rocks (pieces) will be equal to:
$C \leq 0.5 \sqrt[3]{V}, C \leq 0.5 \sqrt[3]{34.2} \leq 1.62(\mathrm{m})$ (16)
(c) By the size of the crusher's opening:
$C \leq 0.8 \times b$ (17)
where, b: Crusher's feed opening: b= 1300 mm; C≤(0.8*1.3)≤1.04 m , with a threshold value: C≤1.04m.
Based on the obtained results, the acceptable block size is set at 1.04 m. Any block not meeting this dimension will be considered an oversized rock and will require a secondary fragmentation operation (secondary blasting) to reduce its size.
(3) Hole Diameter Determination: We choose a hole diameter based on the initial recommendations proposed in our analytical summary, considering both quantitative and qualitative criteria (based on the categories of fissuring and drillability). For our case, we adopt: D = 150 mm.
$q=q^{\prime} \cdot K_{e x}$ (18)
where, q' is chosen from the table of q selection in this article, equal to 0.45 kg/m3.
$K_{\text {ex }}=A_{\text {ét }} / A_u$ (19)
where, Kex=1.1; Aét: Standard Explosive - Ammonite N6GV; Au: Used explosives (Marmanite III and Anfomil).
q=0.45 × 1.1 = 0.49 kg/m3 (Medjounes II).
Similarly for Medjounes I, where q=0.40 x 1.1=0.44 kg/m3.
Length of the hole:
$L=\frac{H}{\sin \beta}+l_{s f}$ (20)
where, β=75°.
The length of the subdrilling is determined by the following formula:
$l_{s f}=k_s . D$ (21)
Other authors propose the following formula:
$l_b=0.75. w$ (22)
lb = (20÷30)*D=29*0.15=4.35 m (Medjounes I)
lb = (20÷30)*D=30*0.15=4.5 m (Medjounes II)
Determination of the line of least resistance:
$W=\frac{\sqrt{p^2+4 m q p H L}-p}{2 m q H}$ (23)
where, m=0.95 for both Medjounes I and II.
This value is the most suitable for cement limestone based on the academic experience of former Soviet trainers who have worked in Algeria. The explosives used are Marmanit III and Anfomil, so the recommended initiation rate is 20%.
$\Delta=0.20 \times 0.95+0.80 \times 0.90=0.91 \mathrm{~kg} / \mathrm{m}^3$
$\mathrm{P}=785 \times d^2 \times \Delta$ (24)
where, P=785×(0.150)2×0.91=16.07 kg/m.
$W=\frac{\sqrt{16.07^2+4 \times 0.95 \times 0.44 \times 16.07 \times 15 \times 17.55}-16.07}{2 \times 0.95 \times 0.44 \times 15}=5.54 m($ Medjounes I)
$W=\frac{\sqrt{16.07^2+4 \times 0.95 \times 0.49 \times 16.07 \times 15 \times 17.62}-16.07}{2 \times 0.95 \times 0.49 \times 15}=5.32 m$ (Medjounes II)
Calculation of W according to safety conditions:
$W \geq H \operatorname{tg} \alpha+c$ (25)
This sentence means: "Htgα+c=15. tg85°+3=4.13m Htgα+c=15×tg85°+3=4.13m; therefore, the conditions are met."
It's confirming that the calculated value of 4.13 meters satisfies the specified conditions.
The distance between the holes in the first row:
$a=m . W$ (26)
$a=m . W=0.95 \times 5.54=5,26 m$ (Medjounes I)
$a=m . W=0.95 \times 5.32=5,05 m$ (Medjounes II)
The distance between rows of holes: staggered pattern due to the shape of the blocks.
$b=0.85 \times a$ (27)
$b=0.85 \times a=0.85 \times 5.26=4.47 m$ (Medjounes I)
$b=0.85 \times a=0.85 \times 5.05=4.29 m$ (Medjounes II)
- Load quantity of a hole:
1st row:
$Q_{c h_1}=q \cdot W \cdot H \cdot a_1$ (28)
$Q_{c h_1}=q \cdot W \cdot H \cdot a_1=0.44 \times 5.54 \times 15 \times 5.26=192.33 \mathrm{~kg} / \mathrm{tr}$ (Medjounes I)
$Q_{c h_1}=q \cdot W \cdot H \cdot a_1=0.49 \times 5.32 \times 15 \times 5.05=197.46 \mathrm{~kg} / \mathrm{tr}$ (Medjounes II)
2nd row:
$Q_{c h_2}=q \cdot W \cdot H \cdot b$ (29)
$Q_{c h_2}=q . W . H . b=0,44 \times 15 \times 5.26 \times 4.47=155.18 \mathrm{~kg} / \mathrm{tr}$ (Medjounes I)
$Q_{c h_2}=q . W . H . b=0.49 \times 15 \times 5.05 \times 4.29=159.23 \mathrm{~kg} / \mathrm{tr}$ (Medjounes II)
- Load length:
1st row:
$l_{c h_1}=\frac{Q_{c h_1}}{P}$ (30)
$l_{c h_1}=\frac{Q_{c h_1}}{P}=\frac{192.33}{16.07}=11.97 \mathrm{~m}$ (Medjounes I)
$l_{c h_1}=\frac{Q_{c h_1}}{P}=\frac{197.46}{16.07}=12.29 \mathrm{~m}$ (Medjounes II)
2nd row:
$l_{c h_2}=\frac{Q_{c h_2}}{P}$ (31)
$l_{c h_2}=\frac{Q_{c h_2}}{P}=\frac{155.18}{16.07}=9.66 m$ (Medjounes I)
$l_{c h_2}=\frac{Q_{c h_2}}{P}=\frac{159.23}{16.07}=9.91 m$ (Medjounes II)
- Jam length:
1st row:
$l_{b_1}=L-l_{c h_1}$ (32)
$l_{b_1}=L-l_{c h_1}=17.55-11.97=5.58 m$ (Medjounes I)
$l_{b_1}=L-l_{c h_1}=17.62-12.29=5.33 m$ (Medjounes II)
2nd row:
$l_{b_2}=L-l_{c h_2}$ (33)
$l_{b_2}=L-l_{c h_2}=17.55-9.66=7.89 m$ (Medjounes I)
$l_{b_2}=L-l_{c h_1}=17.62-9.91=7.71 m$ (Medjounes II)
-Mining mass flow:
$J_m=\frac{Q_{c h_1}+Q_{c h_2}}{2 \times L \times q}$ (34)
$J_m=\frac{Q_{c h_1}+Q_{c h_2}}{2 \times L \times q}=\frac{192.33+155.18}{2 \times 17.77 \times 0.44}=22.50 \mathrm{~m}^3 / \mathrm{m}$ (Medjounes I)
$J_m=\frac{Q_{c h_1}+Q_{c h_2}}{2 \times L \times q}=\frac{197.46+159.28}{2 \times 17.62 \times 0.49}=20.66 \mathrm{~m}^3 / \mathrm{m}$ (Medjounes II)
-Volume of a block:
V = 1988.5 m3 (Medjounes I)
V =14963 m3 (Medjounes II)
-The length of drilled holes required for a block:
$\sum L=\frac{V}{J_m}$ (35)
$\sum L=\frac{V}{J_m}=\frac{11988.5}{22.50}=532.82 m$ (Medjounes I)
$\sum L=\frac{V}{J_m}=\frac{14969}{20.66}=724.25 m$ (Medjounes II)
-Number of holes drilled:
$N_{t r}=\frac{\sum L}{L}$ (36)
$N_{t r}=\frac{\sum L}{L}=\frac{532}{17.55}=30.36 \cong 30$ holes (Medjounes I)
$N_{t r}=\frac{\sum L}{L}=\frac{724.25}{17.62}=41.1 \cong 41$ holes (Medjounes II)
-Number of sounders:
$N_s=\frac{\sum L}{R_s \times n_{p s} \times N_j}$ (37)
$N_s=\frac{532}{224 \times 1 \times 1}=2.357 \cong 03$ sounders
furukawa (Medjounes I)
$N_s=\frac{532}{160 \times 1 \times 1}=3.325 \cong 04$ sounders
Atlas copco (Medjounes I)
$N_s=\frac{724,25}{224 \times 1 \times 1}=3.23 \cong 04$ sounders
furukawa (Medjounes II)
$N_s=\frac{724,25}{160 \times 1 \times 1}=4.53 \cong 05$ sounders
Atlas copco (Medjounes II)
(RsFurukawa = 224 m/shift), (Rs Atlas Copco = 160 m/shift).
This study has greatly enhanced our comprehension of rock fragmentation and blasting design in limestone quarries, specifically those with substantial cracking. Through the examination of the distinctive attributes of the Ain El Kebira quarry and the implementation of sophisticated methodologies, we have devised innovative strategies to enhance fragmentation results and promote environmentally responsible mining methods.
The major findings emphasize the significant impact of cracking on blasting performance, requiring customized techniques for various geological conditions. We have showcased the significance of taking into account mesh sizes and inherent fracturing patterns throughout the process of constructing blast designs. In addition, the study suggests using Koutousov's formula to calculate specific explosive consumption and investigating various progression paths to improve efficiency.
The study's findings, albeit limited to the Ain El Kebira quarry, provide a basis for wider application in comparable geological environments. Additional study is advised to enhance the accuracy of fragmentation adjustment methods, explore aspects associated to cracks, and establish a comprehensive framework for optimizing drilling and blasting parameters. In order to ensure long-term sustainability in blasting techniques, it will be essential to thoroughly investigate alternate progression directions and give priority to environmental factors.
By rectifying the highlighted constraints and doing additional research, we may utilize the acquired knowledge from this study to construct a universally applicable framework for environmentally friendly and effective blasting in diverse rock formations and geological settings. This will ultimately help the mining industry by facilitating greater resource extraction, mitigating environmental effect, and improving economic feasibility, so contributing to a more sustainable future for the mining sector.
[1] Pavloudakis, F., Roumpos, C., Spanidis, P.M. (2022). Optimization of surface mining operation based on a circular economy model. Circular Economy and Sustainability, 2: 395-418. https://doi.org/10.1016/B978-0-12-821664-4.00005-4
[2] Zhang, Z.X., Sanchidrián, J.A., Ouchterlony, F., Luukkanen, S. (2023). Reduction of fragment size from mining to mineral processing: A review. Rock Mechanics and Rock Engineering, 56(1): 747-778. https://doi.org/10.1007/s00603-022-03068-3
[3] Bustamante, M.M., Roitman, I., Aide, T.M., et al. (2016). Toward an integrated monitoring framework to assess the effects of tropical forest degradation and recovery on carbon stocks and biodiversity. Global Change Biology, 22(1): 92-109. https://doi.org/10.1111/gcb.13087
[4] Mi, J., Grant, P.S., Fritsching, U., Belkessam, O., Garmendia, I., Landaberea, A. (2008). Multiphysics modelling of the spray forming process. Materials Science and Engineering: A, 477(1-2): 2-8. https://doi.org/10.1016/j.msea.2007.08.083
[5] Latham, J.P., Munjiza, A., Lu, P. (1999). Rock fragmentation by blasting—a literature study of research in the 1980′ s and 1990′ s. Fragblast, 3(3): 193-212. https://doi.org/10.1080/13855149909408046
[6] Pittman, K.L. (1984). Rock quality as a guide to fragmentation. Doctoral dissertation, University of Nevada, Reno.
[7] Moghrani, R., Aoulmi, Z., Attia, M. (2023). Hybrid RPI-MCDM approach for FMEA: A case study on belt conveyor in bir el ater mine, Algeria. Journal Européen des Systèmes Automatisés, 56(3): 465-473. https://doi.org/10.18280/jesa.560314
[8] Habib, K.M., Shnorhokian, S., Mitri, H. (2022). Evaluating the application of rock breakage without explosives in underground construction—A critical review of chemical demolition agents. Minerals, 12(2): 220. https://doi.org/10.3390/min12020220
[9] Baneshi, M., Bahreini, S.A. (2018). Impacts of hot water consumption pattern on optimum sizing and techno-economic aspects of residential hybrid solar water heating systems. Sustainable Energy Technologies and Assessments, 30: 139-149. https://doi.org/10.1016/j.seta.2018.09.008
[10] Bamford, T., Medinac, F., Esmaeili, K. (2020). Continuous monitoring and improvement of the blasting process in open pit mines using unmanned aerial vehicle techniques. Remote Sensing, 12(17): 2801. https://doi.org/10.3390/rs12172801
[11] Fedotenko, V., Esina, E. (2018). Substantiation of the technology of efficient transition to high bench stripping of thick coal seams. E3S Web of Conferences, 41: 01044. https://doi.org/10.1051/e3sconf/20184101044
[12] Isheyskiy, V., Sanchidrián, J.A. (2020). Prospects of applying MWD technology for quality management of drilling and blasting operations at mining enterprises. Minerals, 10(10): 925. https://doi.org/10.3390/min10100925
[13] Martinez-Marquez, D., Mirnajafizadeh, A., Carty, C.P., Stewart, R.A. (2018). Application of quality by design for 3D printed bone prostheses and scaffolds. PloS One, 13(4): e0195291. https://doi.org/10.1371/journal.pone.0195291
[14] Gorakhki, M.H., Bareither, C.A. (2017). Sustainable reuse of mine tailings and waste rock as water-balance covers. Minerals, 7(7): 128. https://doi.org/10.3390/min7070128
[15] Salmi, E.F., Sellers, E.J. (2021). A review of the methods to incorporate the geological and geotechnical characteristics of rock masses in blastability assessments for selective blast design. Engineering Geology, 281: 105970. https://doi.org/10.1016/j.enggeo.2020.105970
[16] Isheyskiy, V., Martinyskin, E., Smirnov, S., Vasilyev, A., Knyazev, K., Fatyanov, T. (2021). Specifics of MWD data collection and verification during formation of training datasets. Minerals, 11(08): 798. https://doi.org/10.3390/min11080798
[17] Djellali, A., Sarker, D., Benghazi, Z., Rais, K. (2022). Geospatial-based approach for susceptibility assessment of expansive soils using a new multicriteria classification model. Arabian Journal of Geosciences, 15(23): 1742. https://doi.org/10.1007/s12517-022-11024-2
[18] Scheiber, T., Fredin, O., Viola, G., Jarna, A., Gasser, D., Łapińska-Viola, R. (2015). Manual extraction of bedrock lineaments from high-resolution LiDAR data: Methodological bias and human perception. Gff, 137(4): 362-372. https://doi.org/10.1080/11035897.2015.1085434
[19] Rudakov, M., Babkin, R., Medova, E. (2021). Improvement of working conditions of mining workers by reducing nitrogen oxide emissions during blasting operations. Applied Sciences, 11(21): 9969. https://doi.org/10.3390/app11219969
[20] Chen, W., Li, X., Lu, F., Li, Z., Zhang, Z. (2015). Parallel control to fragments of a cylindrical structure driven by explosive inside. Mathematical Problems in Engineering, 2015. https://doi.org/10.1155/2015/723463
[21] Singh, P.K., Roy, M.P., Paswan, R.K., Sarim, M.D., Kumar, S., Jha, R.R. (2016). Rock fragmentation control in opencast blasting. Journal of Rock Mechanics and Geotechnical Engineering, 8(2): 225-237. https://doi.org/10.1016/j.jrmge.2015.10.005
[22] Li, X., Zhu, Z., Wang, M., Shu, Y., Deng, S., Xiao, D. (2022). Influence of blasting load directions on tunnel stability in fractured rock mass. Journal of Rock Mechanics and Geotechnical Engineering, 14(2): 346-365. https://doi.org/10.1016/j.jrmge.2021.06.010
[23] Yuksek, S.A.L.İ.H. (2019). Mechanical properties of some building stones from volcanic deposits of mount Erciyes (Turkey). Materiales de Construcción, 69(334). https://doi.org/10.3989/mc.2019.04618
[24] Mostafaei, A., Elliott, A.M., Barnes, J.E., Li, F., Tan, W., Cramer, C.L., Nandwana, P., Chmielus, M. (2021). Binder jet 3D printing—Process parameters, materials, properties, modeling, and challenges. Progress in Materials Science, 119: 100707. https://doi.org/10.1016/j.pmatsci.2020.100707
[25] Behr, H.J., Stehli, F.G., Vidal, H. (2012). Observation of the continental crust through drilling II: Proceedings of the International Symposium, Seeheim. Springer Science & Business Media. https://doi.org/10.1007/978-3-642-45616-9_1