Titin Handayani*![]() | Fajar Eko Priyanto
| Fajar Eko Priyanto![]() | Susi Sulistia
| Susi Sulistia![]() | Avi Nurul Oktaviani
| Avi Nurul Oktaviani![]() | Nida Sopiah
| Nida Sopiah![]() | Arif Dwi Santoso
| Arif Dwi Santoso![]() | Agusta Samodra Putra
| Agusta Samodra Putra![]() | Ira Nurhayati Djarot
| Ira Nurhayati Djarot![]() | Netty Widyastuti
| Netty Widyastuti![]() | Donowati Tjokrokusumo
| Donowati Tjokrokusumo![]() | Heri Apriyanto
| Heri Apriyanto![]() | Akhmad Rifai
| Akhmad Rifai![]() | Abdul Aziz
| Abdul Aziz![]() | Sri Peni Wijayanti
| Sri Peni Wijayanti![]() | Hismiaty Bahua
| Hismiaty Bahua![]() | Nuha Nuha
| Nuha Nuha![]() | Febrian Isharyadi
| Febrian Isharyadi![]() | Ari Kabul Paminto
| Ari Kabul Paminto![]() | Nadia Rizki Ariyani
| Nadia Rizki Ariyani![]()
© 2023 IIETA. This article is published by IIETA and is licensed under the CC BY 4.0 license (http://creativecommons.org/licenses/by/4.0/).
OPEN ACCESS
Technologies have been developed to reduce CO2 emissions, including CO2 bio-fixation by microalgae. This study evaluates carbon reduction by integrating milk factory wastewater treatment with microalgal biomass production, including its sustainability aspects through life cycle assessment (LCA) and techno-economic assessment (TEA). The microalgae species used were a consortium of Chlorella sp. and Scenedesmus sp. Five levels of carbon dioxide were provided to microalgae cultures: 0%, 5.5%, 6.2%, 8.1%, and 10.3%. Observed variables included CO2 uptake, absorption efficiency, and microalgal biomass production. The results showed that the CO2 sequestration efficiency by indigenous microalgae reached 0%, 9.2%, 98.8%, 96.2%, and 93.2% with average CO2 level loadings of 0%, 5.2%, 6.2%, 8.1%, and 10.3%, respectively. Chlorella sp. exhibited greater tolerance to high levels of CO2 concentration than Scenedesmus sp. TEA analysis revealed that CO2 bio-fixation and wastewater utilization significantly increased microalgal biomass production while also reducing environmental pollution. Furthermore, LCA indicated that the initial biomass production method (scenarios 1 and 2) had a higher environmental impact than the advanced method using wastewater treatment (scenarios 3 and 4). In conclusion, coupling microalgae-based wastewater treatment with CO2 bio-fixation offers promise for CO2 mitigation, enhanced biomass production, and reduced operational costs.
bio-fixation, life cycle impact assessment, microalgae, sustainability, techno-economic assessment, wastewater
Carbon pollution, primarily in the form of CO2 and CH4, has significantly accelerated global warming [1]. To curb CO2 emissions, chemical, physical, and biological methods have been explored [2]. While tree planting has traditionally been the primary biological method for reducing CO2 emissions, the potential of microalgae for this purpose remains largely untapped [3].
Green plants, including both higher plants and various types of microalgae found in marine and terrestrial environments, rely on atmospheric CO2 for photosynthesis [4]. Microalgae, ubiquitous microorganisms particularly found in water, can perform photosynthesis due to their pigment content. Given their nature, microalgae can be used to mitigate carbon dioxide (CO2) emissions using growth media derived from wastewater. Thus, microalgae play a dual role in both CO2 sequestration and wastewater remediation.
The ability of microalgae to perform CO2 bio-fixation and wastewater remediation has become a trending solution for mitigating industrial pollution. Therefore, CO2 bio-fixation refers to the use of CO2 by microalgae for photosynthesis [5].
The photosynthetic capabilities of microalgae provide a basis for engineering solutions to control carbon emissions. One potential application of Carbon Capture and Storage Technology in Indonesia is bio-fixation. This process captures and stores atmospheric CO2 by enhancing the volume and quality of photosynthesis through microalgal bioreactors [6].
Numerous efforts have been made in the field of carbon mitigation using microalgae [7, 8]. For instance, the bio-fixation of CO2 with flue gas can boost the production of microalgal biomass [9]. Furthermore, industrial wastewater can substitute traditional fertilizers often used in cultivation, serving as an effective culture medium [6, 10, 11].
Microalgae can efficiently sequester CO2 through the rapid production of algal biomass [12]. This productivity is influenced by environmental factors such as light, temperature, nutrients, and salinity [13]. In addition to its potential as a source of renewable energy, microalgal biomass also contributes to reducing CO2 emissions through photosynthetic activities [14, 15].
The growth of indigenous microalgae consortia, including Chlorella sp., Scenedesmus sp., and other species, demonstrates the effective utilization of provided nutrients and CO2. Microalgae can perform photosynthesis by absorbing airborne CO2, therefore they can be cultivated as a primary material for biofuels.
Microalgae present four potential areas for biorefinery development. Firstly, large-scale microalgal biomass production is possible given suitable media and growing conditions, making it a viable raw material for bioenergy. Secondly, microalgal oil, currently limited in the market, holds promise. Thirdly, microalgae can be cultivated in diverse environments, including fresh and seawater. Lastly, the innovation in microalgal production could be highly productive, especially as mineral resources dwindle and the search for renewable energy sources intensifies [16, 17].
This study aims to determine the capacity of microalgae to absorb carbon dioxide, providing potential solutions to tackle carbon emissions and generate alternative energy sources.
Research indicates that wastewater from milk factories can effectively serve as a nutrient for microalgae biomass production [18, 19]. Studies on the feasibility of sustainable microalgae biomass production using Palm Oil Mill Effluent (POME) show promise for biorefinery sources [20]. Numerous works of literature discuss CO2 bio-fixation and the use of wastewater for nutrition by microalgae in bioremediation processes [21]. The resulting biomass has been suggested to have potential as a biodiesel [22].
Despite microalgae being recognized as an environmentally friendly raw material, challenges persist in commercializing microalgae systems for CO2 capture and the creation of value-added products. These challenges underscore the need to restructure production patterns and optimize and integrate processes to overcome economic viability constraints [23].
This research intends to fill this gap by studying the circular economic sustainability achieved through the utilization of CO2 emissions and wastewater by microalgae as raw material for biofuels. Specifically, it involves conducting a life cycle assessment (LCA) and techno-economic analysis of integrated processes, namely CO2 bio-fixation and wastewater bioremediation by microalgae, predominantly in the milk industry.
LCA is a rigorous methodology that evaluates the environmental impacts associated with all stages of a product or process. In this study, LCA was applied to the biomass production system, including microalgae cultivation and harvesting, wastewater treatment, and CO2 capture and utilization. Several scenarios were compared, focusing on wastewater use in the cultivation phase and flue gas use for bio-fixation. Potential environmental impacts were quantified towards global warming potential (GWP), acidification potential (AP), eutrophication potential (EP), and human toxicity (HT). The LCA will provide insights into the environmental sustainability of the integrated processes, inform decision-making for the appropriate scenario, and identify areas for improvement to enhance the system's sustainability.
The study also includes a techno-economic analysis, evaluating three parameters: 1) Benefit-Cost Ratio (BCR), 2) Return of Investment (%) (RoI), and 3) Investment Payback Period (Month) (IPP). Benefit-cost analysis (BCA) is a technique that compares the economic benefits and costs of a project or investment [24]. BCA can assess the merit of a project, compare competing projects, and evaluate business decisions such as the worth of public investment, utilization of natural resources, and environmental alteration caused by the project. Return on Investment (RoI) and Payback Period (PP) were used to estimate the investment return of the project. RoI is the percentage value of return gained from the investment, while PP is the period to gain the return of the investment expressed in months. Both indicators should be positively correlated [25].
Microalgae cultivation technology, involving investment and operations, has been a source of controversy due to high costs in cultivation and extraction processes for biodiesel and other products. Utilizing CO2 emissions and industrial wastewater could be a solution to reduce operational costs. The validity of this research was analyzed using the TEA method.
To date, there are no published papers about the combined Life Cycle Assessment (LCA) and techno-economic analysis of the bioremediation and bio-fixation processes by microalgae. This research, therefore, represents a novel approach to studying the circular economic sustainability achieved through the utilization of CO2 emissions and wastewater by microalgae as raw materials for biofuels.
The study focuses on two microalgae species, Chlorella sp. and Scenedesmus sp., which are indigenous to the wastewater from the milk industry [26]. The potential of these species for biodiesel production has been suggested in previous literature [27]. Furthermore, the application of CO2 reduction and wastewater treatment can contribute positively towards combating climate change and achieving sustainable life [28].
This research on CO2 bio-fixation and wastewater treatment can provide additional insights for mitigating the impact of climate change. Moreover, the conversion of microalgae biomass from the bio-fixation process into biofuels can serve as an alternative renewable energy source, thereby reducing the severity of climate change [28]. The novelty of this study lies in its LCA and techno-economic analysis of the integrated CO2 bio-fixation and the utilization of wastewater for nutrition by microalgae. The analysis results contribute to the sustainability of the two integrated processes where microalgae can act as an agent to combat CO2 contamination and industrial wastewater. These integrated processes yield superior results compared to conventional processes, which do not add CO2 and use fertilizers in microalgae cultivation.
The primary question posed by this research is whether the utilization of CO2 emissions and industrial wastewater can reduce operational costs in process sustainability. The objectives of this study are to evaluate carbon reduction by integrating milk factory wastewater treatment with microalgae production and to assess the sustainable aspects of this process through a techno-economic assessment (TEA) conducted alongside a life cycle assessment (LCA).
The findings from this study are anticipated to provide recommendations for the development of microalgae technology that addresses global warming issues and promotes more environmentally friendly alternative energy sources. The hypothesis is that bio-fixation of CO2 and utilization of wastewater can reduce production costs while increasing microalgae biomass. The conclusions will aim to confirm that CO2 emissions and wastewater from the milk factory can be used for microalgae cultivation; the results of the LCA analysis can serve as an indicator for the sustainability of microalgae biomass production; and the TEA analysis shows that the utilization of CO2 emissions and wastewater can reduce operational costs for microalgae cultivation.
2.1 Research location
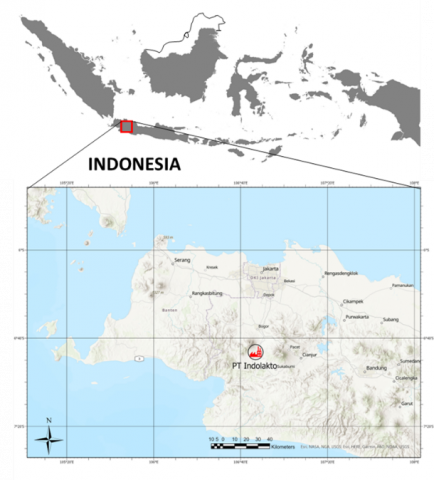
This research was conducted at PT Indolakto Tbk, a significant milk factory located in the Indolakto Industrial Estate, Cicurug District, West Java Province, Indonesia, and a subsidiary of PT Indofood Group Tbk. The geographic coordinates of PT Indolakto are latitude -6.89485225641 and longitude 106.824006615 (Figure 1).
Figure 1. Site location of the study at PT Indolakto
2.2 Preparation of microalgal culture
A consortium of Chlorella sp. and Scenedesmus sp., as dominant indigenous microalgae of milk factory wastewater, was used in this research. Because this research uses microalgae, developing an existing microalgae culture is necessary before analyzing the experimental parameters. The microalgae developed came from the Laboratory of the Research Center for Environmental and Clean Technology located in South Tangerang, Banten, and was grown in a mini pond made of stainless steel with a volume capacity of 1 m3, length of 5 m, width of 1 m and depth of 0.4 m by providing nutrients to support microalgae growth.
2.3 Preparation of cultivation reactor
The reactor used in this study is a raceway-type pond made of stainless steel with a volume capacity of 1 m3. Pond with a length of 5 m, width of 1 m, and depth of 0.4 m. However, the filling media grows only as high as 0.2 m from the depth of the pond. To reduce contamination during microalgae cultivation, the pond’s surface is covered with transparent plastic so that sunlight can still penetrate.
2.4 Preparation of media for microalgae
The microalgae culture medium that will be filled into the raceway pond is the milk factory wastewater from the last pool. For the growth of microalgae to be good, the composition of the wastewater must be analyzed first. If there is a shortage of elements needed by microalgae, nitrogen (N), phosphorus (P), potassium (K) fertilizers, carbon dioxide (CO2) can be added.
2.5 Wastewater characteristic analysis
Samples were collected in plastic bottles from the inlet and outlet pond three times per day, carried out at 9 AM, 12 AM, and 3 PM every day during microalgae cultivation. The physicochemical parameters which were measured are the following: color, pH, temperature, biological oxygen demand (BOD), chemical oxygen demand (COD), dissolved oxygen (DO), suspended solids (SS), volatile solids (VS), total sulfate, oil and grease also nutrients such as nitrate (N-NO3), phosphate (P-PO4), and potassium. These parameters were analyzed using the standard method [29]. Correlations among the parameters were calculated with SPSS 26.0 software (applying Pearson and Spearman correlation coefficients) [30].
The independent sample t-test analyzes the variation in the mean of the two groups to the data from the sampled wastewater entering and leaving the culture pond. Both data sets were applied to determine the statistical variance between the influent and effluent wastewater measurements. The data obtained from the influent and effluent were the average temperature, pH, SS, COD, and BOD during the microalgae cultivation process. These were used as inputs in the correlation analysis. Variation was considered significant at the p < 0.05 and p < 0.01 levels. Studies present results as mean ± standard deviation.
2.6 Experimental
The implementation can be carried out if all processes up to the presence of a reactor are met. The research was conducted at five different levels of CO2 combined with concentrations of wastewater. This experiment was performed by differentiating 5 CO2 concentration levels, namely 0; 5.5; 6.2; 8.1; 10.3. respectively (Table 1). The five experimental treatment levels used wastewater with the same volume of 10 L or 1 m3, the same cultivation time of 15 days, and the same fertilizer of 0.5 mg/L.
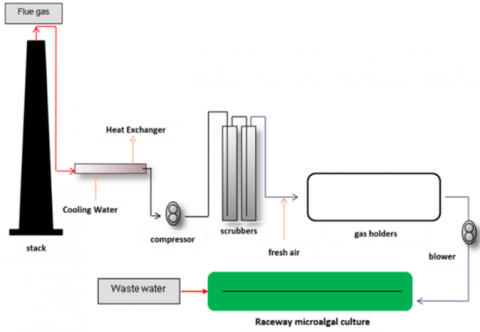
The source of CO2 comes from dairy industry emissions and flows into the pond after going through the heat exchanger and scrubber (Figure 2). Light conditioning, namely using natural lighting (sunlight) during the day and artificial lighting (lights) at night.
Table 1. Treatment of CO2 and wastewater
|
Level of Treatment |
Concentration of CO2 (%) |
Wastewater (L) |
Fertilizer (mg/L) |
Treatment (Days) |
|
Level 0 |
0 |
0 |
40 |
15 |
|
Level 1 |
0 |
103 |
0.5 |
15 |
|
Level 2 |
5.5 |
103 |
0.5 |
15 |
|
Level 3 |
6.2 |
103 |
0.5 |
15 |
|
Level 4 |
8.1 |
103 |
0.5 |
15 |
|
Level 5 |
10.3 |
103 |
0.5 |
15 |
Figure 2. Flow diagram of the experiment
After 15 days of culture in the raceway pond, microalgae began to be treated with CO2. The concentration of CO2 was given in stages, starting on day 15 of the culture period with level 1, followed by level 2 until day 27. Level 3 is given from days 28 to 40, level 4 from days 41 to 53, and level 5 from days 54 to 66. All those CO2 concentration levels were given in one raceway pond used for the experiment.
A cultivation media experiment was used for dairy industry wastewater treatment effluent added by 35 ppm Nitrogen Phosphor and Kalium fertilizer and 10 ppm Urea fertilizer. The addition of nutrients to the growth of microalgae is every 14 days.
2.7 Calculation for microalgae growth and carbon dioxide (CO2) fixation
Analysis of the calculation of algae growth using the stoichiometric equation of the reaction equation below [31].
Specific growth rate $(\mu /$ day $)=\frac{\ln \left(\frac{N f}{N i}\right)}{T f-T i}$ (1)
Division per day $(\mathrm{Dd})=\frac{\left(\frac{\mu}{d a y}\right)}{\ln 2}$ (2)
Doubling time $(\mathrm{td})=\frac{1}{D d}$ (3)
Biomass productivity $=\frac{N f-N i}{T f-T i}$ (4)
where, μ is the specific growth rate and Nf and Ni are the biomass at time f (Tf) and time i (Ti), respectively.
Microalgae cell density count by Neubauer hemocytometer was observed using 100 magnifier optical microscope. The dry weight (g/L) of biomass microalgae was measured at the end of the process by centrifuging 10 ml of each sample at 4500 RPM for 30 minutes and then washed with distilled water, finally dried at 105℃ for 40 minutes.
Carbon dioxide input and output were measured by portable multi-gas detector brands Riken type RX-515. The amount of carbon dioxide absorbed is calculated from the stoichiometric ratio in the photosynthetic reaction. Using the stoichiometric ratio in reaction 1, it can be seen that 1 gram of organic compounds (microalgae cells formed) is equivalent to 2.95 grams of CO2 absorbed [32].
As an illustration, it can be seen in Eqs. (5)-(6) below. Microalgae growth analysis was carried out by comparing the amount of biomass that grew by unit of time. New microalgae cells were obtained by measuring chlorophyll using the Spectrophotometry Determination of Chlorophyll method [33].
Mass of biomass =concentration of chlorophyll a $\times 0.00005$ (5)
Mass of $\mathrm{CO}_2=$ Grams of biomass $\times 2.95$ (6)
For instance, the analysis of chlorophyll shows that the concentration of chlorophyll is 5 mg, which means the amount of CO2 absorbed is 14.75 mg.
2.8 Techno-economic assessment of couple bio-fixation and wastewater treatments
The techno-economic assessment (TEA) was performed by Zimmermann et al. [25] to construct the methodology section as transparent and coherent. This TEA guideline allows TEA to be conducted in parallel to life cycle assessment (LCA), which emerges in aligned vocabulary and assessment steps, and it applies many concepts from ISO 14044 (ISO Organisation 2006). TEA should cover the process of LCA steps. Economic parameters will analysis 4 scenarios done in this experiment. Economic parameters include the Benefit-Cost Ratio, Return of Investment, and Investment payback period.
Benefit-cost analysis (BCA) is a technique for evaluating a project or investment by comparing the economic benefits of an activity with the economic costs of the activity [24]. There are 2 purposes for calculating BCA. First, BCA can be used to evaluate the merit of a project. Second, a series of BCA analyses can be used to compare two competing projects. Third, it can be used to assess business decisions such as the worth of public investment, utilization of natural resources, and environmental alteration caused by the project.
Return of Investment (RoI) and Payback Period (PP) were used to estimate the investment return of the project. Return on Investment (RoI) is the percentage value of return gained from the investment, while the Payback Period (PP) is the period to gain the return of the investment expressed in the month. Both indicators should be positively correlated.
2.9 Environmental aspect of bio-fixation and wastewater treatment based on life cycle assessment approach
The goals of this section were to apply LCA in the different processes of biomass production that use flue gas as bio-fixation and wastewater treatment. The experimental design was constructed in four scenarios (Table 2).
The system boundaries encompassed the processes to biomass production, which were partly 3 processes: strain production, cultivation, and harvesting. The cradle-to-gate boundary system was defined, in which the unit function was 1kg biomass produced in 1 batch with 20% water content (WC) (Figure 3).
The life cycle impact assessment (LCIA) method chosen was CML 1-baseline with impact categories including acidification potential (AP), global warming potential (GWP), eutrophication potential (EP), and human toxicity (HTC). The results of inventory data of biomass production are presented in Table 3.
This methodology was developed at the University of Leiden [34]. Based on the primary inputs and outputs into and out of the system, mainly materials, energy and emissions, an inventory was created for all the scenarios shown in Table 3. All calculations were performed using Ecoinvent 3.8 database for all background data, and OpenLCA 1.11 software [35] for subsequent characterization of the microalgae based CO2 bio-fixation and wastewater utilization.
Table 2. Variable and specification of design research
|
Scenario |
Strain |
Media Input |
Input Gas Rate |
|
1 |
Tap water + fertilizer |
Ambient gas |
2 l/min |
|
2 |
Tap water + fertilizer |
Flue gas |
2 l/min |
|
3 |
Dairy’s wastewater treatment |
Ambient gas |
2 l/min |
|
4 |
Dairy’s wastewater treatment |
Flue gas |
2 l/min |
Figure 3. The cradle-to-gate boundary system of 4 scenarios of biomass production
Table 3. LCI of production 1 kg of biomass microalgae
|
Inventory |
Unit |
Scenario-1 |
Scenario-2 |
Scenario-3 |
Scenario-4 |
|
INPUTS |
|||||
|
Water use |
litter |
102.045 |
45.667 |
0.005 |
0.005 |
|
Wastewater use |
litter |
0 |
0 |
86.206 |
46.511 |
|
Flue gas input |
Kg |
0.000 |
0.111 |
0.000 |
0.112 |
|
Fertilizer |
Kg |
0.409 |
0.184 |
0.002 |
0.002 |
|
Energy |
KWh |
3.714 |
1.677 |
3.603 |
1.959 |
|
Steam |
kg |
0.014 |
0.014 |
0.014 |
0.014 |
|
OUTPUTS |
|
|
|
||
|
Biomass |
Kg |
1.000 |
1.000 |
1.000 |
1.000 |
|
Total solids |
Kg |
0.005 |
0.002 |
1.178 |
1.175 |
|
Suspended solids |
Kg |
0.001 |
0.002 |
0.238 |
0.231 |
|
Total Sulphate |
Kg |
0.001 |
0.001 |
0.044 |
0.042 |
|
Total Phosphates |
Kg |
0.001 |
0.001 |
0.022 |
0.044 |
|
Total Nitrate |
Kg |
0.002 |
0.001 |
0.111 |
0.022 |
|
Kalium |
Kg |
0.004 |
0.002 |
0.187 |
0.123 |
|
BOD |
Kg |
0.002 |
0.001 |
0.428 |
0.177 |
|
COD |
Kg |
0.004 |
0.001 |
0.798 |
0.424 |
|
Oil and Grease |
Kg |
0 |
0 |
0.204 |
0.850 |
Research on CO2 bio-fixation and utilization of milk factory wastewater begins with a character study of CO2 emissions and liquid waste. CO2 emissions at high temperatures, around 200℃, have been successfully reduced to temperatures suitable for microalgae cultivation. The characteristics of the liquid waste have been analyzed, the results were discussed in section 3.1, and data is presented in Table 4. Then proceed with experimental activities, namely CO2 Fixation Rate and Biomass Production which are discussed in section 3.2. After the microalgae production process was running, LCA which was discussed in section 3.3. Environmental Aspect of Bio-fixation and Wastewater Treatment Based on Life Cycle Assessment Approach and TEA studies were discussed in section 3.3. Techno-Economic Assessment of Coupled CO2 Bio-fixation and Wastewater Treatment.
3.1 Characterization of milk factory wastewater
The results of the analysis of the characteristics of the milk factory wastewater sampled before and after being used in the study are presented in Table 4 [29]. Different physic-chemical parameters of milk factory wastewater measured before (0th days) and after treatment (15th days) showed that wastewater pollutants were reduced by microalgae activities. The decrease in pollutants indicates that microalgae play a role in the remediation of wastewater. This supports phycoremediation research that has been carried out by Hazman et al. [36]. Pollutants contained in wastewater are useful as nutrients for microalgae [19].
Table 4. Composition of milk factory wastewater/effluent
|
No |
Constituents |
Pooled Milk Factory Wastewater |
Treatment Level (15th Days) |
|||||
|
0 |
1 |
2 |
3 |
4 |
5 |
|||
|
1 |
Color |
White |
Green |
Green |
Green |
Green |
Green |
Green |
|
2 |
pH |
5.8 ±0.1 |
7.3 ±0.1 |
6.8 ±0.2 |
7.3 ±0.1 |
7.1 ±0.2 |
7.0±0.2 |
7.0±0.1 |
|
3 |
Temperature (℃) |
29 ±1 |
28 ±1 |
28 ±1 |
28 ±1 |
29 ±1 |
28±1 |
29±1 |
|
4 |
Total solids (mg/L) |
950 ±12 |
47.3±0.2 |
248 ±0.4 |
247.3±0.5 |
247.0±0.4 |
247.3±0.3 |
246.6±0.2 |
|
5 |
Suspended solids (mg/L) |
360 ±16 |
8.8 ±0.3 |
50.1±0.3 |
48.8±0.4 |
49.6±0.5 |
48.7±0.4 |
48.8±0.5 |
|
6 |
Volatile solids (mg/L) |
45±0.2 |
2.1±0.2 |
8.4±0.3 |
9.1±0.4 |
8.9±0.6 |
8.8±0.5 |
8.6±0.4 |
|
7 |
Total Sulfate (mg/L) |
50.1±0.2 |
9.9 ±0.4 |
9.2±0.3 |
8.9 ±0.1 |
9.1±0.2 |
9.2±0.2 |
9.1±0.1 |
|
8 |
Total Phosphates (mg/L) |
18.3± 0.3 |
4.76 ±0.1 |
4.72±0.1 |
4.76 ±0.1 |
4.69±0.1 |
4.57±0.1 |
4.45±0.1 |
|
9 |
Total Nitrogen (mg/L) |
110.4±0.5 |
22.7 ±0.1 |
23.4 ±0.2 |
22.7±0.2 |
26.1±0.3 |
25.9±0.2 |
24.8±0.1 |
|
11 |
Kalium (mg/L) |
234.3±0.5 |
37.8±0.1 |
39.3±0.1 |
37.8 ±0.1 |
36.1±0.1 |
37.3±0.1 |
37.1±0.1 |
|
12 |
BOD (mg/L) |
550 ±14 |
19.5 ±0.2 |
90.1 ±0.2 |
89.5 ± 0.3 |
88.9±0.1 |
89.2±0.2 |
99.7±0.3 |
|
13 |
COD (mg/L) |
860 ±19 |
36 ±2 |
168 ±7 |
176 ±8 |
181±9 |
179±7 |
180±8 |
|
14 |
DO (mg/L) |
6.6±0.2 |
2.4±0.2 |
2.3±0.1 |
2.2±0.5 |
2.2±0.1 |
2.1±0.2 |
2.1±0.1 |
|
15 |
Oil and Grease (mg/L) |
195 ±9 |
0 |
43 ±3 |
44 ±5 |
43±2 |
42±1 |
42±2 |
3.2 Carbon dioxide fixation rate and biomass production
The research was conducted by measuring the concentration of chlorophyll as the amount of microalgae biomass growing in raceway ponds. In this study, the CO2 concentration used was 6.71%. Thus, there is still a possibility of giving the CO2 concentration increased to 20%. In each gas composition with a concentration of CO2 gas containing more than 1000 ppm, microalgae growth was not indicated as a problem. The amount of CO2 bio-fixation can be seen in Table 5.
The environmental factors in this study showed that the pH value was 6–7, the temperature was 28-30℃, and the light intensity was 1,000-7,000 lux.
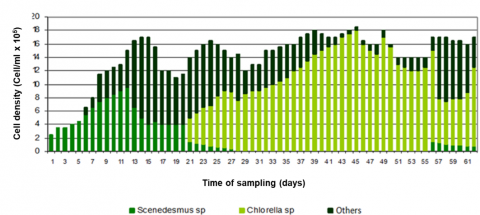
Figure 4 illustrates the ability to absorb carbon dioxide by microalgae in an open pond raceway type.
The growth of the indigenous microalgae consortium showed the functionality of the nutrients and CO2 provided [27]. In this research, microalgae cultivation initially grew Scenedesmus sp. and other unknown species. However, Scenedesmus sp. began to decline in growth and was replaced by the growth of Chlorella sp. Growth of Chlorella due to increase in CO2 concentration. The color of microalgae in liquid media appears from light green to dark green at harvest.
Table 5. The average capacity of CO2 bio-fixation by indigenous microalgae consortium
|
No |
Parameters |
Treatment |
|||||
|
Level 0 |
Level 1 |
Level 2 |
Level 3 |
Level 4 |
Level 5 |
||
|
1 |
Input CO2 (% vol) |
0 |
0 |
5.2±0.1 |
6.2±0.2 |
8.1±0.3 |
10.3±0.4 |
|
2 |
Output CO2 (% vol) |
0 |
0 |
0.3±0.02 |
0.08±0.01 |
0.11±0.02 |
0.7±0.02 |
|
3 |
Fixation CO2 (%vol) |
0 |
0 |
4.9±0.1 |
6.19±0.2 |
7.79±0.3 |
9.6±0.5 |
|
4 |
Fixation CO2 (l/day) |
0 |
0 |
0 |
0 |
0 |
0 |
|
5 |
Fixation CO2 (g/l/day) |
0 |
0 |
0.20±0.02 |
0.21±0.02 |
0.29±0.03 |
0.40 ±0.03 |
|
6 |
Efficiency (%) |
0 |
0 |
94.2±0.1 |
98.8±0.2 |
96.2±0.1 |
93.2±0.2 |
|
7 |
Wastewater 10 m3 |
0 |
10 |
10 |
10 |
10 |
10 |
|
8 |
Wastewater 0 m3+ Fertilizer NPK (mg/L) |
40± |
0.5 |
0.5 |
0.5 |
0,5 |
0,5 |
|
9 |
Cell density of microalgae at harvest time (x 105) |
659±22 |
764.6±27 |
734±24 |
1150.3±31 |
1840.2±41 |
1090±28 |
|
10 |
Dry weight of microalgae biomass (g/l) |
3.9±0.1 |
5.8±0.2 |
6.2±0.3 |
7.4±0.3 |
8.6±0.4 |
6.5±0.3 |
Figure 4. The consortium of indigenous microalgae growth performance treated by 5 levels concentration of CO2: Level 1 = days 1-15; Level 2 = days 16-27; Level 3 = days 28-40; Level 4= days 41-53 and Level 5 = days 54-66. Indigenous microalgae Chlorella sp. showed more tolerance to high-level CO2 concentration (8.1% and 10.3%) than Scenedesmus sp.
3.3 Environmental aspect of bio-fixation and wastewater treatment based on life cycle assessment approach
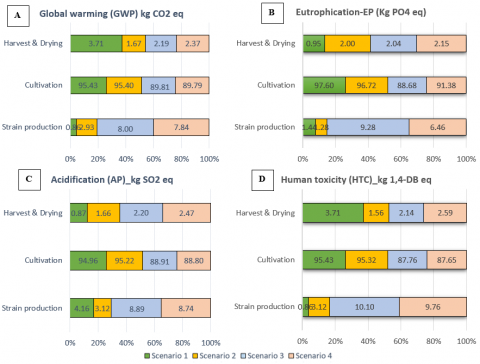
The results of characterization calculations for each category impact in each scenario of microalga biomass production process are presented in Table 6, showing that the processes that contribute to the environmental impacts of the 4 scenarios are the cultivation, harvesting, and drying stages of biomass production. The result of the biomass production method in scenario 3 showed the lowest impact in GWP, acidification AP, and HTC, while the lowest EP impact occurred at scenario 4. The LCA result of the scenario 3 method resumed that GWP: 2.1997 kg CO2-eq, AP: 0.00956 kg SO2-eq, EP: 0.0634 kg PO4-eq, HTC: 1.569 kg 1.4 DB-eq receptively. The most significant environmental impact of each impact category contributed by the cultivation process (87-97%), where the use of electricity was the main contributor. Meanwhile, other processes (strain production and harvesting) contributed law impact at around 0.8-8%.
The values of the category impact on GWP and EP in scenarios 3 and 4 (with wastewater treatment as media culture) were slightly smaller than the report [37]. This is possible because the use of wastewater can reduce the burden of the cultivation media. The use of wastewater for microalgae production is also a treatment that plays a major role in reducing the impact on N and P that contribute to eutrophication [38].
Electrical energy input contributes to all scenarios. This energy is used in all processes for flue gas temperature reduction, agitation, centrifugation, and others. Energy requirements in cultivation, harvesting, and drying contribute to the potential for global warming as well as to acid nitrification and other category impacts.
The results of the contribution analysis of the biomass production process in Figures 5A, B, C, and D confirm that the production process with wastewater as a media producing has a smaller impact value. These results are similar to Papadaki’s [39] research which also used wastewater for microalgae culture.
The lowest EP occurred in scenario 4, which used flue gas and wastewater for microalgae cultivation. This scenario system shows that flue gas containing CO2 plays a role in increasing the growth of microalgae (Table 5) so that the P nutrient contained in wastewater is absorbed quickly which results in low EP. The utilization of microalgae for carbon mitigation includes the ability to capture nutrients from wastewater and other gaseous emissions [40].
Comparison among the 4 impact categories in scenarios 3 and 4 is usage of the same media from wastewater but differs in the input gas injection. Several potential improvements that can be made are optimizing the concentration of waste water according to the needs of the biomass culture. The addition of optimal nutrient concentrations contained in wastewater will increase the productivity of biomass [41] and will also indirectly reduce environmental impacts. Other efforts reduce or eliminate the use of electricity from waste water media distribution pumps with gravity energy by setting the layout of the culture media.
The influence on human toxicity represents the possibility of a harmful quantitative equivalent due to the number of chemicals released into the atmosphere. The usage of NPK fertilizers and electricity were the main contributors to human carcinogenic toxicity in this study, with the highest human toxicity in scenario 1 of 5.61 Kg 1.4 DB-eq and followed in scenario 2 (Table 6).
Table 6. Life cycle impact associated with the production of 1 kg of biomass production from four different production scenario systems
|
Process GWP (Kg CO2-eq) |
Scenario 1 |
Scenario 2 |
Scenario 3 |
Scenario 4 |
||||
|
Amount |
% |
Amount |
% |
Amount |
% |
Amount |
% |
|
|
Strain production |
0.04828 |
0.86 |
0.09319 |
2.93 |
0.17594 |
8.00 |
0.17594 |
7.84 |
|
Cultivation |
5.3579 |
95.43 |
3.03356 |
95.40 |
1.9755 |
89.81 |
2.01369 |
89.79 |
|
Harvest & drying |
0.20826 |
3.71 |
0.05307 |
1.67 |
0.04828 |
2.19 |
0.05308 |
2.37 |
|
Total |
5.61444 |
3.17982 |
2.19972 |
2.24271 |
||||
|
Process EP (Kg PO4-eq) |
Scenario 1 |
Scenario 2 |
Scenario 3 |
Scenario 4 |
||||
|
Amount |
% |
Amount |
% |
Amount |
% |
Amount |
% |
|
|
Strain production |
0.00041 |
1.44 |
0.00018 |
1.28 |
0.00123 |
9.28 |
0.00084 |
6.46 |
|
Cultivation |
0.02771 |
97.60 |
0.01356 |
96.72 |
0.01175 |
88.68 |
0.01188 |
91.38 |
|
Harvest & drying |
0.00027 |
0.95 |
0.00028 |
2.00 |
0.00027 |
2.04 |
0.00028 |
2.15 |
|
Total |
0.02839 |
0.01402 |
0.01325 |
0.013 |
||||
|
Process AP (Kg SO2-eq) |
Scenario 1 |
Scenario 2 |
Scenario 3 |
Scenario 4 |
||||
|
Amount |
% |
Amount |
% |
Amount |
% |
Amount |
% |
|
|
Strain production |
0.001 |
4.16 |
0.00045 |
3.12 |
0.00085 |
8.89 |
0.00085 |
8.74 |
|
Cultivation |
0.02281 |
94.96 |
0.01374 |
95.22 |
0.0085 |
88.91 |
0.00864 |
88.80 |
|
Harvest & drying |
0.00021 |
0.87 |
0.00024 |
1.66 |
0.00021 |
2.20 |
0.00024 |
2.47 |
|
Total |
0.02402 |
0.01443 |
0.00956 |
0.00973 |
||||
|
Process HTC (Kg 1.4 DB-eq) |
Scenario 1 |
Scenario 2 |
Scenario 3 |
Scenario 4 |
||||
|
Amount |
% |
Amount |
% |
Amount |
% |
Amount |
% |
|
|
Strain production |
0.04828 |
0.86 |
0.08398 |
3.12 |
0.15853 |
10.10 |
0.15854 |
9.76 |
|
Cultivation |
5.3579 |
95.43 |
2.56508 |
95.32 |
1.37727 |
87.76 |
1.424 |
87.65 |
|
Harvest & drying |
0.20826 |
3.71 |
0.04204 |
1.56 |
0.03352 |
2.14 |
0.04204 |
2.59 |
|
Total |
5.61444 |
2.6911 |
1.56932 |
1.62458 |
||||
Figure 5. Contribution analysis of different biomass production systems on several impact categories global warming potential (A), eutrophication (B), acidification (C), and human toxicity (D)
The use of chemical fertilizers in scenarios 1 and 2 leads to the anthropogenic influx of heavy metals into the environment, which causes carcinogenesis indirectly [42]. Furthermore, energy usage contributes significantly to human carcinogenic toxicity. Selenium emissions in water during power production have an impact on human health [43]. During the electricity production process, chromium and aromatics are also emitted [44].
Acidification in the environment is caused by the precipitation of inorganic compounds such as sulfates, nitrates, and phosphates [45]. Any change in the acidification of the environment causes significant changes in the ecosystem. Sulfur oxide is a potential contributor to acid rain, which aids acidification indirectly [46]. In the instance of this study's culture, acidification is mainly caused by indirect SO2 emissions related to energy and fertilizer manufacturing. According to the LCA data, Scenario 1 has a more significant acidification potential of 0.024 Kg SO2-eq than the other scenarios because it uses more electricity and fertilizer to generate per functional unit.
Wastewater generally contains NH4, NO2, NO3, and H2PO4, which are nutrients suitable for microalgae growth [47]. In addition to being able to reduce N and P in wastewater, microalgae can minimize heavy metals present in wastewater [48]. Thus, the water that is passed on to the disposal will have a low environmental impact. The results obtained are in line with several studies conducted that the cultivation process has an environmental impact, especially GWP in the range of 65-85% [49]. Collet et al. [50] have conducted research one of the alternative ways to minimize the impact of GWP is to modify the electricity sources used, such as wind turbines or photovoltaic panels, which are more environmentally friendly. In addition, the selection of microalgae species used also affects the use of electrical energy because each species has a different growth rate according to the environmental conditions and media used [51].
Biomass production systems that do not use wastewater require additional fertilizer for microalgae nutrition. The use of this fertilizer accounts for the largest contribution to GHG emissions [39]. Nitrogen fertilizers have the largest contribution among various types of fertilizer [52].
Meanwhile, the microalgae biomass production system, by utilizing wastewater, aims to reduce or eliminate nutrients in the waste. This effort is the advantage of a simple and feasible system, both economically and technically. The production system with a combined method of bio-fixation of CO2 emissions and wastewater is an important recommendation in the field of microalgae cultivation knowledge. This system is very suitable to be applied to densely populated land around the industry [53].
3.4 Techno-economic assessment of coupled CO2 bio-fixation and wastewater treatment
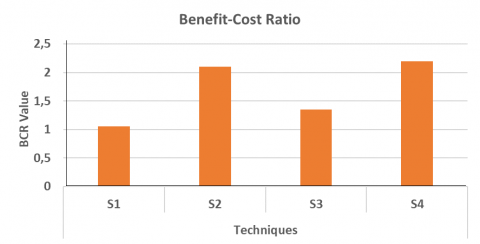
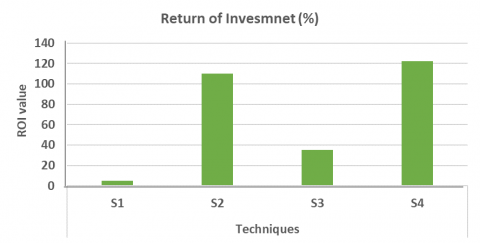
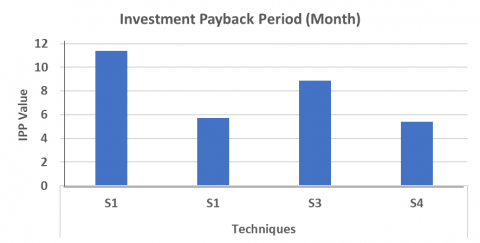
Techno-economic analysis with 3 parameters namely 1) Benefit-Cost Ratio (BCR), 2) Return of Investment (%) (RoI), and 3) Investment Payback Period (Month) (IPP). Bio-fixation techniques showed a prospective effect on the production of microalgae biomass, which increased significantly. In addition, the cultivation technique using industrial wastewater has been shown to be able to substitute media for growing microalgae. By determining the selling price of US $6.7 biomass, then IPP the best technique is using bio-fixation and wastewater, which is 5.39 months. The difference in the values of the three economic parameters on microalgae cultivation techniques is more clearly shown in Figure 6.
(A)
(B)
(C)
Figure 6. Technical economic graph of microalgae consortium cultivation using bio-fixation technique and wastewater treatment. Economic parameters: (A) Benefit Cost Ratio, (B) Return of Investment (%) and (C) Investment Payback Period (Month). echnique Scenarios (S): S1=(-B, -W)= Without biofixation, without wastewater; S2=(+B, -W) = Using biofixation and without wastewater; S3=(-B, +W) = Without biofixation, using wastewater; S4=(+B, +W) = Using biofixation, using wastewater
Figure 6A showed that the highest BCR on treatment using bio-fixation and wastewater is not significantly different from treatment using bio-fixation and without wastewater. The data showed that bio-fixation and wastewater increased yield significantly (Figures 6A, B, and C) which in turn increased the benefit of the project. Higher profit will increase the BCR value.
Data on RoI (Figure 6B) showed the highest value for bio-fixation and wastewater and is also not significantly different from treatment using bio-fixation and without wastewater. This is positively correlated with data on payback period (Figure 6C) which showed the fastest payback period for bio-fixation and wastewater and is also not significantly different from treatment using bio-fixation and without wastewater.
Treatment of CO2 bio-fixation and wastewater (scenario 4) and CO2 bio-fixation and without wastewater (scenario 2) showed an insignificant difference which indicate that bio-fixation using microalgae is the key to high production of the production system. Therefore, treatment with CO2 bio-fixation coupled with wastewater treatment will ensure higher revenue for the microalgae production system [25]. Increased CO2 bio-fixation can be regulated using phytohormones [40].
The best TEA in this experiment was produced from the CO2 bio-fixation couple experiment with wastewater treatment. Based on the selling price of dry microalgae biomass $6.7 per 1 kg, calculated with the production for 30 days of cultivation of 215 kg, the resulting BCR 2.22, RoI 122%, and IPP 5.4 months. A similar TEA experiment on microalgae cultivation without CO2 bio-fixation has reported that the selling price of dried microalgae is $100 per 1 kg. Other experiments reported results to indicate that the proposed system is capable of capturing 6.8 x 10 metric tons of CO2 for a plant life of 30 years, corresponding to a biomass production selling price of $2322 per dry tonne for a best-case scenario.
Microalgae industry in Indonesia is a promising industry that is indicated by benefit cost ratio (BCR) of more than 1% and a payback period (PP) of around 6 months. Therefore, these small and medium enterprises should be assisted with ecolabelling to penetrate the international market.
Microalgae cultivation and the integration of CO2 bio-fixation, there was a change in the character of the wastewater. The decrease occurred in organic materials, which means that microalgae play a role in degrading pollutants in wastewater. Organic materials in wastewater are useful as nutrients for microalgae biomass production. On average, according to this research, dry biomass yields in microalgae wastewater treatment systems range from 5.8 to 8.6 g/L biomass of wastewater treated. The findings of the present study suggest that milk factory wastewater can be directly used for mass cultivation of microalgae without requiring additional nutrient supplements, decreasing microalgae production costs.
Overall, the environmental impacts of the 4 impact categories on the initial method of biomass production (scenarios 1 and 2) have a higher environmental impact than the advanced methods using wastewater treatment and flue gas (scenarios 3 and 4). The highest value for GWP, HTC, and EP occurred in scenario 1 due to the use of electricity and urea fertilizer during cultivation. On the other hand, scenarios 3 and 4 have a low impact value because the input fertilizer is replaced by wastewater (scenario 3) and additional nutrients from flue gas injection (scenario 4). Another significant fact is that the lowest EP occurred in scenario 4, which used flue gas and wastewater for microalgae cultivation.
Microalgae production was analyzed in this study using TEA. The investment cost for microalgae production is US $7,000 per kg of dry biomass, in a pond capacity of 10 m3. The integrated technology of CO2 bio-fixation and wastewater treatment (scenario 4) produces 215 kg of dry microalgae biomass per 30 days of cultivation, BCR 2.22, RoI 122%, and IPP 5.4 months. The results of the IPP calculation show that microalgae production is economically feasible within 5.4 months. CO2 bio-fixation technology integrated with wastewater treatment is more profitable than technology without both treatments (scenario 1). This is indicated by the production of only 98 kg of biomass in the same cultivation time, resulting in a BCR of 1.04, RoI of 5%, and IPP of 11 months.
The results of LCA and TEA analysis show that the use of flue gas through bio-fixation and wastewater as microalgae nutrition is very profitable. So that these two sources of contamination have the potential for microalgae production which is applied in a densely populated industrial environment. Increasing the profitability of the investment, important considering the location of the microalgae biomass production plant, is achieved under certain conditions. In addition, it is important to consider local realities, prioritizing the use of local resources, low energy-intensive technologies, or renewable energy in manufacturing facilities, thereby lowering the cost of microalgae production.
This is a system that will benefit not only from environmental (reducing waste and GHG) and public health aspects but also from economic aspects (reducing operational costs). This is the implementation of a sustainable industry. The results of this research open up opportunities to carry out further research, namely modeling a comprehensive and integrated system that involves all interrelated components, where interventions can be carried out to optimize various scenarios in the system.
The authors would like to thank PT Indolakto Tbk for granting permission for the research, as well as Head of the Research Center for Sustainable Production System and Life Cycle Assessment, National Research and Innovation Agency Indonesia.
This research was funded by Research Center for Environmental and Clean Technology and the Indonesian Ministry of Research and Technology.
|
AP |
Acidification Potential |
|
BOD |
Biological Oxygen Demand |
|
BCR |
Benefit-cost Ratio |
|
℃ |
Celsius degree |
|
CO2 |
Carbon dioxide |
|
COD |
Chemical Oxygen Demand |
|
CH4 |
Methane is marsh gas or methyl hydride |
|
CML-IA |
a database that contains characterization factors for life cycle impact assessment (LCIA) and is easily read by the CMLCA software program. |
|
DO |
Dissolved Oxygen |
|
EP |
Eutrophication Potential |
|
GHG |
Green House Gas |
|
g/L |
Gram per liter |
|
GWP |
Global Warming Potential |
|
HTC |
Human toxicity |
|
K |
Kalium/Potassium |
|
kg CO2-eq |
kilogram of carbon dioxide equivalent per kilogram |
|
kg DB-eq |
kilogram dichlorobenzene equivalent per kilogram |
|
k/L/d |
Kilogram per liter per day |
|
kg PO4-eq |
kilogram of phosphate equivalent per kilogram |
|
LCA |
Life Cycle Assessment |
|
LCIA |
Life Cycle Impact Assessment |
|
N |
Nitrogen |
|
N-NO3 |
Nitrate measurement |
|
Nf and Ni |
the biomass at time f (Tf) and time i (Ti), respectively |
|
P-PO4 |
Phosphate measurement |
|
POME |
Palm Oil Mill Effluent |
|
PT |
Perseroan Terbatas (limited liability company) |
|
P |
Phosphate |
|
PP |
Pay-back Period |
|
ppm |
Part per million |
|
RoI |
Return of Investment |
|
RPM |
Revolution Per Minute |
|
SS |
Suspended Solids |
|
Tbk |
Terbuka (open) |
|
TS |
Total Solids |
|
TEA |
Techno-economic Analysis |
|
VS |
Volatile Solids |
|
WC |
Water Content |
|
WWT |
Waste Water Treatment |
|
GREEK SYMBOLS |
|
|
µ |
dynamic viscosity, kg. m-1.s-1 |
|
% |
Percent |
[1] Masson-Delmotte, V., Zhai, P., Pirani, A., et al. (2021). Climate change 2021: The physical science basis. Contribution of working group I to the sixth assessment report of the intergovernmental panel on climate change.
[2] Lions, J., Devau, N., de Lary, L., Dupraz, S., Parmentier, M., Gombert, P., Dictor, M.C. (2014). Potential impacts of leakage from CO2 geological storage on geochemical processes controlling fresh groundwater quality: A review. International Journal of Greenhouse Gas Control, 22: 165-175. https://doi.org/10.1016/j.ijggc.2013.12.019
[3] Pires, J.C. (2019). Biosequestration of carbon dioxide from flue gases by algae. In Advances in Feedstock Conversion Technologies for Alternative Fuels and Bioproducts, pp. 105-118. https://doi.org/10.1016/B978-0-12-817937-6.00006-0
[4] Zhang, W., Liu, C. (2012). Some thoughts on global climate change: Will it get warmer and warmer? Environ. Skept. Critics. http://www.taccire.sua.ac.tz/handle/123456789/152.
[5] Goswami, R.K., Mehariya, S., Karthikeyan, O.P., Gupta, V.K., Verma, P. (2022). Multifaceted application of microalgal biomass integrated with carbon dioxide reduction and wastewater remediation: A flexible concept for sustainable environment. Journal of Cleaner Production, 130654. https://doi.org/10.1016/j.jclepro.2022.130654
[6] Arcila, J.S., Céspedes, D., Buitrón, G. (2021). Influence of wavelength photoperiods and N/P ratio on wastewater treatment with microalgae–bacteria. Water Science and Technology, 84(3): 712-724. https://doi.org/10.2166/wst.2021.257
[7] Mustafa, S., Bhatti, H.N., Maqbool, M., Iqbal, M. (2021). Microalgae biosorption, bioaccumulation and biodegradation efficiency for the remediation of wastewater and carbon dioxide mitigation: Prospects, challenges and opportunities. Journal of Water Process Engineering, 41: 102009. https://doi.org/10.1016/j.jwpe.2021.102009
[8] Verdelho Vieira, V., Cadoret, J.P., Acien, F.G., Benemann, J. (2022). Clarification of most relevant concepts related to the microalgae production sector. Processes, 10(1): 175. https://doi.org/10.3390/pr10010175
[9] Handayani, T., Mulyanto, A., Priyanto, F.E. (2017). Growth performance of fresh water microalgae chlorella sp. exposed to carbon dioxide. International Journal of Environmental Science and Development, 8(11): 767-771. https://doi.org/10.18178/ijesd.2017.8.11.1054
[10] Molazadeh, M., Ahmadzadeh, H., Pourianfar, H.R., Lyon, S., Rampelotto, P.H. (2019). The use of microalgae for coupling wastewater treatment with CO2 biofixation. Frontiers in Bioengineering and Biotechnology, 7: 42. https://doi.org/10.3389/fbioe.2019.00042
[11] Rupawalla, Z., Robinson, N., Schmidt, S., et al. (2021). Algae biofertilisers promote sustainable food production and a circular nutrient economy–An integrated empirical-modelling study. Science of the Total Environment, 796: 148913. https://doi.org/10.1016/j.scitotenv.2021.148913
[12] Daneshvar, E., Wicker, R.J., Show, P.L., Bhatnagar, A. (2022). Biologically-mediated carbon capture and utilization by microalgae towards sustainable CO2 biofixation and biomass valorization–A review. Chemical Engineering Journal, 427: 130884. https://doi.org/10.1016/j.cej.2021.130884
[13] Richmond, A. (Ed.). (2008). Handbook of Microalgal Culture: Biotechnology and Applied Phycology. John Wiley & Sons.
[14] Sivakumar, G., Xu, J., Thompson, R.W., Yang, Y., Randol-Smith, P., Weathers, P.J. (2012). Integrated green algal technology for bioremediation and biofuel. Bioresource Technology, 107: 1-9. https://doi.org/10.1016/j.biortech.2011.12.091
[15] Su, Y. (2021). Revisiting carbon, nitrogen, and phosphorus metabolisms in microalgae for wastewater treatment. Science of the Total Environment, 762: 144590. https://doi.org/10.1016/j.scitotenv.2020.144590
[16] Alias, A.B., Mishra, S., Pendharkar, G., Chen, C.S., Liu, C.H., Liu, Y.J., Yao, D.J. (2022). Microfluidic microalgae system: A review. Molecules, 27(6): 1910. https://doi.org/10.3390/molecules27061910
[17] Wang, W., Teh, W.H. (2010). Green energy harvesting technology in 3D IC. In the 2010 International Conference on Green Circuits and Systems, pp. 5-8. https://doi.org/10.1109/ICGCS.2010.5543108
[18] Li, K., Liu, Q., Fang, F., et al. (2019). Microalgae-based wastewater treatment for nutrients recovery: A review. Bioresource Technology, 291: 121934. https://doi.org/10.1016/j.biortech.2019.121934
[19] Cai, T., Park, S.Y., Li, Y. (2013). Nutrient recovery from wastewater streams by microalgae: Status and prospects. Renewable and Sustainable Energy Reviews, 19: 360-369. https://doi.org/10.1016/j.rser.2012.11.030
[20] Santoso, A.D., Hariyanti, J., Pinardi, D., Kusretuwardani, K., Widyastuti, N., Djarot, I.N., Handayani, T., Sitomurni, A.I., Apriyanto, H. (2023). Sustainability index analysis of the black soldier fly (Hermetia illucens) cultivation from food waste substrate. Global Journal of Environmental Science and Management, 9(3): 559-576. https://doi.org/10.22034/gjesm.2023.03.13
[21] Hariz, H.B., Takriff, M.S., Yasin, N.H.M., Ba-Abbad, M.M., Hakimi, N.I.N.M. (2019). Potential of the microalgae-based integrated wastewater treatment and CO2 fixation system to treat Palm Oil Mill Effluent (POME) by indigenous microalgae; Scenedesmus sp. and Chlorella sp. Journal of Water Process Engineering, 32: 100907. https://doi.org/10.1016/j.jwpe.2019.100907
[22] Pérez, K., Ibarra, D., Ballen-Segura, M. (2020). Modelling biodiesel production from microalgae, using industrial wastewater as a growth medium. Ingeniare: Revista Chilena de Ingenieria, 28(4): 744-754. https://doi.org/10.4067/S0718-33052020000400744
[23] Maghzian, A., Aslani, A., Zahedi, R. (2022). Review on the direct air CO2 capture by microalgae: Bibliographic mapping. Energy Reports, 8: 3337-3349. https://doi.org/10.1016/j.egyr.2022.02.125
[24] Shively, G., Galopin, M. (2013). An overview of benefit-cost analysis. http://www.agecon.purdue.edu/staff/shively/COURSES/AGEC406/reviews/bca.htm.
[25] Zimmermann, A.W., Wunderlich, J., Müller, L., Buchner, G.A., Marxen, A., Michailos, S., Armstrong, K., Naims, H., McCord, S., Styring, P., Sick, V., Schomäcker, R. (2020). Techno-economic assessment guidelines for CO2 utilization. Frontiers in Energy Research, 8: 5. https://doi.org/10.3389/fenrg.2020.00005
[26] Handayani, T., Mulyanto, A., Priyanto, F.E., Nugroho, R. (2020). Utilization of dairy industry wastewater for nutrition of microalgae Chlorella vulgaris. Journal of Physics: Conference Series, 1655(1): 012123. https://doi.org/10.1088/1742-6596/1655/1/012123
[27] Chaudhary, R., Dikshit, A.K., Tong, Y.W. (2018). Carbon-dioxide biofixation and phycoremediation of municipal wastewater using Chlorella vulgaris and Scenedesmus obliquus. Environmental Science and Pollution Research, 25: 20399-20406. https://doi.org/10.1007/s11356-017-9575-3
[28] Sruthi, V., Jyothirmai, P., Anagha, E., Aishwarya, S., Nair, A.T., Chakraborty, S., Sivagami, K. (2022). Microalgae coupled biofuel production and carbon capture from thermal power plant: A biorefinery approach. In Zero Waste Biorefinery, pp. 325-343. https://doi.org/10.1007/978-981-16-8682-5_12
[29] APHA. (2005). Standard Methods for the Examination of Water and Wastewater. Stand. Methods.
[30] Balanica, C.D., Muntenita, C.R.I.S.T.I.A.N., Zeca, D.E., Stoica, M.A.R.I.C.I.C.A. (2020). Statistical analysis of the physicochemical characteristics of urban wastewater treatment plants from Romania. Revista De Chimie, 71(10): 100-107. https://doi.org/10.37358/RC.20.10.8354
[31] Andersen, R.A. (2005). Algal Culturing Techniques. Elsevier.
[32] Boedisantoso, R., Setoaji, L., Slamet, A., Hermana, J. (2014). Absorption capability of carbon dioxide (CO2) by algae phylum chlorophytain reducing carbon emissions in urban area. Journal of Applied Environmental and Biological Sciences, 4(1): 94-99. https://www.textroad.com/pdf/JAEBS/J.%20Appl.%20Environ.%20Biol.%20Sci.,%204(1)94-99,%202014.pdf.
[33] Lefebvre, T., Talbi, A., Atwi-Ghaddar, S., Destandau, E., Lesellier, E. (2020). Development of an analytical method for chlorophyll pigments separation by reversed-phase supercritical fluid chromatography. Journal of Chromatography A, 1612: 460643. https://doi.org/10.1016/j.chroma.2019.460643
[34] CML - Department of Industrial Ecology. (2016). CML-IA Characterisation Factors. Universiteit Leiden.
[35] GreenDeLTa. (2021). openLCA. GreenDeLTa.
[36] Hazman, N.A.S., Yasin, N.H.M., Takriff, M.S., Hasan, H.A., Kamarudin, K.F., Hakimi, N.I.N.M. (2018). Integrated palm oil mill effluent treatment and CO2 sequestration by microalgae. Sains Malaysiana, 47(7): 1455-1464. https://doi.org/10.17576/jsm-2018-4707-13
[37] Collotta, M., Champagne, P., Mabee, W., Tomasoni, G., Leite, G.B., Busi, L., Alberti, M. (2017). Comparative LCA of flocculation for the harvesting of microalgae for biofuels production. Procedia CIRP, 61: 756-760. https://doi.org/10.1016/j.procir.2016.11.146
[38] Mu, D., Min, M., Krohn, B., Mullins, K.A., Ruan, R., Hill, J. (2014). Life cycle environmental impacts of wastewater-based algal biofuels. Environmental Science & Technology, 48(19): 11696-11704. https://doi.org/10.1021/es5027689
[39] Papadaki, S., Kyriakopoulou, K., Tzovenis, I., Krokida, M. (2017). Environmental impact of phycocyanin recovery from Spirulina platensis cyanobacterium. Innovative Food Science & Emerging Technologies, 44: 217-223. https://doi.org/10.1016/j.ifset.2017.02.014
[40] Perez-Garcia, O., Escalante, F.M., De-Bashan, L.E., Bashan, Y. (2011). Heterotrophic cultures of microalgae: Metabolism and potential products. Water Research, 45(1): 11-36. https://doi.org/10.1016/j.watres.2010.08.037
[41] Hawrot-Paw, M., Koniuszy, A., Gałczyńska, M., Zając, G., Szyszlak-Bargłowicz, J. (2019). Production of microalgal biomass using aquaculture wastewater as growth medium. Water, 12(1): 106. https://doi.org/10.3390/w12010106
[42] Ali, H., Khan, E., Ilahi, I. (2019). Environmental chemistry and ecotoxicology of hazardous heavy metals: Environmental persistence, toxicity, and bioaccumulation. Journal of Chemistry, 2019: 6730305. https://doi.org/10.1155/2019/6730305
[43] Wang, L., Wang, Y., Du, H., Zuo, J., Li, R.Y.M., Zhou, Z., Bi, F.& Garvlehn, M.P. (2019). A comparative life-cycle assessment of hydro-, nuclear and wind power: A China study. Applied Energy, 249: 37-45. https://doi.org/10.1016/j.apenergy.2019.04.099
[44] Pérez-López, P., González-García, S., Jeffryes, C., Agathos, S.N., McHugh, E., Walsh, D., Murray, P., Moane, S., Feijoo, G., Moreira, M.T. (2014). Life cycle assessment of the production of the red antioxidant carotenoid astaxanthin by microalgae: From lab to pilot scale. Journal of Cleaner Production, 64: 332-344. https://doi.org/10.1016/j.jclepro.2013.07.011
[45] Bhuyan, M.B., Hasanuzzaman, M., Mahmud, J.A., Hossain, M.S., Alam, M.U., Fujita, M. (2019). Explicating physiological and biochemical responses of wheat cultivars under acidity stress: Insight into the antioxidant defense and glyoxalase systems. Physiology and Molecular Biology of Plants, 25: 865-879. https://doi.org/10.1007/s12298-019-00678-0
[46] Mu, D., Xin, C., Zhou, W. (2020). Life cycle assessment and techno-economic analysis of algal biofuel production. Microalgae Cultivation for Biofuels Production, 281-292. https://doi.org/10.1016/B978-0-12-817536-1.00018-7
[47] Baldev, E., Ali, D.M., Pugazhendhi, A., Thajuddin, N. (2021). Wastewater as an economical and ecofriendly green medium for microalgal biofuel production. Fuel, 294: 120484. https://doi.org/10.1016/j.fuel.2021.120484
[48] Aggarwal, M., Remya, N. (2021). The state-of-the-art production of biofuel from microalgae with simultaneous wastewater treatment: Influence of process variables on biofuel yield and production cost. BioEnergy Research, 1-15. https://doi.org/10.1007/s12155-021-10277-1
[49] Chamkalani, A., Zendehboudi, S., Rezaei, N., Hawboldt, K. (2020). A critical review on life cycle analysis of algae biodiesel: Current challenges and future prospects. Renewable and Sustainable Energy Reviews, 134: 110143. https://doi.org/10.1016/j.rser.2020.110143
[50] Collet, P., Hélias, A., Lardon, L., Steyer, J.P., Bernard, O. (2015). Recommendations for Life Cycle Assessment of algal fuels. Applied Energy, 154: 1089-1102. https://doi.org/10.1016/j.apenergy.2015.03.056
[51] Speranza, L.G., Ingram, A., Leeke, G.A. (2015). Assessment of algae biodiesel viability based on the area requirement in the European Union, United States and Brazil. Renewable Energy, 78: 406-417. https://doi.org/10.1016/j.renene.2014.12.059
[52] Medeiros, D.L., Sales, E.A., Kiperstok, A. (2015). Energy production from microalgae biomass: Carbon footprint and energy balance. Journal of Cleaner Production, 96: 493-500. https://doi.org/10.1016/j.jclepro.2014.07.038
[53] Usher, P.K., Ross, A.B., Camargo-Valero, M.A., Tomlin, A.S., Gale, W.F. (2014). An overview of the potential environmental impacts of large-scale microalgae cultivation. Biofuels, 5(3): 331-349. https://doi.org/10.1080/17597269.2014.913925