Li Zhang*![]() | Liang Tang
| Liang Tang![]()
© 2023 IIETA. This article is published by IIETA and is licensed under the CC BY 4.0 license (http://creativecommons.org/licenses/by/4.0/).
OPEN ACCESS
In February 2017, as the first multilateral agreement on trade since the establishment of the WTO, the Trade Facilitation Agreement (TFA) came into effect. Hitherto, however, there is still very little evidence on the factual effect of trade facilitation on promoting international trade. Based on panel data from 2017-2021, using a trade gravity model and the least squares regression analysis, this paper explores the impact of the implementation of the TFA on the import and export values between China and five RCEP countries (Indonesia, Malaysia, Singapore, Thailand, and Vietnam). The results demonstrate that China's trade facilitation level is significantly and positively related to the trade flow of goods. In addition, the population size of RCEP countries is also positively correlated with the trade flows between the two sides. 1 per cent of Trade Facilitation Index (TFI) can increase trade flows by US$10,352.9 million. It is recommended to actively promote the development of trade facilitation, including the formation of RCEP logistics industry alliance, the establishment of one-stop digital customs, the acceleration of Cross-border E-commerce, as well as the reasonable use of blockchain.
trade facilitation, TFA, RCEP, trade gravity model, blockchain, Cross-border E-commerce
On November 15,2020, RCEP was formed by 15 countries - the Association of Southeast Asian Nations (ASEAN), Japan, South Korea, Australia, New Zealand and China. Regional Comprehensive Economic Partnership (RCEP) is considered to be the largest FTA in the world - It has GDP of US\$26 trillion, total exports of US \$5.2 trillion, and a total population of 2.27 -billion. The establishment of RCEP will promote the liberalization and facilitation of cross-border trade and investment in the region. The commitments of all members are to eliminate around 90% of tariffs, remove non-tariff barriers, and to accelerate economic growth. It aims to establish common rules for trade and e-commerce, not only releasing a strong signal against unilateralism and protectionism, but also representing the re-establishment of a new globalization order. In recent years, China's trade with RCEP members is expanding continuously. From 2001 to 2019, China's total exports to RCEP partner countries rose from 79.839 billion US Dollars to \$668.2997 billion US Dollars, increased by 8.371 times, with an average annual growth rate of 12.529%; China's imports from RCEP partner countries rose from 95.541 billion US Dollars to 758.848 billion US Dollars, increased by 7.943 times, with an average annual growth rate of 12.201%. In 2022, China's foreign trade with other members of RCEP reached RMB 12.95 trillion, representing a 7.5% increase year-on-year. In the first 4 months of 2023, China's total import and export with other RCEP members amounted to RMB 4.12 trillion, up 7.3% compared to the same period last year, accounting for 30.9% of China's total imports and exports. In terms of attracting foreign investment, in 2022, China actually utilized $23.53 billion of investment from RCEP partners, up 23.1% year-on-year. In the first 4 months of 2023, China has an actual use of about 8.9 billion US Dollars of investment from RCEP members, up more than 13.7% year-on-year. RCEP has been integrating the differences between different FTAs and seeks an "Asian solution" based on the common interests of the region, with the purpose of promoting the integrated development of the Asia-Pacific region's value chain and elevating the region's important position in the global economic system. Therefore, China, as an important participant, needs to explore the opportunities to promote the active negotiation among countries, support the facilitation of trade and investment within the scope of RCEP, and fully unleash the potential and efficiency of trade with RCEP partner countries [1].
Trade facilitation is the simplification of trade processes and the reduction of trade costs through policy regime, facilities and technology. The objective is to simplify trade procedures adopted by governments (mainly at border), adopt advanced technology and facilities to enhance trade efficiency [2]. Wilson et al. [3] suggested that there was no definite definition of trade facilitation. In a narrower sense, trade facilitation pertains to enhancing the efficiency of customs logistics at ports or borders in cross-border trade, A wider definition incorporates the business environment, the optimization and simplification of customs clearance systems at ports,and the compliance with and adaptation to the rules of international and other regional economies.
The TFA came into effect in February 2017 following ratification by 2/3 of WTO members. It is the first multilateral trade agreement since the establishment of the WTO in 1995. The TFA aims to simplify international trade logistics and reduce logistics costs by promoting best practices for managing the movement of goods across international borders, such as the unification and simplification of required document, electronic transfer of goods data, transparency and justification decision of custom authority [3]. Beverelli and Ticku [4] demonstrated that trade facilitation measures, including simplifying border procedures, can reduce tariff evasion caused by under-reporting of import values. Laboni et al. [5] demonstrated the crucial significance of trade facilitation in promoting economic growth in Bangladesh. Ge [6] analyzed the current situation of trade facilitation development in ASEAN from four major indicators: institutional environment, customs environment, port efficiency, and e-commerce, and put forward corresponding suggestions. Qi et al. [7] measured the trade facilitation level of "the Belt and Road" states from 2010 to 2019, and used a stochastic frontier gravity model to discover the efficacy of trade facilitation on the import and export volume between China and countries along "Belt and Road". Research has found that the trade facilitation levels in most countries along the route are relatively low, and there is a close relationship between the scale of economic development, infrastructure construction, and trade regulation management environment with their level of trade facilitation.
Although WTO predicted that TFA would bring welfare to economy, empirical evidence of the implementation of TFA remains very limited [4]. Based on panel data from 2017-2021, using a trade gravity model and the least squares regression analysis, this paper explores the efficacy of the implementation of the Trade Facilitation Agreement on the total import and export volume between China and the five RCEP states (Indonesia, Malaysia, Singapore, Thailand, and Vietnam).
The extensive prior literature on trade facilitation can be broadly categorized into three types: the effect of trade facilitation upon trade cost, on Import & Export, and on firms.
2.1 Role of trade facilitation in reducing trade costs
Some of existed literatures confirm the significant function of trade facilitation in cutting trade costs. According to the Asian Development Bank’s research, trade facilitation costs account for about 1 to 15 percent of the total import and export trade value. Implementing trade facilitation measures in developed and developing countries can respectively save trade costs by more than 10 percent and 15 percent [8]. Hillberry and Zurita-Castro [2] hold that the Implementation of the TFA proposed by WTO has reduced trade costs by an average of 1 to 4 percent. Full implementation of the TFA is expected to cut trade costs by 14.3% [9, 10]. By implementing TFA, Bangladesh is able to upgrade its trade competitiveness through saving the time and costs related to importing and exporting merchandise [5]. Trade facilitation promotes the participation in global value chains and bonus of trade benefits for Belt and Road countries through two mechanisms: reducing trade costs and enhancing technology spillovers [11].
2.2 Effect upon import and export
Another category of literature employs the gravity model to investigate the influence of trade facilitation upon Import & Export. For instance, research by Yu et al. [12] suggests a strong correlation between improved trade facilitation measures and increased exports. Assuming a 10 per cent improvement in infrastructure development, the average export volume would increase by 10 per cent. A study by Cui et al. [13] concludes that improvements in trade facilitation are able to significantly raise the level of foreign trade in Chinese provinces. Zhi [14] concluded that the positive effect of the level of trade facilitation was more pronounced in middle and high-income economies than in low-income economies. Zhan [15] demonstrated that cutting the time needed to go through customs will result in a 16.33% increase in the volume of China's agricultural exports. Meng and Wang [16] pointed out that trade facilitation can increase the complexity of export technology. The enforcement of FTA proposed by WTO resulted in a 14% rise in the varieties of products exported by APEC, where the availability of information, participation of trade organizations, appealing procedures, governance and fairness had a strong impact on the diversity of exported commodities [17].
2.3 Influence upon firms
The third type of research concerns the influence on firms. Reforms in trade facilitation orientation can increase firm profits, facilitate technology spillovers, and can reduce resource mismatches, and thereby can increase the degree and likelihood of technological upgrading by firms [18]. Exporting a commodity like rice in some trade-friendly Asian countries requires the participation of 15 parties, the use of 24 documents, and around 22 days to go through the various formalities and prepare the goods for export at the closest port. In general, the direct and indirect expenses linked to these procedures are approximately 7% to 10% of the total value of worldwide trade [10]. Ma et al. [19] found empirically that trade facilitation significantly promotes the export quality of processed agricultural products in “Belt and Road” countries through the channels of improving the efficiency of ports and changing the regulatory environment. In China, trade facilitation level has a significant effect upon the operational performance improvement of Cross-border E-commerce enterprises, showing regional heterogeneity [20]. During Covid times, efficient trade facilitation measures are essential to counteract the time and cost increments encountered by firms and consumers due to supply chains disruption [21]. Ismail [22] demonstrated that digital infrastructure alone is insufficient, it must also be underpinned by intensity of usage by enterprises and consumers, as well as strong Internet security for trade. Liu [23] proved with an empirical test that trade facilitation significantly promotes the development of commerce circulation enterprises. Commerce circulation industry refers to the circulation of commodities and the industries that provide services for the circulation of commodities, mainly including wholesale, retail, catering and warehousing. Duan et al. [24] discovered that trade facilitation has a "U" shaped impact on firms' supply chain localization. Xiao et al. [25] verified through an empirical study that trade facilitation is crucial in improving the technology sophistication of Chinese manufacturers. It takes a long period of time for the promotion effect to appear, because the technology absorption capacity of enterprises is also a key factor affecting the innovation capacity of enterprises [26].
2.4 Conclusion
An examination of the pertinent literature [1-26] indicates that the focus of the studies is mainly on the correlation between trade facilitation and costs, imports and exports, and enterprises. However, research on the effect of TFA implementation upon RCEP import and export trade volume is sparse. This paper takes the perspective of TFA, and utilize the trade gravity model to study empirically how TFA impacts the trade flows between RCEP-China. It aims to measure the impact of trade facilitation on RCEP trade volume, providing ideas and references to strengthen trade cooperation among RCEP, increase RCEP's import and export of goods, and at the same time to enrich the relevant research on international trade.
In 1687, in his book 'Mathematical Principles of Natural Philosophy', Newton introduced the law of gravitation, stating that all matter attracts each other gravitationally, and that the magnitude of this attractive force is directly proportional to the masses of the substances, and inversely proportional to the square of their distance from each other. In 1962, Tinbergen was the first to apply the law of gravity to analyze the development of a market economy. This model posits that the flow of trade between two economies is directly proportional to their respective national economies (Gross Domestic Product, GDP) and inversely proportional to the distance between them [27].
It is generally believed that, in the absence of trade frictions, the size of bilateral trade is directly proportional to its the size of their economies and inversely proportional to the geographical distance between the two countries. This is the gravity model of trade:
$X_{i j}=K \frac{\left(Y_i\right)^a\left(Y_j\right)^b}{\left(1+e D_{i j}\right)^f}$ (1)
Eq. (1) defines the trade volume scale between two states, where $X_{i j}$ represents this scale, $Y_i$ and $Y_j$ represent the economic scale of states $i$ and $j$ respectively, and $D_{i j}$ denotes their geographical distance. Additionally, $K$ and $e$ are constants, while $\mathrm{a}$ and $\mathrm{b}$ are parameters. This formula indicates that the import and export trade value or the trade amount between two countries, $i$ and $j$, is proportional to their total national income represented by $Y_i$ and $Y_j$, respectively. However, the trade amount is inversely proportional to their geographical distance, represented by $D_{i j}$.
The trade gravity models to measure the flow of bilateral trade has been continuously expanded and improved. The extended trade gravity model often includes three types of additional variables: quantity variables, dummy variables, and index variables. Quantity variables are Variables that can be expressed numerically, such population, income, tax, etc. Dummy variables are qualitative indicators, including whether countries belong to the same preferential trade arrangement or regional economic integration organization, whether they have a common border, and whether they share the same language or culture. Index variables are usually comprehensive evaluation indicators, such as the degree of openness, institutional quality, government corruption index, quality of transportation infrastructure [28].
Most scholars use GDP, population, distance, and whether or not countries share a border as the main variables in trade gravity models. The increase in rail, road, sea and liner transport and the development of overseas warehouses have made factors of distance and bordering or not less important. An empirical study of trade efficiency in agricultural products shows that bordering China is not a major influence on trade efficiency [29]. A study by Qi et al. [7] found that neither the proximity nor bordering has a significant positive effect upon the trade flow between the two states. The finding suggests that as the level of accessibility and trade facilitation continues to rise, the benefits of trade between the two states will greatly outweigh the transportation costs. Thus, distance and bordering or not have a relatively small impact on trade development. Thus, the innovation of this paper is to remove the factors of distance and bordering or not, and attempts to apply the Trade Facilitation Index (TFI) in the trade gravity model. The model is set up as follows:
$\begin{aligned} & \ln T R A D E_{c a}=\beta_1 * \ln G D P_a+\beta_2 * \ln P O P_a+\beta_3^* \ln T F I_c+C+\mu\end{aligned}$ (2)
$T R A D E_{c a}$ represents the volume of goods trade between China and RCEP partner economies, for instance, total trade value. $G D P_a, P O P_a$ are respectively the GDP and population of RCEP economies. $T F I_c$ denotes China's trade facilitation index. $k_1, k_2, k_3$ denote various coefficients. The variables $\mathrm{m}$ and $\mu$ represent the constant and random error items, respectively.
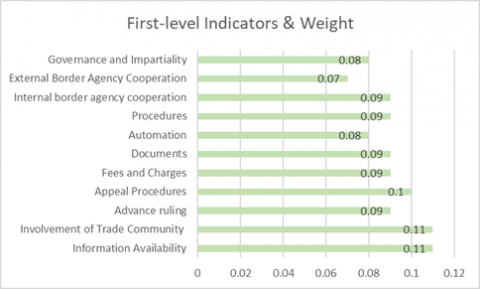
Figure 1. TFI First-level indicators & their weight
With the enforcement of TFA, trade facilitation has become an important component of national, regional and global trade policy reforms and openness. In order to assess China's implementation of TFA, Trade Facilitation Index (TFI) is organized from "Annual Report on China's Trade Facilitation" released by the Beijing Ruiku Centre for Trade Security and Facilitation Studies (https://www.re-code.org). With 11 First-level and 145 secondary indicators, TFI represents annual quantitative measurement of China's actual trade facilitation level. The primary indicators of TFI and their weight are shown in Figure 1.
The test results indicated that mathematical model (2) failed to reject the null hypothesis at 0.01 significance level. Furthermore, this model was amended by adding two more independent variables: China's Gross Domestic Product and China's population size, only to find the results are still not statistically significant.
When the initial economic variables exhibit an exponential relationship, using logarithms can transform the original relation into a linear one for analysis, simplifying the model. The regression coefficient derived from the logarithmic variable reveals the elasticity coefficient's economic significance.
Logarithmic functions are very handy and simple when dealing with different types of variables, such as GDP, population, unemployment rate, and inflation rate, facilitating the identification to identify trends and patterns. When applying the gravity model in empirical analysis, most scholars use log-linear equations due to their many conveniences. Some scholars have doubted the accuracy of this equation, holding that other functional forms may be more suitable for explaining bilateral trade flows as the raw data are often non-linear [18].
With regard to the effect of exogenous variables (like GDP, population) on trade flows, comparing with Logarithmic equation it is more appropriate and practical to use a linear equation. When calculating Trade volume, addition is more suitable than multiplication. If one more man can produce one more product, and then sell for one more dollar, the export value should be increased by one dollar. In view of that, model (2) is corrected, as shown in model (3):
$\begin{aligned} & T R A D E_{c a}=\beta_1 * G D P_a+\beta_2 * P O P_a+\beta_3^* T F I_c+C+\mu\end{aligned}$ (3)
Figure 2. China's total import & export trade value with 5 RCEP partners (in billion US dollars)
Indonesia, Singapore, Malaysia, Viet Nam and Thailand were selected for the study. First, these states are geographically close to China and all located in Asia. Second, they ranked high in terms of import and export volumes with China in both 2020 and 2021.Third, they are both RCEP and ASEAN members, and have already maintained long-term and stable cooperative relations with China. Finally, with China, they maintain friendly political relations and stable economic co-operation, which make them suitable for research objects since unstable external factors are able to be excluded like political disturbances and trade disputes. As indicated in Figure 2, China’s total import & export trade volume with these economies has been rising steadily in recent years.
The trade data in this article is from UN Comtrade; GDP (in 2015 constant USD) and population are both collected from World bank; TFI is collated from “Annual Report on China's Trade Facilitation”.
On the basis of the mathematical model (3), an OLS time series regression analysis was performed upon the balanced panel data from 2017-2021 via Eviews11 software. As shown in Table 1, the statistical results are economically significant.
The first step is to conduct a goodness-of-fit test. The R-squared value of this model is 0.80, close to 1, suggesting a good overall fitting effect.
The second step is to conduct a significance test. Start by examining the T-statistic values for the intercept and slope terms. As this study uses 25 observations, the T statistics must comply with the T-distribution with 23 degrees of freedom. Upon checking the T-distribution table in books, it is seen that the critical values for the degrees of freedom of 23, at levels of 0.05, and 0.01 are respectively 2.069, and 2.807. As shown in Table 1, the T statistics values of the constant term, GDP, population, and trade facilitation are respectively -3.793, -7.760, 6.285 and 5.024. The T-values of all independent variables are greater than the critical value at 0.01 level, which proves that the regression coefficients are significantly not equal to zero. Therefore, between these independent variables and the dependent variable there is a significant linear relationship. Furthermore, all P values of the coefficients in model (3) are less than, or at least equal to 0.001, indicating a highly significant correlation.
The Third step is to Perform an Augmented Dickey-Fuller (ADF) test on the residuals. The results yield a P-value of less than 0.01, which indicates that the residual sequence is stable since no unit root is found in accordance with the findings presented in Table 2. Then, a residual Q test is performed. The result shows that each of P value derived from the residual Q-test is more than 0.05, failing to reject null hypothesis and proving that there does not exist any autocorrelation in all time series.
Table 1. Model (3) time series OLS results
|
Variable |
Coefficient |
Std. Error |
T-Statistic |
Prob. |
|
C |
-595.0355 |
156.8647 |
-3.79331 |
0.0011 |
|
GDP |
-0.312155 |
0.040227 |
-7.75981 |
0.0000 |
|
Population |
0.724853 |
0.115334 |
6.284807 |
0.0000 |
|
TFI |
1035.286 |
206.0858 |
5.023569 |
0.0001 |
|
R2 |
0.798645 |
Mean dependent var |
111.8789 |
|
|
Adjusted R-squared |
0.769880 |
S.D. dependent var |
41.70999 |
|
|
S.E. of Regression |
20.00864 |
Akaike info Criterion |
8.975892 |
|
|
Sum squared resid |
8407.257 |
Schwarz criterion |
9.170872 |
|
|
Log Likelihood |
-108.1981 |
Hannan-Quinn criter |
9.029942 |
|
|
F-statistic |
27.76444 |
Duibin-Watson stat |
0.905590 |
|
|
Prob (F-statistic) |
0.000000 |
|
||
Table 2. Regression Residual Unit Root Test
|
Method |
Statistic |
Prob.** |
|
ADF-Fisher Chi-square |
26.1589 |
0.0035 |
|
ADF-Choi Z-stat |
-2.45919 |
0.0070 |
Finally, the Breusch-Godfrey test is performed. As the P-value is not significant (see Table 3), the initial hypothesis remains unchallenged, and the findings suggest the absence of any sequence correlation.
Table 3. Residual Sequence Correlation Test (BG Test)
|
Test |
Statistic |
d.f. |
Prob.** |
|
Breusch-Pagan LM |
15.78627 |
10 |
0.1059 |
|
Pesaran scaled LM |
1.293850 |
|
0.1957 |
|
Pesaran CD |
1.226252 |
|
0.2201 |
In summary, on the basis of the trade gravity model and its extended form, with reference to existing studies and the requirement of quantitative feasibility of this study, the study selected trade volume of RCEP-China as the explanatory variable, GDP, population quantity, and TFI as the explanatory variables to construct the time-series OLS model, and then, analyzed the panel data of China and five RCEP partners (Indonesia, Malaysia, Singapore, Thailand, and Vietnam) from 2017-2021, via Eviews software. The results show that the trade flow of RCEP-China is significantly correlated with China’s TFI, and GDP and population of RCEP countries.
5.1 Results and discussion
Since 4 September 2015, when China submitted its acceptance of the Protocol of TFA to WTO, China has been consistently deepening its trade facilitation reforms. China has been building a trade single window platform since 2014, aiming to integrate. trade approval and regulatory responsibilities of various departments to achieve one-stop services. Currently, the platform has covered 31 provinces and regions, realizing the full electronic processing of trade. China has introduced a series of trade facilitation policies, such as abolishing or lowering tariffs and simplifying import and export procedures. In March 2020, in order to cope with adverse shocks of the COVID-19 epidemic, the State Council executive meeting decided that import and export goods would be exempted from paying port construction fees between March 1st and June 30th. In addition, fees set by the government, such as cargo port fees and port facility security fees, would be reduced by 20 per cent. What is more, time required to go through customs is reduced. According to Chinese customs, in 2011, for China's imports and exports, the total customs clearance time was 48.5 and 6.5 hours, respectively. In June 2020, the customs clearance time for importing and exporting goods in China was 39.7 hours and 2.3 hours, respectively. Later, in June 2021, this time was reduced to 36.68 hours and 1.83 hours, respectively.
Based on the balance panel data of 2017-2021, this paper presents an evaluation by combining econometric estimations derived from a trade gravity model. The result of this study demonstrates that of a variety of trade facilitation measures, including simplifying import procedures, pre-ruling, automation, infrastructure construction, improving customs work efficiency, have indeed successfully boosted the imports and exports of the 5 RCEP states to China. The study's results also indicate a strong correlation (correlation coefficient of 1035.29) between trade facilitation and trade flow (import and export combined, measured in one billion US Dollars) between China and RCEP. An increase of one percent in China’s Trade Facilitation Index is expected to result in a rise of 10.3529 billion US Dollars in the RCEP-China trade value.
Another finding is that the growth in population of RCEP partner countries can also enhance trade flow with China. With every one million population increase, the trade volume of merchandise between China and RCEP member countries is expected to increase by 725 million US dollars. The GDP correlation coefficient is -0.32, implying that the GDP growth of RCEP members has an inverse inhibitory impact on the trade volume with China. The probable reason is that the increase in GDP boosts consuming, and thus expands domestic demand, therefore leads to the decrease in exported goods.
5.2 Conclusion and recommendations
Based on the balance panel data of 2017-2021, this paper presents an evaluation, an in-depth analysis, as well as econometric estimations derived from a trade gravity model. The main finding is that the trade facilitation has indeed increased trade. An increase of one percent in China’s Trade Facilitation Index is expected to result in a rise of 10.3529 billion US Dollars in the RCEP-China trade value. The other insight is that the population scale of RCEP countries has a positively impact on their trade volume with China, while economic scale of RCEP countries has a negative impact.
From a policy implication point of view, this article sheds light on some crucial aspects for both governments and companies.
1. Establishment of logistics industry alliance. Based on blockchain technology, international logistics industry alliance should be founded. Through data sharing by different related departments (both in government and commerce, both in importing countries and exporting countries), including logistics, country of origin, product information, warehouse, Inspection & Quarantine Information, and customs information, on the one hand, the operational efficiency of cross-border logistics can be improved since paper documents are replaced by electronic files that are fully recognized by all relevant departments of bilateral countries. On the other hand, blockchain helps to optimize cross-border logistics transport route and achieve full tracking of goods, so as to solve the problems of high logistics costs, long time-consuming, and cargo lost and damages, and so forth.
2. Bilateral digital single window. Accelerating the adoption of digital systems and establishing back-to-back, single-window digitized border crossings. By signing bilateral back-to-back, one-stop digital customs clearance with RCEP partner countries, digital measures have been adopted through processes to facilitate trade. For example, paperless initiatives have been implemented, such as the electronic cargo inspection system, the "intelligent sorting" system, electronic certificates of origin, e-commerce and e-payment systems. These measures will prevent the spread of infectious diseases. The Electronic Cargo Inspection System, an automated digital cargo examination system that provides accurate and reliable relevant information on traders, cargoes and vessels, can quickly and accurately examine all cargoes, determine the risk level, and provide "releasable" or "non-releasable" recommendations within seconds. The "Intelligent Audit + Photo & document Comparison" regulatory system, through computer intelligence and informatization, can automatically generate the inspection record in a few second. The "Intelligent Sorting" system can realize the automatic transmission of express shipments to the areas of inspection, warehouse and release.
3. Development of Cross-border E-commerce. In recent years, Cross-border E-commerce grow fast and has become a major style of international trade. It is an easy, economical and less risky way to tap an overseas market, therefore, government should take steps to cultivate Cross-border E-commerce.
4. Acceleration of blockchain technology. Customs of China and RCEP countries can make use of blockchain technology to exchange and share information, set up automated one-window customs clearance and supervision services, unify and accredit common documents, smoothing of customs clearance formalities, and compress the time for customs clearance of goods.
5.3 Limitations and future research
This study did not choose all RCEP partners as samples. This is because Australia has stopped trading with China. If this special case is counted, the whole test results would not be accurate. Furthermore, there are some RCEP members that are not in good and stable political relationship with China. Nevertheless, the impact of politics and culture on trade has not been fully discovered yet. This topic is too complex to be explained by this study at present. In future, scholars may try to carry out further research on the role of politics and culture on international trade.
[1] Wang, J., Wang, Q. (2021). A study on the trade potential and trade efficiency between China and RCEP partner countries: With measurement based on SFA model. Journal of Soochow University (Philosophy & Social Science Edition), 42(3): 111-123.
[2] Hillberry, R., Zurita-Castro, C. (2022). Commitment behaviour in the World Trade Organization trade facilitation agreement. The World Economy, 45(1): 36-75. https://doi.org/10.1111/twec.13165
[3] Wilson, J.S., Mann, C.L., Otsuki, T. (2003). Trade facilitation and economic development: A new approach to quantifying the impact. The World Bank Economic Review, 17(3): 367-389. https://doi.org/10.1093/wber/lhg027
[4] Beberelli, C., Ticku, R. (2022). Reducing tariff evasion: The role of trade facilitation. Journal of Comparative Economics, 50(2): 534-554. https://doi.org/10.1016/j.jce.2021.12.004
[5] Laboni, I.J., Khatun, M.F., Chowdhury, N.I., Anto, N.J., Rouf, O. (2023) Driving economic growth: How bangladesh can leverage the WTO trade facilitation agreement. http://doi.org/10.2139/ssrn.4468359
[6] Ge., H.H. (2023). Research on the development status and problems of China-ASEAN trade facilitation in the context of RCEP. Jiangsu Commercial Forum, 2023(3): 55-58. http://doi.org/10.3969/j.issn.1009-0061.2023.03.016
[7] Qi, W., Peng, X.Y., Xiong, H.Y. (2021). Impact of trade facilitation level of countries along the "the Belt and Road" on import and export trade. Statistics and Decision, 2021(32): 144-148. http://doi.org/10.13546/j.cnki.tjyjc.2021.08.032
[8] Moise, E., Sorescu, S. (2013). Trade facilitation indicators: The potential impact of trade facilitation on developing countries’ trade. OECD Trade Policy Paper, 2013: 1-7. https://doi.org/10.1787/5k4bw6kg6ws2-en
[9] Olubandwa, B.N. (2022). WTO trade facilitation adoption challenges in East African trade region during COVID-19 crisis. Open Access Library Journal, 9: 1-23. http://doi.org/10.4236/oalib.1109579.
[10] Nga, L., Huy, D., Hang, N., Lan, L., Thach, N. (2019). Reforming specialized inspection procedures to improve business environment in Vietnam for trade facilitation implementation. Management, 25(1): 234-258. https://doi.org/10.2478/manment-2019-0068
[11] Mao, Y.H., Qiu, X.Q., Wang, L. (2023). Trade facilitation of the belt and road and countries’ participation in global value chain. International Trade, 2023(1): 11-20.
[12] Yu, Y.M., Chen, T.W., Zhao, K. (2018). The development and countermeasures of Cross border E-commerce between China & RCEP: a study based on trade facilitation and single window of international trade. Inquiry into Economic Issues, 2018(4): 128-136.
[13] Cui, X.S., Guo, L.F., Li, F. (2019). Would trade tacilitation promote China's inter-provincial trade by trade creation?-Evidence from the survey on the Chinese trade facilitation. Economics of Finance and Trade, 40(4): 100-115.
[14] Zhi, H. (2020). Research on the impact of trade facilitation in countries along “Belt and Road” on China’s exports. Economic Review, 2020(06): 115-128. http://doi.org/10.16528/j.cnki.22-1054/f.202006115
[15] Zhan, J.L. (2023). The impact of RCEP on reducing the time of Cross-border cargo release. Journal of Beijing Institute of Technology (Social Sciences Edition), 25(3): 160-171. http://doi.org/10.15918/j.jbitss1009-3370.2023.3972
[16] Meng, Q.L., Wang, Y.H. (2022). Impact of trade facilitation on complexity of export technology in “the Belt and Road” countries. Journal of South-Central University for Nationalities (Humanities and Social Sciences), 42(12): 123-133. http://doi.org/10.19898/j.cnki.42-1704/C.2022.1214
[17] Yang, J.J., Liu, Y.F., Li, H.L. (2020). Trade facilitation, import of intermediate goods and enterprise export value added. Finance & Trade Economics, 2020(4): 115-129. http://doi.org/10.19795/j.cnki.cn11-1166/f.20200409.003
[18] Shi, Y.R., Yu, J.P., Bi, C.H. (2022). Trade facilitation and enterprise technology upgrading. International Economics and Trade Research, 38(7): 72-85.
[19] Ma, M.Y., Min, S., Zhang, X.H. (2023). The impact of trade facilitation on export quality of processed agricultural products-an empirical evidence of China and countries (regions) along “the Belt and Road” route. World Agriculture, 525(01): 30-43. http://doi.org/10.13856/j.cn11-1097/s.2023.01.003
[20] Yuan, K. (2022). Impact of trade facilitation on operation performance of Cross-border E-commerce in background of double-cycle -an empirical analysis based on provincial panel data. Journal of Commercial Economics, 2021(22): 89-92. http://doi.org/10.3969/j.issn.1002-5863.2021.22.022
[21] Sorescu, S., Bollig, C. (2022). Trade facilitation reforms worldwide: State of play in 2022, OECD Trade Policy Papers, No. 263, OECD Publishing, Paris, https://doi.org/10.1787/ce7af2ce-en
[22] Ismail, N.W. (2021). Digital trade facilitation and bilateral trade in selected Asian countries. Studies in Economics and Finance, 38(2): 257-271. https://doi.org/10.1108/SEF-10-2019-0406
[23] Liu, X. (2023). Impact of trade facilitation on the development of commerce and distribution enterprises in the context of the double cycle-Intermediation effects of investment in innovation. Journal of Commercial Economics, 2023(7): 133-136. https://doi.org/10.3969/j.issn.1002-5863.2023.07.034
[24] Duan, W.Q., Jing, G.Z., Qi, J.H. (2023). Trade facilitation and enterprise supply chain security—a perspective of diversification and localization. Journal of International Trade, 2023(4): 90-106. https://doi.org/10.13510/j.cnki.jit.2023.04.009
[25] Xiao, Y., Zhi, Y.P., Xie, T. (2020). The impact of trade facilitation on the export technological complexity of Chinese manufacturing enterprises in countries along the "Belt and Road" route. Macroeconomics, 2020(9): 164-175.
[26] Xie., Q., Liu, W.G., Zhang., P.Y. (2021). Embedded technology of import intermediate goods and enterprise productivity. Management World, 37(2): 66-80. https://doi.org/10.19744/j.cnki.11-1235/f.2021.0020
[27] Tinbergen, J. (1962). Shaping the World Economy; Suggestions for an International Economic Policy. Books (Jan Tinbergen). Twentieth Century Fund, New York.
[28] Li, C.P. (2021). Research on China's foreign trade efficiency under background of "Belt and Road"-based on empirical data from the 19 countries of the new Eurasian Land Bridge, Journal of Technical Economics & Management, 2021(2): 112-117.
[29] Yang, J., Qi, C.J. (2020). An empirical analysis on the trade potential of export to China from countries along the silk road economic belt-based on TPI and an expanded framework of stochastic frontier gravity model. Journal of International Trade, 2020(6): 127-142.