Ali Emad Jehad*![]() | Noor Jabbar Mahdi
| Noor Jabbar Mahdi![]() | Rania H. Shehab
| Rania H. Shehab![]() | Abdul-Rahim I. Al-Hadidy
| Abdul-Rahim I. Al-Hadidy![]()
© 2023 IIETA. This article is published by IIETA and is licensed under the CC BY 4.0 license (http://creativecommons.org/licenses/by/4.0/).
OPEN ACCESS
Traveling via public transportation is a better option than driving a private car and should be encouraged to reduce congestion, pollution, and fuel costs. However, due to COVID-19 pandemic, governments restrict the use of public transportation in order to limit infection spread. This study intends to identify travelers' attitudes and preferences for using public transportation during the COVID-19 epidemic using structural equation modeling (SEM). A questionnaire survey was created to analyze travelers' behavior, attitudes, perceived risk, and sense of responsibility when utilizing public transportation in Baghdad, Iraq. 234 complete responses were analyzed using the Structural Equation Modeling technique. The survey findings and measurement equations supported the relationship between observable and latent variables. The SEM results demonstrated that travelers' Perceived (PER) and Responsibility (RES) are favorably connected to Attitudes (ATT), whereas Behavior (BEH) towards public transportation is adversely related to Attitudes (ATT). To assess the confirmatory of measurement scale, confirmatory factor analysis (CFA) measurement was combined with nine Goodness-of-Fit measurements: Chi-square, Chi-square/df, RMR, GFI, AGFI, NFI, TLI, CFI, and RMSEA. This study highlights the findings of structural equation modeling research of using public transport through pandemic time in term of travel behaviors to improve the quality of service of public transport.
structural equation model, COVID-19, public transport, questionnaire, confirmatory factor analysis
During the COVID-19 pandemic, transportation has been the sector most severely impacted. Global spread of the COVID-19 virus leads WHO to declare a pandemic on March 11, 2020 [1]. This pandemic has changed the government’s policy in order to reduce the faster spread of the COVID-19. These policies included the implement curfews and safer-at-home orders which affected on all economic activity and increasing unemployment rates. So that, the public transport services and ridership are having significantly effort to keep physical distancing continued until the danger from COVID-19 is outcaste. All this reason reduction the mobility on the streets which decrease the traffic volume during the pandemic lockdown [2]. The World Health Organization (WHO) recommended that it should keep 1m between people and don’t touching the surface mainly in close areas to prevent virus transmission. Public transport identifies as a crowded space thus it is challenging to keep people within a social distance which makes public vehicles an excellent indoor environment for virus transmission. Using public transportation can increase the spread of viruses by a factor of up to six [3]. As a result, there was a worldwide drop in public transportation utilization during the COVID-19 pandemic [4]. In other wise, some people who are unable to drive, walk and cycle, public transport may be the best choice.
After a lot of cities reopen with hope to live without worry from virus, there is a pressing demand to take a quickly strategic to prevent completely lockdown. After the lockdown restrictions ease, the mobility shows a significant shift to private cars in cities after the experience of COVID-19 [5]. More private cars on the road would make cities to get a traffic jams which increased air and noise pollution, greenhouse gas emissions, obstruct walking and cycling, which make life difficult for people with lower-income who have not car [6]. Therefore, it should make some strategies as soon as possible for return the public transport system to transport sector under some restriction in order to confined transmission of virus.
The vehicle manufactures and the operators of public transport have a great effort to make space condition of public transport more safely by make door sensors, use hand sanitizer dispensers and redesign the internal seats for having physical barrier to reduce direct contact between the people [7]. Precautions, such as wearing face masks and maintaining the necessary physical distance, have been shown to reduce the risk of virus transmission [8]. It's worth noting that public transportation's physic social qualities-imposed limits on its use long before the COVID-19 [9]. Also, Aditjandra et al. [10] reported by development structural equations model that travel attitude characteristics and accessibility features of the urban area may change the use of public transport.
The researchers try to understand and predict travel modes and people behavior during and post the pandemic. Though there is research studying people's intentions to use public cars in general, under restrictions, and when infected with COVID-19, the focus on alternative transportation modes during the pandemic has been lacking [11]. The study by Dzisi and Dei [12] took a prominent route in Kumasi, where researchers observed and analyzed the habits of over 850 of the city's most popular paratransit buses. While Ministry of Transport criteria were used to assess passengers' adherence to the policy on physical separation, the researchers counted the number of passengers on each bus to establish whether or not the policy on face masks was being followed. The results show that most buses adhere to the social distance regulations established by the Ministry of Transportation; nevertheless, the policy on face masks is only partially adhered to in most vehicles. Only around 12.6% of the vehicles had less than three passengers without face masks, and only about 21.3% of the buses had fewer than three passengers with face masks. COVID transportation policy and practice responses were aided by the introduction of the new concept of Responsible Transport [13]. What makes this concept novel is that it takes into account not just environmental factors related to sustainability, but also the health and well-being of individuals and communities. More than that, it highlights the role of the person as an independent, responsible agent in achieving socially desirable transportation outcomes. COVID-19 transportation policy and practice responses were aided by the introduction of the new concept of Responsible Transport. What makes this concept novel is that it takes into account not just environmental factors related to sustainability, but also the health and well-being of individuals and communities. More than that, it highlights the role of the person as an independent, responsible agent in achieving socially desirable transportation outcomes. Abdulrazzaq et al. [14] devised a methodology for people to use in order to make the transition from driving alone to taking public transportation. According to the results, an individual's mode of transportation selection is heavily influenced by their trip distance, daily trip frequency, trip duration, gender, age, and occupation. During COVID-19, Javid et al. [15] looked at how people felt about taking public transit on their travels. Using a questionnaire, researchers in Lahore, Pakistan, investigated passengers' knowledge, sense of duty, and moral duties toward adhering to safety standards and norms when using public transportation. The results of the structural equation model showed a favorable relationship between passengers' awareness of consequences and their willingness to take responsibility for their actions. Passengers' willingness to use public transit is significantly affected by their perception of the difficulty of complying with safety rules, such as wearing a facemask, using sanitizers, and maintaining a social distance. Travelers' preferences for public transportation may be significantly influenced by their level of familiarity, sense of duty, and trust in its use during a pandemic. During the pandemic, Abdullah et al. [16] constructed a binary logistic model to represent travel behavior in terms of individual modes (i.e., private cars, taxis, etc.) and public modes. It has been found that women are more likely than men to ride in public transportation vehicles of a different mode.
A conceptual model according to earlier studies has been proposed in this study. The concept of public transport user model are behavior, attitude, perception, and responsibility. Theoretically, the process in this study can provide a reference by employing model users’ intentions to use public transport while adhering to the safety instructions during the COVID-19 pandemic in Iraq.
2.1 Survey design and sampling strategy
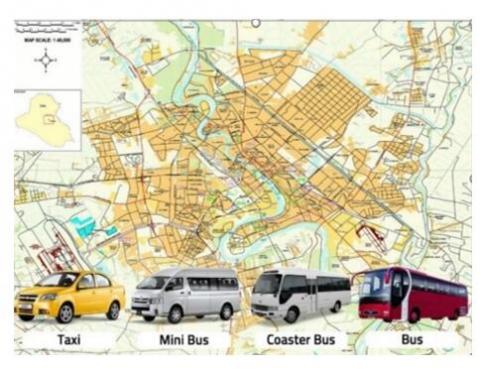
Figure 1. Type of public transport vehicles used in Baghdad city
As was mentioned earlier, one of the objectives of the paper was to investigate the incidence of citizen mobility within the spread of COVID-19 pandemic. As a result, the questionnaire was meticulously prepared in order to measure the travel pattern both during and after the COVID-19 pandemic. In order to acquire replies that could be relied upon, the respondents were given information regarding the aims of the study as well as instructions for filling out the questionnaire. The questionnaire underwent preliminary testing by specialists who belonged to the relevant study area. The comments made by these specialists were incorporated into the questionnaire in order to guarantee that each statement was clear and understandable to the respondents. Due to the social distance restrictions and the partial lockdown that was taking place in the country, it was not possible to conduct face-to-face interviews. The Likert-scale questions were introduced in the survey as a risk mitigation strategy: in case the answers to the open-ended questions were not really suited to the research goal, the responses to the rating questions could be used to inform reasonable perspective survey toward using public transport in pandemic incident. As such, the Likert questions offered a way to reduce possible loss of expert input. As such, Google form, emails, online websites, and social media messages were offered to the respondents. As a result, an online questionnaire was delivered to the target audience through personal connections, emails, and social media websites. Baghdad metropolis, which is the most populous of the provinces in Iraq, possesses socio-economic characteristics that are unique in comparison to those of other cities. The poll was conducted over the course of approximately one and a half months, beginning on April 17th, 2022 and ending on June 20th, 2022. During this time span, we were given a total of four hundred (400) responses. Figure 1 shows the type of public transport vehicles used in Baghdad city.
2.2 Questionnaire design
Both before and during the COVID-19 pandemic, respondents were asked about their travel patterns and the factors that influenced their mode preferences. The questionnaire was divided into two independent sections: (1) socio-economic and demographic characteristics, and (2) travel patterns. In Table 1, the socioeconomic and demographic parameters that were examined were as follows: age, gender, location, education level, number of family members, monthly cost of travel, ownership of a cycle, ownership of a motorbike, ownership of a car, and employment status. There were questions in Section 2 concerning the mode of transportation that is most preferred for the purpose of traveling, as well as the primary reason that people do not prefer to use public transportation for the purpose of traveling, both before and during the COVID-19 pandemic, as listed in Table 2. In addition to this, it included questions regarding potential factors that could impact mode preferences both before and during the COVID-19 epidemic. It is hypothesized that people will pay more attention to pandemic-related items when choosing a transport mode because the virus spreads primarily through close contact with infected people or by getting in contact with an infected surface. Since this is the case, the hypothesis predicts that people will pay more attention to pandemic-related items. For instance, comfort and convenience might not be as important as preventing the spread of virus and keeping a healthy social distance during the pandemic. Therefore, elements that may affect mode choice during the pandemic have been identified, and respondents have been asked to place a priority on each factor while selecting a mode of transportation.
2.3 Proposed structural equation model framework
Because there is an immediate demand for information regarding the effects that COVID-19 has had on society, the primary findings of the data collection will be discussed in this paper in a manner that is mostly descriptive. The consequences on experiences, behavior, and expectations are broken down by background variables, such as age and area, wherever it is relevant to do so. In addition, this investigation makes use of the Statistical Package for Social Science (SPSS) for Windows version 26, which is available for purchase commercially. The statistics that were descriptive were given in terms of the number of replies.
Table 1. Socio-economic and demographic characteristics of the respondents
|
Category |
Attribute |
Percentage % |
|
Gender |
Male |
57 |
|
Female |
43 |
|
|
Ethnic |
Baghdad |
41 |
|
Other |
59 |
|
|
Age |
18-25 Years |
68 |
|
26-35 Years |
24 |
|
|
36-45 Years |
5 |
|
|
>45 Years |
2 |
|
|
Level of Education |
High School |
26 |
|
Bachelor’s degree |
58 |
|
|
Post-graduate degree |
16 |
|
|
Employment |
student |
67 |
|
public sector |
19 |
|
|
private sector |
8 |
|
|
Self-employment |
6 |
|
|
Household Size |
1-3 person |
14 |
|
4-6 person |
37 |
|
|
more than 6 persons |
49 |
|
|
Moving purpose in Baghdad city |
Work |
21 |
|
Study |
24 |
|
|
Other |
55 |
|
|
Means of transportation |
private car |
48 |
|
public car |
28 |
|
|
other |
24 |
|
|
Working time |
Full time |
37 |
|
Part time |
31 |
|
|
Other |
32 |
|
|
Working Days per Week |
<3 Days |
40 |
|
4 Days |
28 |
|
|
5 Days |
17 |
|
|
6 Days |
15 |
|
|
Required time reach to workplace |
<10 minutes |
14 |
|
10-15 minute |
18 |
|
|
15-30 minute |
11 |
|
|
>30 minutes |
46 |
|
|
Cost required to reach to workplace |
100 000 Dinar |
53 |
|
100000-20000 Dinar |
23 |
|
|
more than 200000 Dinar |
24 |
|
|
Why use the private vehicle |
comfortable |
67 |
|
Safe |
22 |
|
|
Outward appearance |
11 |
|
|
Factor that prevents you from using public vehicle |
uncomfortable |
27 |
|
Traffic jam |
11 |
|
|
have a long time to reach for destination address |
33 |
|
|
poor public car service |
29 |
Table 2. Descriptive statistics of items for all dimensions
|
Item Code |
Statement |
Five-Point Likert Scale |
||||
|
1*(%) |
2*(%) |
3*(%) |
4*(%) |
5*(%) |
||
|
Travel Behaviors for Public Transport |
||||||
|
Beh1 |
How often would you use public transport? |
7 (3.0) |
37 (15.8) |
124 (53.0) |
47 (20.1) |
19 (8.1) |
|
Beh2 |
Have you taken public transportation during the COVID-19 Pandemic? |
2 (0.9) |
10 (4.3) |
64 (27.4) |
98 (41.9) |
60 (25.6) |
|
Beh3 |
Public transport takes longer time than my private vehicle. |
95 (40.6) |
110 (47.0) |
23 (9.8) |
6 (2.6) |
0 (0) |
|
Attitudes Towards Private Vehicles |
||||||
|
Att1 |
External appearance of the car is a major reason for using my own car. |
9 (3.8) |
82 (35.0) |
64 (27.4) |
74 (31.6) |
5 (2.1) |
|
Att2 |
Safety factor is one of the important reasons to use my own car. |
63 (26.9) |
112 (47.9) |
39 (16.7) |
20 (8.5) |
0 (0) |
|
Att3 |
Comfort factor is one of the important reasons to use my own car. |
110 (47.0) |
102 (43.6) |
20 (8.5) |
2 (0.9) |
0 (0) |
|
Att4 |
My own car is convenient and reliable to ride than public transport. |
37 (15.8) |
94 (40.2) |
93 (39.7) |
9 (3.8) |
1 (0.4) |
|
Perceived Behavioral of Public Transport |
||||||
|
Per1 |
Public transport vehicles provide insufficient services during rides. |
62 (26.5) |
98 (41.9) |
46 (19.7) |
26 (11.1) |
2 (0.9) |
|
Per2 |
Public transport vehicles provide discomfort services during rides. |
66 (28.2) |
74 (31.6) |
49 (20.9) |
45 (19.2) |
0 (0) |
|
Per3 |
Traffic congestion is the main reason for not taking public transport vehicles. |
92 (39.3) |
92 (39.3) |
33 (14.1) |
16 (6.8) |
1 (0.4) |
|
Per4 |
Public transport vehicles considered inconvenient route for me. |
69 (29.5) |
116 (49.6) |
41 (17.5) |
8 (3.4) |
0 (0) |
|
Responsibility Towards Public Transport |
||||||
|
Res1 |
Public transportation considers safety measurement during COVID-19. |
25 (10.7) |
14 (6.0) |
75 (32.1) |
58 (24.8) |
62 (26.5) |
|
Res2 |
How often would you use public transport considering the COVID-19 situation? |
91 (38.9) |
29 (12.4) |
46 (19.7) |
61 (26.1) |
7 (3.0) |
|
Res3 |
Do you keep social distancing when traveling in public transport during COVID-19? |
60 (25.6) |
86 (36.8) |
51 (21.8) |
18 (7.7) |
19 (8.1) |
|
Res4 |
Do you wear face mask when you are in public transportation during COVID-19? |
77 (32.9) |
59 (25.2) |
82 (35.0) |
9 (3.8) |
7 (3.0) |
|
Res5 |
Do you use hand sanitizer when you are in public transportation during COVID-19? |
63 (26.9) |
61 (26.1) |
55 (23.5) |
22 (9.4) |
33 (14.1) |
|
Res6 |
Do you take public transport when you have contacted with COVID-19 infected person? |
2 (0.9) |
2 (0.9) |
2 (0.9) |
74 (31.6) |
154 (65.8) |
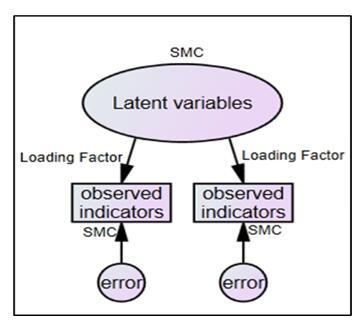
A theoretical framework is required to investigate the causal relationship between the aspects of Public Transport that affects travel behavior, Attitudes, Perceived, and Responsibility toward public transport. Figure 2 shows the structural equation modelling structure as Squared Multiple Correlations (SMC).
SEM research design can provide standards and roadmap for the statistical examination of the relationships between several variables [17]. The SEM analytical framework, as shown in Figure 3, is used to interpret and communicate study results.
Figure 2. The structural equation modeling (SEM) structure
Figure 3. Structural equation model research process [17]
3.1 Reliability and validity measurements for SEM model
In order to determine the reliability of the dimensions and to examine the variables' degree of internal consistency, the Cronbach's alpha test was carried out. The fact that the Cronbach's alpha value for the Responsibility variables is less than 0.500 makes it unacceptable as a measure of reliability [18, 19]. The value was found to be 0.584. The item code Res1 was removed so that we could go within the range of the Cronbach's alpha test that is considered acceptable. After one item was removed, the values of all the variables and items that make up Cronbach's alpha lie between 0.623 and 0.692, as shown in Table 3. Following the completion of the reliability test, a multitude of additional tests can be carried out to validate the suitability of the factor analysis (FA) of the data sets. Kaiser-Meyer-Olkin (KMO) is a test that determines whether or not there was sufficient sampling, and factor loading identification and Bartlett's test of sphericity are tests that are used in the process of analyzing the dependability of each factor on its own. The Kaiser-Meyer-Olkin (KMO) measure and Bartlett's test of sphericity were applied to the findings of the pilot study, and the results of both of these tests are shown in Table 4. This allowed for each of the 17 items on the questionnaire to be validated. The KMO measure of sample adequacy was found to be 0.688, which ensures the occurrence of significant partial correlations across the entire investigation. The requirement that the measure of sampling adequacy be more than 0.50 is a prerequisite for the criterion that was proposed by Hair et al. [20] to be evaluated to validate the existence of correlation.
Table 3. Reliability test results for pilot survey before and after items deleted
|
Variables (Scales) |
Item Code |
Mean Score |
St. Dev. |
Cronbach’s Alpha* |
Cronbach's Alpha if Item Deleted |
|
Travel Behaviour for Public Transport |
Beh1 |
3.58 |
1.315 |
0.623 |
0.492 |
|
Beh2 |
3.89 |
1.148 |
0.060 |
||
|
Beh3 |
4.26 |
0.737 |
0.761 |
||
|
Attitudes Towards Private Vehicles |
Att1 |
3.05 |
1.415 |
0.692 |
0.425 |
|
Att2 |
3.08 |
1.347 |
0.495 |
||
|
Att3 |
3.06 |
1.421 |
0.402 |
||
|
Att4 |
2.82 |
1.408 |
0.930 |
||
|
Perceived Behavioral of Public Transport |
Per1 |
3.82 |
0.979 |
0.687 |
0.551 |
|
Per2 |
4.05 |
0.779 |
0.646 |
||
|
Per3 |
4.10 |
0.916 |
0.675 |
||
|
Per4 |
3.69 |
1.081 |
0.598 |
||
|
Responsibility Towards Public Transport |
Res1 |
2.50 |
1.244 |
0.484* |
0.542* |
|
Res2 |
2.13 |
0.874 |
0.461 |
||
|
Res3 |
3.64 |
1.179 |
0.358 |
||
|
Res4 |
3.81 |
1.035 |
0.408 |
||
|
Res5 |
3.42 |
1.351 |
0.333 |
||
|
Res6 |
1.39 |
0.641 |
0.479 |
Table 4. KMO and bartlett's test for pilot study
|
Kaiser-Meyer-Olkin Measure of Sampling Adequacy |
0.688 |
|
|
Bartlett's Test of Sphericity |
Approx. Chi-Square |
450.099 |
|
Degree of Freedom |
45 |
|
|
Significant |
0.00 |
3.2 CFA measurement model
In order to validate the results of the measurement scale test, a confirmatory factor analysis (CFA) was carried out. During the course of the investigation, a total of 234 valid samples were found. In the context of the CFA, dimensions are referred to as latent constructs, whilst attributes are referred to as reflective indicators. In order to evaluate the measurement model, we looked at how well it suited the data overall, as depicted in Figure 4. In this analysis, nine goodness-of-fit indices derived from SEM-based research and the SEM references [20-22] were taken into consideration. In order to validate the results of the measurement scale test, a confirmatory factor analysis (CFA) was carried out. During the course of the investigation, a total of 234 valid samples were found. In the context of the CFA, dimensions are referred to as latent constructs, whilst attributes are referred to as reflective indicators. In order to evaluate the measurement model, we looked at how well it suited the data overall, as depicted in Figure 3. In this analysis, nine goodness-of-fit indices derived from SEM-based research and the SEM references [20-22] were taken into consideration. These indices are listed as follows:
Figure 4. Structural equation model research process [17]
According to Figure 3, values that are more than 0.600 reflect the leading factors, providing evidence of convergent validity. Figures with an R2 greater than 0.600 were found to be common for all indicators, which shows that definitive dependability has been reached. On the basis of the results of AMOS 24.0, this model is an adequate match because its indices have satisfied the requirements of a model fit, as indicated in Table 5.
Table 5. Fit indices for study SEM
|
Measure |
Indices |
Threshold Value [References] |
|
Chi-square value |
|
|
|
df |
99 |
|
|
P-value |
0.000 |
|
|
Chi-square |
311.887 |
P<0.05 [23] |
|
Chi-square/df |
3.15 |
Between 1.00 and 5.00 [23] |
|
Goodness of Fit Index |
||
|
RMR |
0.117 |
Close to 0 the better [24] |
|
GFI |
0.859 |
0.800 and above [24] |
|
AGFI |
0.807 |
0.800 and above [25] |
|
Baseline Comparisons |
||
|
NFI |
0.527 |
0.800 and above [26] |
|
TLI |
0.426 |
0.900 and above [27] |
|
CFI |
0.605 |
0.900 and above [24] |
|
RMSEA |
0.069 |
Between 0.03 and 0.08 [20] |
According to Table 5, CFA was used to estimate the convergent and discriminant validities by using the AMOS 24.0 software. The overall goodness-of-fit indexes of the Confirmatory Factor Analysis (CFA) measurement model suggest a satisfactory fit. All measurements in Table 5 confirm that the structural model adequately fits the data, according to references [20, 23, 26, 27]. However, Baseline Comparisons refers to the models automatically fitted by Amos for every analysis which is not adequate due to not reaching thresholds.
Full descriptive analysis was done to all variables of the questionnaire after extensive data screening to respondents' answers to the questionnaire to fully understand the respondents' perspective for travel aspects for public transport in Baghdad city. Demographic analysis was discussed which shows that the respondents are 57% male and 43% female which represent a perfect combination of gender bias in this study. Public transport users from 18-25 years old were the major influence of the result of this study with 68% of all respondents. Further descriptive analyses for all variables were preformed to understand the respondents' perspective toward satisfaction, comfort, and reliability of public transport.
The generation and formation of theoretical based model of structural equation model as the study examined for the first time the effect of causal determinants of travel aspect for public transport in Baghdad city with regards to Travel Behaviors for Public Transport, Attitudes Towards Private Vehicles Perceived Behavioral of Public Transport, and Responsibility Towards Public Transport. CFA measurement was used with nine Goodness-of-Fit measurement to test the confirmatory of measurement scale: Chi-square, Chi-square/df, RMR, GFI, AGFI, NFI, TLI, CFI, and RMSEA. Most these measurements shown an acceptable threshold value when model was tested. AVE and C.R measurement for reliability and validity of model have also shown acceptable values which indicate that all determinants of SEM model have significant and positive causal relationship with factors.
|
AGFI |
Adjusted Goodness-Of-Fit index |
|
ATT |
Attitudes |
|
BEH |
Behavior |
|
CFA |
Confirmatory Factor Analysis |
|
CFI |
Comparative Fit Index |
|
COVID |
Coronavirus Disease |
|
FA |
Factor Analysis |
|
GFI |
Goodness-Of-Fit index |
|
KMO |
Kaiser-Meyer-Olkin |
|
NFI |
Normed Fit Index |
|
PER |
Perceived |
|
RES |
Responsibility |
|
RMSEA |
Root Mean Square Error of Approximation |
|
RMSR |
Root Mean Square Residual |
|
SEM |
Structural Equation Modeling |
|
SMC |
Squared Multiple Correlations |
|
SPSS |
Statistical Package for Social Science |
|
TLI |
Tucker-Lewis Index |
|
WHO |
World Health Organization |
[1] WHO. (2021). https://covid19.who.int/region/emro/country/pk, accessed on May 29, 2021.
[2] De Vos, J. (2020). The effect of COVID-19 and subsequent social distancing on travel behavior. Transportation Research Interdisciplinary Perspectives, 5: 100121. https://doi.org/10.1016/j.trip.2020.100121
[3] Nuki, P., Newey, S. (2021). How to avoid the spread of coronavirus when travelling on public transport. https://www.telegraph.co.uk/global-health/science-and-disease/coronavirus-public-transport-how-avoid-catch-travelling-advice-tubes, accessed on April 9, 2021.
[4] Glazener, A., Wylie, J., van Waas, W., Khreis, H. (2022). The impacts of car-free days and events on the environment and human health. Current Environmental Health Reports, 9(2): 165-182. https://doi.org/10.1007/s40572-022-00342-y
[5] Raj, A.A., Velraj, R., Haghighat, F. (2020). The contribution of dry indoor built environment on the spread of coronavirus: Data from various indian states. Sustainable Cities and Society, 62: 102371. https://doi.org/10.1016/j.scs.2020.102371
[6] Friman, M., Lättman, K., Olsson, L.E. (2020). Public transport quality, safety, and perceived accessibility. Sustainability, 12(9): 3563. https://doi.org/10.3390/su12093563
[7] Paton, G., Times. (2020). Contactless doors and visors are the future for rail. The Times. https://www.thetimes.co.uk/article/coronavirus-contactlessdoors-and-visors-are-the-future-for-rail-qgsnd6p08, accessed on June 3, 2020.
[8] Ngonghala, C.N., Iboi, E., Eikenberry, S., Scotch, M., MacIntyre, C.R., Bonds, M.H., Gumel, A.B. (2020). Mathematical assessment of the impact of non-pharmaceutical interventions on curtailing the 2019 novel coronavirus. Mathematical Biosciences, 325: 108364. https://doi.org/10.1016/j.mbs.2020.108364
[9] Al-Rashid, M.A., Goh, H.C., Harumain, Y.A.S., Ali, Z., Campisi, T., Mahmood, T. (2021). Psychosocial barriers of public transport use and social exclusion among older adults: Empirical evidence from Lahore, Pakistan. International Journal of Environmental Research and Public Health, 18(1): 185. doi:10.3390/ijerph18010185
[10] Aditjandra, P.T., Cao, X.Y., Mulley, C. (2016). Exploring changes in public transport use and walking following residential relocation: A british case study. Journal of Transport and Land Use, 9(3): 77-95. https://doi.org/10.5198/jtlu.2015.588
[11] Abdullah, M., Ali, N., Hussain, S.A., Aslam, A.B., Javid, M.A. (2021). Measuring changes in travel behavior pattern due to COVID-19 in a developing country: A case study of Pakistan. Transport Policy, 108: 21-33. https://doi.org/10.1016/j.tranpol.2021.04.023
[12] Dzisi, E.K.J., Dei, O.A. (2020). Adherence to social distancing and wearing of masks within public transportation during the COVID 19 pandemic. Transportation Research Interdisciplinary Perspectives, 7: 100191. https://doi.org/10.1016/j.trip.2020.100191
[13] Budd, L., Ison, S. (2020). Responsible transport: A post-covid agenda for transport policy and practice. Transportation Research Interdisciplinary Perspectives, 6: 100151. https://doi.org/10.1016/j.trip.2020.100151
[14] Abdulrazzaq, L.R., Abdulkareem, M.N., Yazid, M.R.M., Borhan, M.N., Mahdi, M.S. (2020). Traffic congestion: Shift from private car to public transportation. Civil Engineering Journal, 6(8): 1547-1554. https://doi.org/10.28991/cej-2020-03091566
[15] Javid, M.A., Abdullah, M., Ali, N., Dias, C. (2021). Structural equation modeling of public transport use with COVID-19 precautions: An extension of the norm activation model. Transportation Research Interdisciplinary Perspectives, 12: 100474. https://doi.org/10.1016/j.trip.2021.100474
[16] Abdullah, M., Ali, N., Javid, M.A., Dias, C., Campisi, T. (2021). Public transport versus solo travel mode choices during the COVID-19 pandemic: Self-reported evidence from a developing country. Transportation Engineering, 5: 100078. https://doi.org/10.1016/j.treng.2021.100078
[17] Salkind, N.J. (2010). Encyclopedia of research design. Sage, 1.
[18] Bernardi, R.A. (1994). Validating research results when Cronbach's alpha is below. 70: A methodological procedure. Educational and Psychological Measurement, 54(3): 766-775. https://doi.org/10.1177/0013164494054003023
[19] Nunnally, J.C., Bernstein, I.H. (1994). Psychometric Theory. McGraw-Hill Series. Psychology, 3.
[20] Hair, J.F., Anderson, R.E., Tatham, R.L., Black, W.C., Babin, B.J., Anderson, R.E. (2009). Multivariate Data Analysis: Pearson Education Ltd.
[21] Moriya, S., Notani, K., Murata, A., Inoue, N., Miura, H. (2014). Analysis of moment structures for assessing relationships among perceived chewing ability, dentition status, muscle strength, and balance in community‐dwelling older adults. Gerodontology, 31(4): 281-287. https://doi.org/10.1111/ger.12036
[22] Field, A. (2013). Discovering Statistics Using IBM SPSS Statistics. London: Sage Publications, Ltd.
[23] Fornell, C., Larcker, D.F. (1981). Evaluating structural equation models with unobservable variables and measurement error. Journal of Marketing Research, 18(1): 39-50. https://doi.org/10.2307/3151312
[24] Bentler, P.M. (1990). Comparative fit indexes in structural models. Psychological Bulletin, 107(2): 238. https://doi.org/10.1037/0033-2909.107.2.238
[25] Holmes-Smith, P., Coote, L., Cunningham, E. (2006). Structural equation modelling: From the fundamentals to advanced topics. Melbourne: Sreams. Melbourne. https://doi.org/10.1016/j.drudis.2013.01.007
[26] Byrne, B. M. (2016). Structural Equation Modeling with AMOS. New York: Routledge. https://doi.org/10.4324/9781410600219
[27] Tucker, L.R., Lewis, C. (1973). A reliability coefficient for maximum likelihood factor analysis. Psychometrika, 38(1): 1-10. https://doi.org/10.1007/BF02291170