Roberta Rincione![]() | Sonia Longo
| Sonia Longo![]() | Maurizio Cellura*
| Maurizio Cellura*![]() | Francesco Guarino
| Francesco Guarino![]() | Alberto Brunetti
| Alberto Brunetti![]()
© 2023 IIETA. This article is published by IIETA and is licensed under the CC BY 4.0 license (http://creativecommons.org/licenses/by/4.0/).
OPEN ACCESS
The paper describes the results of a Life Cycle Assessment study of wood chips obtained from a residual forest biomass, to be used for energy purpose. The analysis is referred to 1 kg of wood chips as functional unit. The system boundaries include the collection of the residual biomass, the chipping process of biomass, the collection and transport of wood chips to the energy plant. The results show that the supply chain examined, with reference to the functional unit, causes an impact of 0.027 kg CO2eq and a consumption of 0.406 MJ of primary energy. A dominance analysis was developed to identify the most impactful stages of the production chain: the steps that contribute most to the impacts within the supply chain are the indirect drag and the chipping process, responsible for the 42% of the overall greenhouse gas emissions and primary energy consumption. Lastly, a sensitivity analysis was carried out, to assess the variation of the impacts related to the distance between the wood chips production site and the place of use. The sensitivity analysis shows that is important to have short supply chains within the proposed domain in order to lower the energy and environmental impacts.
Greenhouse gas emissions, Life Cycle Assessment, primary energy, residual biomass, wood chips
Providing clean, cheap and safe energy and reaching a low-carbon circular economy are key aspects for achieving the European goals of a net zero greenhouse gas emissions economy and the decoupling of the economic growth from resource use and waste generation [1].
Renewable energy sources (RES) have been recognized as one of the most efficient and effective solutions for fulfilling these goals [2].
Among the available RES, biomass as a source of energy for the generation of electrical power can play a key role [3], especially in countries and regions with ease of access to biomass resources. It can be a reliable solution both to replace fossil fuels and to contribute to a circular economy (particularly when the biomass used for energy purposes is of residual type). Thus, bioenergy can help enabling the decoupling of energy production from primary resources exploitation [4]. Generally, bioenergy supply chains include the steps of production (growing), harvesting, pretreatment to facilitate transportation, and energy conversion. The above steps generally take place in different locations. Biomass production, harvesting and pretreatment take place in the forest or at the agricultural or agro-industrial facility. Then, the pretreated biomass is transported to the energy conversion plant.
In order to assess the energy and environmental sustainability of using biomass resource for energy purposes, it is important to carry out Life Cycle Assessment (LCA) studies that allow for the identification of the impacts embedded in the supply chain of biomass transformation from waste to energy resource. The comprehensiveness makes LCA a particularly effective mechanism for quantifying different environmental impacts originating from the product’s life cycle including indirect impacts [5].
In this context, the objective of the study is to assess the energy and environmental impacts associated with the production of wood chips from residual biomass of forest origin, to be used as a fuel.
The study was developed within the PRIN BIO-CHEAPER (Biomasses Circular Holistic Economy Approach to Energy equipment) project.
The LCA consists of four steps, briefly described in the following [6, 7]:
- Goal and scope definition, that includes a description of the intended use of the study and of the product system in terms of system boundaries, functional unit, allocation procedures, impact categories selected and methodology of impact assessment, etc.;
- Life Cycle Inventory (LCI) analysis, that involves data collection and calculation procedures to quantify the resources consumption, the air, water and soil emissions, and the waste production;
- Life Cycle Impact Assessment (LCIA), that is aimed at evaluating the significance of potential environmental impacts using the LCI result;
- Life cycle interpretation, which is the final step of the LCA procedure, in which the results of a LCI and/or a LCIA are summarized and discussed as a basis for conclusions, recommendations and decision-making in accordance with the goal and scope definition.
2.1 Goal and scope of study
The study analyzes the process chain of residual biomass of forest origin, to be used for energy valorization. It aims to analyze, according to the life-cycle approach, the energy and environmental impacts related to the production of wood chips from the residual biomass.
Wood chips are obtained from a treatment process of forest residues, called chipping, in which the residues are reduced to flakes generating a homogeneous material with a higher density than the residue as is, allowing for easier transport, handling and increased payload of the transport vehicle.
The function of the product system analyzed is the production of wood chips, so the selected functional unit (quantified performance of a product system for use as a reference unit) is 1 kg of wood chips. The system boundaries (unit processes that are part of a product system) are chosen with a "from cradle to gate" approach. They include the stages of residual biomass harvesting (indirect and direct drag), biomass chipping, collection and transport of the wood chips to the energy valorization plant.
The life cycle of all inputs used in the different stages of the production chain are included in the analysis (e.g., diesel used by the tractor for harvesting). The life cycle of the machinery used in the various process units is not included in the study because, considering a useful life of the machinery of more than 10 years, its contribution to the total impacts of the functional unit can be considered negligible. In addition, since residual biomass can be considered as a waste, the “zero burden” principle is applied.
The impact categories selected for the calculation of the energy and environmental performance are shown in the Table 1.
Table 1. The impact categories selected
|
Index |
UM |
Acronym |
|
Climate change |
kg CO2eq |
CC |
|
Ozone depletion |
kg CFC-11eq |
ODP |
|
Human toxicity, non-cancer effects |
CTUh |
HTnce |
|
Human toxicity, cancer effects |
CTUh |
HTce |
|
Particulate matter |
kg PM2.5eq |
PM |
|
Ionizing radiation HH |
kBq U235eq |
IR |
|
Ionizing radiation E (interim) |
CTUe |
IRE |
|
Photochemical ozone formation |
kg NMVOCeq |
POCP |
|
Acidification |
molc H+eq |
AP |
|
Terrestrial eutrophication |
molc Neq |
EPT |
|
Freshwater eutrophication |
kg Peq |
EPF |
|
Marine eutrophication |
kg Neq |
EPM |
|
Freshwater ecotoxicity |
CTUe |
FE |
|
Land use |
kg C deficit |
LU |
|
Water resource depletion |
m3 watereq |
WU |
|
Mineral, fossil & ren resource depletion |
kg Sbeq |
ADPm&m |
|
Non renewable energy consumption |
MJ |
PEnr |
|
Renewable energy consumption |
MJ |
PEr |
|
Total energy consumption |
MJ |
PEt |
Primary energy consumption is estimated by applying the Cumulative Energy Demand (CED) method, which allows for estimating the consumption of direct and indirect primary energy sources (both renewable and non-renewable) of a product system during the entire life cycle [8]. The environmental impacts are calculated by using the ILCD 2011 Midpoint method [9, 10].
Secondary data, that are average data representing the life cycle of each input, are modeled by using datasets found in the ecoinvent database [11]. Ecoinvent is a database used to assess the life cycle environmental impacts of products and services. It is an archive covering a wide range of sectors globally and regionally [12]. In detail, data related to the Italian context were used.
2.2 Life Cycle Inventory analysis
The LCI analysis involves the data collection and processing for each unit process of the wood chips supply chain.
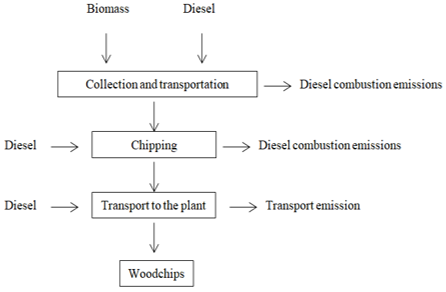
Figure 1 shows the qualitative flow chart of the examined unit processes.
Figure 1. Flow chart
2.2.1 Biomass collection
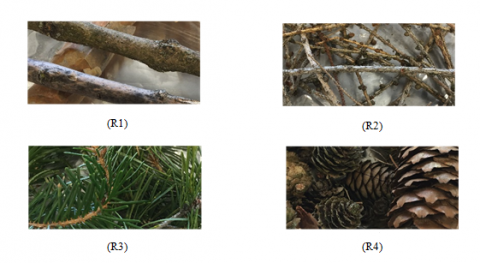
Harvested biomass belongs to the residual type of forest origin, consisting of necromass, that is the dead and decomposing portion of a tree. The biomasses that belong to the residual type of forest origin are (Figure 2):
- R1. Hard or brittle branches with diameters greater than 5 mm;
- R2. Flexible branches with diameters less than 5 mm;
- R3. Needles, i.e., the green leaves of the branch;
- R4. Pine cones of various sizes.
Biomass samples were analyzed in order to identify their elemental composition, moisture content and heating value (Table 2).
Figure 2. Types of biomass used
Table 2. Characteristics of biomass used
|
|
Residue Type |
|||
|
|
R1 |
R2 |
R3 |
R4 |
|
C1 (%) |
56.95 ± 0.25 |
66.10 ± 0.35 |
52.36 ± 0.56 |
57.70 ± 0.47 |
|
H2 (%) |
5.88 ± 0.08 |
5.55 ± 0.24 |
6.85 ± 0.08 |
5.96 ± 0.16 |
|
N3 (%) |
0.40 ± 0.03 |
0.89 ± 0.09 |
1.36 ± 0.06 |
1.26 ± 0.08 |
|
S4 (%) |
0.14 ± 0.01 |
0.16 ± 0.02 |
0.30 ± 0.04 |
0.49 ± 0.05 |
|
O5 (%) |
33.44 ± 0.32 |
24.79 ± 0.51 |
37.39 ± 0.65 |
33.66 ± 0.50 |
|
M6 (%) |
11.51 ± 0.85 |
21.02 ± 1.60 |
46.07 ± 0.86 |
10.72 ± 2.53 |
|
Ash (%) |
3.19 ± 1.34 |
2.51 ± 0.07 |
1.74 ± 0.23 |
0.93 ± 0.27 |
|
H7 (MJ/kg) |
19.76 ± 0.21 |
20.46 ± 0.04 |
21.14 ± 0.20 |
20.81 ± 0.09 |
|
1Carbon; 2Hydrogen; 3Nitrogen; 4Sulfur; 5Oxygen; 6Moisture; 7Higher heating value. |
||||
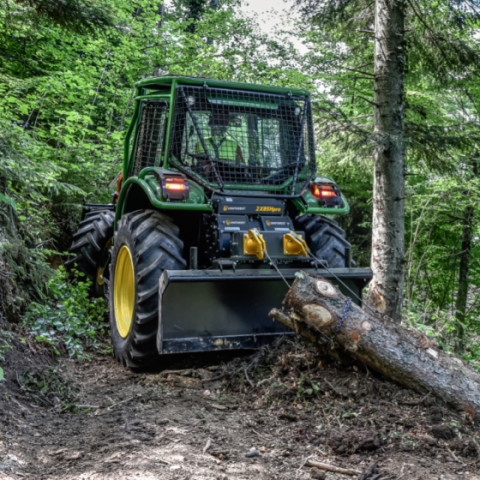
Residual biomass of forest origin is collected in the forest using a tractor and a winch (a machine used in forestry sites to move plant masses placed in positions that cannot be reached by self-propelled vehicles) (Figure 3).
Figure 3. Forestry tractor with a winch
The methods of collection and drag are:
- Indirect drag: the tractor remains stationary and the wood collection is carried out by means of the winch;
- Direct drag: an activity in which the load (biomass) moves together with the towing vehicle (tractor and winch).
With reference to the indirect drag of the residual biomass (use of the tractor equipped with a winch), a productivity of 1.35 t/h was calculated for the tractor equipped with a forestry winch [13], while and an average consumption of 4.6 l/h of diesel as fuel was estimated [14] (Table 3).
In order to examine the movement of the biomass to the storage site (direct drag), an average drag distance of 1 km was assumed [15].
Table 3. Data on drag with tractor and winch
|
Data |
Value |
|
Average skidding productivity with winch [t/h] |
1.35 |
|
Average fuel consumption [l/h] |
4.60 |
|
Average distance from forest to temporary storage [km] |
1.00 |
With reference to the secondary data, the life cycle of the diesel used in the process (lower calorific value of 44.4 MJ/kg), including the emissions generated by the harvesting process with tractor and winch, was modeled by using the dataset “Diesel, burned in building machine processing”. The direct drag of the residual biomass from the collection site to the temporary storage was modeled using the dataset “Transport, tractor and trailer, agricultural processing” [11].
2.2.2 Chipping
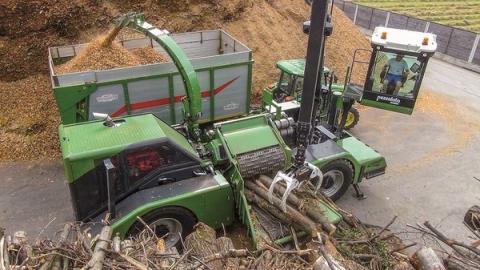
The chipping process is carried out with a semi-industrial chipper, which has an average fuel consumption (diesel) of 3.632 l/t [16]. The diesel supply chain and use was modeled by using the dataset “Diesel, burned in building machine” [11].
The final product (wood chips) goes directly to the means of transport that will be used for the transport to the energy plant.
Figure 4 shows the self-propelled chipper and tractor with trailer.
Figure 4. Self-propelled chipper (in front) and tractor with trailer (behind)
2.2.3 Transport to the plant
The transport of the wood chips to the plant can take place with a tractor equipped with a trailer when the distances are less than 10 km, or with a truck when the distances are greater. The efficiency of the transport process depends on three key variables [17]: the distance travelled, the form in which the biomass is transported (logs, branches, fresh wood chips) and the means of transport used.
To model the transport phase of chips to the biomass energy valorization plant, different scenario were analyzed considering different means of transport and supply distances, as shown in Table 4.
Table 4. Transport scenarios from the temporary storage to the energy plant
|
Means of Transport |
Distance (km) |
|
Tractor with trailer |
10 |
|
Truck |
50 |
|
Truck |
100 |
The impacts generated by the transport process with tractor were modeled using the dataset “Transport, tractors and trailers, agricultural”. To evaluate the transport by truck, the dataset “Transport, freight, lorry 7.5-16 metric ton, EURO 4” was considered [11].
2.3 Impact analysis and interpretation of results
In the impact analysis, a base case was defined as a reference for conducting the sensitivity analyses. In the base scenario, the transport phase takes place with a tractor and trailer over a distance of 10 km. The results concern the total impacts associated with the supply chain (from the collection of biomass to the transport of wood chips to the energy plant) (Table 5).
Table 5. The total impacts of the selected functional unit
|
Acronym |
UM |
Total |
|
CC |
kg CO2eq |
2.71E-02 |
|
ODP |
kg CFC-11eq |
4.48E-09 |
|
Htnce |
CTUh |
1.23E-08 |
|
Htce |
CTUh |
1.08E-09 |
|
PM |
kg PM2.5eq |
3.35E-05 |
|
IR |
kBq U235eq |
1.71E-03 |
|
IRE |
CTUe |
1.12E-08 |
|
POCP |
kg NMVOCeq |
3.58E-04 |
|
AP |
molc H+eq |
2.79E-04 |
|
EPT |
molc Neq |
1.31E-03 |
|
EPF |
kg Peq |
1.92E-06 |
|
EPM |
kg N eq |
1.20E-04 |
|
FE |
CTUe |
1.53E-01 |
|
LU |
kg C deficit |
8.15E-02 |
|
WU |
m3 watereq |
6.75E-06 |
|
ADPm&m |
kg Sbeq |
3.42E-07 |
|
PEnr |
MJ |
3.99E-01 |
|
PEr |
MJ |
7.04E-03 |
|
PEt |
MJ |
4.06E-01 |
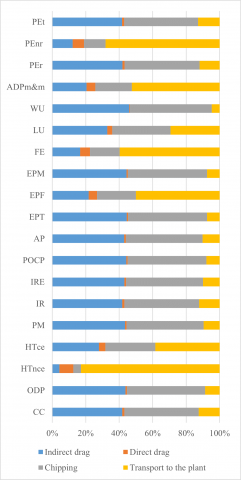
A dominance analysis (Figure 5) identified that the direct drag step affects the examined energy and environmental impacts with percentages ranging from about 0.5% to 6.81%.
The steps that contribute most to the impact categories are the indirect drag and the chipping, with percentages ranging from about 33% to 49% each, depending on the impact category. Some exceptions occur for the following impact categories, for which the transport step is the main responsible: human toxicity (cancer and non-cancer effects) (about 38.5% and 83%, respectively), freshwater eutrophication (about 50%), renewable energy consumption (about 68%), mineral, fossil & ren resource depletion (about 52.5%).
The sensitivity analysis was conducted only with reference to the primary energy consumption, total (PEt), renewable (PEr), non-renewable (PEnr) and climate change (CC).
In detail, the following scenarios were analyzed:
• Base scenario: the transport phase takes place with a tractor and trailer over a distance of 10 km;
• Scenario 2: the variation with respect to the base scenario consists in the use of a truck during the transport phase over a distance of 50 km;
• Scenario 3: the variation from the base scenario consists in the use of a truck during the transport phase over a distance of 100 km.
The results relating to the sensitivity analysis are presented below (Table 6).
The impacts associated with the transport phase generally increase as the distance increases. In detail, scenario 2 and 3 have a greater impact on CC (about 3 and 6 times more, respectively) than the base case. Similar variations are observed for PEt.
Figure 5. Dominance analysis of the supply chain stages
Table 6. Results of the sensitivity analysis: Impacts associated to the transport stage
|
|
Transport by Tractor and Trailer (10 km) Base Case |
Transport by Truck (50 km) Scenario 2 |
Transport by Truck (100 km) Scenario 3 |
|
CC (kg CO2eq) |
3.38E-03 |
1.00E-02 |
2.10E-02 |
|
PEr (MJ) |
4.79E-03 |
2.70E-03 |
5.40E-03 |
|
PEnr (MJ) |
4.77E-02 |
1.70E-01 |
3.40E-01 |
|
PEt(MJ) |
5.25E-02 |
1.74E-01 |
3.40E-01 |
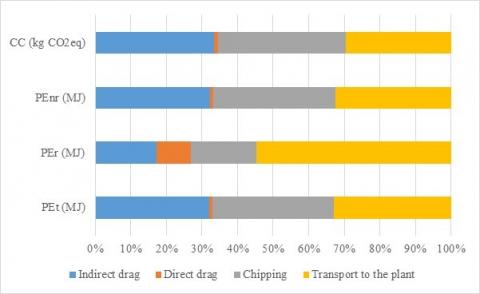
A dominance analysis relating to Scenario 2 (Figure 6) shows that the contribution of the transport step to CC is approximately 30%, while in the base scenario it is about 13%.
Similarly, the transport step contributes to PEt with a percentage equal to about 33%, with respect to the base case in which it is about 13%.
Figure 6. Dominance analysis: Impacts associated with the transport phase in the Scenario 2
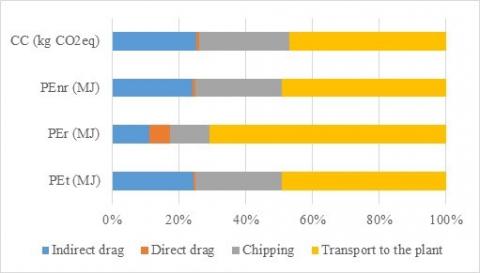
A dominance analysis relating to Scenario 3 (Figure 7) shows that the contribution of transport on CC and PEt is approximately 47% and 49%, respectively.
Figure 7. Dominance analysis: Impacts associated with the transport phase in the Scenario 3
The study presented an assessment of the energy and environmental impacts associated to the supply chain of 1 kg of wood chips from biomass of forest origin.
The analysis of the results obtained made it possible to establish that the environmental hot-spots of the supply chain are the indirect drag and the chipping. The analysis of the results also showed that 82.83% of the impact on the human toxicity (non-cancer effects) category is attributable to the transport phase.
Due to the variability of the distances between the place of production of the wood chips and the place of use, it was necessary to carry out a sensitivity analysis. The impacts generated by the transport phase of the wood chips, in fact, depend on the means of transport and the distance travelled.
The sensitivity analysis pointed out that the impacts increase with the increasing distance. Therefore, the creation of short supply chains for the production and use of biomass for energy purpose allows for optimizing its management with a view to the energy and environmental sustainability.
This work is developed within the research activities of the project BIOmasses Circular Holistic Economy Approach to Energy equipments (BIO-CHEAPER) funded within the Italian call PRIN 2017 Research Projects of National Relevant Interest Prot. 20175TXJER.
|
ADPm&m |
Mineral, fossil & ren resource depletion, kg Sbeq |
|
AP |
Acidification, molc H+eq |
|
CC |
Climate Change, kg CO2eq |
|
EPF |
Freshwater eutrophication, kg Peq |
|
EPM |
Marine eutrophication, kg Neq |
|
EPT |
Terrestrial eutrophication, molc Neq |
|
FE |
Freshwater ecotoxicity, CTUe |
|
HTce |
Human toxicity, cancer effects, CTUh |
|
HTnce |
Human toxicity, non-cancer effects, CTUh |
|
IR |
Ionizing radiation HH, kBq U235eq |
|
IRE |
Ionizing radiation E (interim), CTUh |
|
LCA |
Life Cycle Assessment |
|
LCI |
Life Cycle Inventory |
|
LCIA |
Life Cycle Impact Assessment |
|
LU |
Land use, kg C deficit |
|
ODP |
Ozone depletion, kg CFC-11eq |
|
PEnr |
Non-renewable primary energy, MJ |
|
PEr |
Renewable primary energy, MJ |
|
PEt |
Total primary energy consumption, MJ |
|
PM |
Particulate matter, kg PM2.5eq |
|
POCP |
Photochemical ozone formation, kg NMVOCeq |
|
RES |
Renewable energy sources |
|
WU |
Water resource depletion, m3 watereq |
[1] European Commission. (2019). Communication from the commission to the European parliament, the European council, the council, the European economic and social committee and the committee of the regions- the European green deal (Document 52019DC0640). https://eur-lex.europa.eu/legal-content/EN/TXT/?uri=CELEX%3A52019DC0640.
[2] Cusenza, M., Guarino, F., Longo, S., Mistretta, M., Cellura, M. (2020). Environmental assessment of 2030 electricity generation scenarios in Sicily: An integrated approach Renew. Energy, 160: 1148-1159. https://doi.org/10.1016/j.renene.2020.07.090
[3] European Commission. (2018). A sustainable Bioeconomy for Europe: Strengthening the connection between economy society and the environment. https://eatip.eu/wp-content/uploads/2020/05/Updated-Bioeconomy-Strategy-2018.pdf.
[4] Camaraza-Medina, Y., Sánchez-Escalona, A.A., Retirado-Mediaceja, Y., García-Morales, O.F. (2020). New procedure for thermal assessment of an air cooled condenser coupled to biomass power plant. International Journal of Sustainable Development and Planning, 15(8): 1297-1302. https://doi.org/10.18280/ijsdp.150816
[5] Luu, L.Q., Longo, S., Cellura, M., Sanseverino, E.R. (2020). A review on consequential life cycle assessment in the power sector. International Journal of Sustainable Development and Planning, 15(8): 1157-1168. https://doi.org/10.18280/ijsdp.150802
[6] ISO 14040. (2021). Environmental management – Life cycle assessment –Principles and framework.
[7] ISO 14044. (2021). Environmental management – Life cycle assessment –Requirements and guidelines.
[8] Frischknecht, R., Jungbluth, N., Althaus, H.-J., Bauer, C., Doka, G., Dones, R., Hischier, R., Hellweg, S., Humbert, S., Köllner, T., Loerincik, Y., Margni, M., Nemecek, T. (2007). Implementation of life cycle impact assessment methods. Ecoinvent report No. 3, v2.0. Swiss Centre for Life Cycle Inventories, Dubendorf. https://inis.iaea.org/collection/NCLCollectionStore/_Public/41/028/41028089.pdf.
[9] European Commission. (2010). Joint Research Centre - Institute for Environment and Sustainability, International Reference Life Cycle Data System (ILCD) Handbook -- General guide for Life Cycle Assessment -- Detailed guidance.
[10] European Commission. (2012). Joint Research Centre, Institute for Environment and Sustainability, Characterisation factors of the ILCD Recommended Life Cycle Impact Assessment methods. Database and supporting information.
[11] https://ecoinvent.org/, accessed on Jul. 10, 2023.
[12] Wernet, G., Bauer, C., Steubing, B., Reinhard, J., Moreno-Ruiz E., Weidema, B. (2016). The ecoinvent database version 3 (part I): Overview and methodology. The International Journal of Life Cycle Assessment, 21: 1218-1230. https://doi.org/10.1007/s11367-016-1087-8
[13] Baldini, S., Di Fulvio F., Laudati, G. (2010). Analisi della filiera di biomassa legnosa proveniente da interventi di diradamento: Un caso studio in una pineta dell'Italia centrale. Forest@-Journal of Silvicolture and Forest Ecology, 7(5): 177. https://doi.org/10.3832/efor0631-007
[14] Paletto, A., De Meo, I., Cantini, P., Chiavetta, U., Fagarazzi, C., Mazzà, G., Pieratti, E., Rillo Migliorini, G.M., Lagomarsino, A. (2018). Analisi della filiera foresta-legno in una prospettiva di (bio)economia circolare: Il caso studio della foresta di Monte Morello. L'Italia Forestale e Montana, 73(3): 107-128. https://doi.org/10.4129/ifm.2018.3.01
[15] CNR Ivalsa. (2007). Foresta - Legno - Energia. Linee guida per lo sviluppo di un modello di utilizzo del cippato forestale a fini energetici.
[16] Magagnotti, N. (2012). Analisi di cantieri di cippatura in merito ad aspetti operativi e di salvaguardia.
[17] Spinelli, R., Magagnotti, N., Nati C., Aguanno, M. (2006). Produzione di biomassa dalla gestione delle peccete artificiali. Dendronatura, 1: 35-46.