Agus Hari Hadi*![]() | Suprihatin
| Suprihatin![]() | Sukardi
| Sukardi![]() | Gatot Pramuhadi
| Gatot Pramuhadi![]() | Marimin
| Marimin![]() | Badrun Susantyo
| Badrun Susantyo![]() | Eko Wahyono
| Eko Wahyono![]()
© 2023 IIETA. This article is published by IIETA and is licensed under the CC BY 4.0 license (http://creativecommons.org/licenses/by/4.0/).
OPEN ACCESS
This research aims to improve the sustainability of the Kalibaru robusta coffee agroindustry through the use of soft system methodology and decision support tools. Data was collected through literature review, focus group discussions, interviews, observation, and field verification. The results show that quality assurance, technology, and resources are the main dimensions with a strong influence on sustainability. Based on the findings, 12 independent, 20 linkage, 23 dependent, and 16 autonomous sub-elements were identified. Strategic alternative formulations were developed using interpretive structural modeling and strategic assumption surfacing and testing methods. This study provides insights for sustainable development strategies in the robusta coffee agroindustry.
design concepts, development dimensions, sustainable agroindustry, strategy policy
Coffee plants grow well in tropical climates, approximately located at 20° North Latitude and 20° South Latitude. The coffee plantation area stretches from South America, Southeast Asia, and the South to several countries in Africa. In the past, European nations brought coffee seeds from Ethiopia and planted them in their country, but these plants could not grow properly, therefore, several European countries used their colonies which were located in the tropics to cultivate coffee, from here coffee became the main commodity for trade in the world. The largest coffee-producing country in the world comes from tropical climates, for the ASEAN region Indonesia is the second largest coffee producer and exporter after Vietnam, while at the world level, Indonesia is the fourth largest coffee exporter after Brazil, Vietnam, and Colombia. Plantations in Banyuwangi Regency are areas that are grown by industrial tree crops, one of which is coffee plantations, starting from the Kalibaru, Glenmore, Songgon, Pasangrahan, Glagah, Giri, Wongsorejo, Kalipura and up to Licin areas. Kalibaru is an area geographically located at an altitude of 428-800 MPDL, flanked by 2 national forests on the west side, namely Alas Gumitir and Meru Betiri, on the east side are Alas Purwo and Baluran forests, on the north side are Mount Raung and Ijen Crater, to the south are sea waters, and are dominated by robusta coffee plants, for the area of coffee plantations in Kalibaru is ± 3.847 ha with production of ± 4.124 tons/year, consisting of 53.08% government-owned plantations, 15.27% private plantations and 31.65% smallholder plantations, so it is important to manage this area in order to continue to increase the amount of production, maintain the quality and continuity of the raw materials produced, and continuously look for solutions for the sustainability of coffee resilience in the future by conducting a deeper detection of the dimensions of sustainability, then evaluate the development of strategic policies, and determine alternative assumptions ve critical to build a sustainable design concept in the robusta coffee agroindustry in Kalibaru (AGRIBARU). This research is an attempt to integrate thinking on environmental aspects, including product design, sourcing and selection of raw materials, manufacturing processes, delivery of the final product to consumers, and the product life cycle after its useful life [1, 2] to lead to a triple bottom line balance. namely profit, people, and planet [3, 4], which are also in line with the vision and mission of plantation development, namely: (1) the realization of a productive, competitive, and sustainable plantation agribusiness; (2) the application of good agriculture practices, optimization of resources efficiently and effectively, technical capabilities and clean moral integration [5, 6].
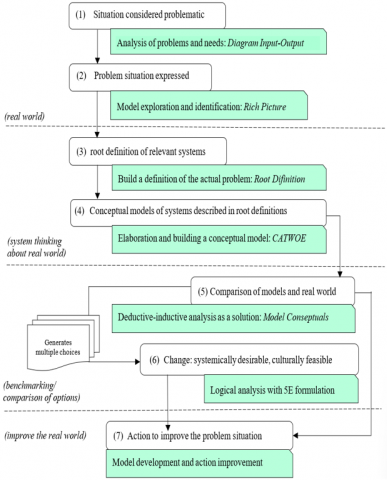
The concept and methodology of sustainability used are soft system methodology is a process-oriented problem approach [7-9] provides practical solutions [10, 11], adopts a participatory approach with stakeholders [12, 13], integrates dynamics to complex problems by prioritizing patterns of interaction between actors and experts for business development and increasing welfare [14, 15]. In this study, the Soft System Methodology (SSM) steps, which have 7 process stages, are added with information and inserted with a methodical approach to clarify and emphasize the study and facilitate visualization in evaluation, of course not changing the pattern and essence of the stages in the Checland and Poulter versions of the SSM process, as for the illustrations of the stages of the SSM process and method engagement in Figure 1.
Figure 1. Stages of the soft system methodology process and engagement method
Based on Figure 1, the stages of this study use SSM stages which are accompanied or involve ways to obtain a framework and potential results at each stage. It can be explained that the stages of the SSM process for stages 1 and 2 are exploring and analyzing problems, requirements, and identification of systems in the real world, which produce input-output diagrams and rich pictures. For stages 3 and 4 build the actual problem definition and elaborate the conceptual model using logic: do P by means of Q to achieve R, then build the conceptual model by involving experts, which produces Root Definition and CATWOE, for stages 5 and 6 are deductive analysis and inductive, then make a comparison between the conceptual model and the problem situation with the 5E formulation which includes efficacy (whether the chosen method is successful in producing output), efficiency (whether the use of resources in the transformation process is minimum use), the effectiveness of whether T (transformation) meets long-term goals, ethics (does the process not conflict with ethics), and elegance (sustainability), then determines changes according to circumstances and needs, produces a causal pie chart and logical analysis , for the stage 7 is to do back comparisons and create development models, which produce corrective actions and establish recommendations.
This study begins with studying problems and identifying needs in the real world, which results in a problem hierarchy analysis in Table 1. Then a needs analysis is carried out for each actor as a basis for determining the goals and objectives to be achieved, while the needs analysis for small farmers is: guarantees adaptive selling prices, fair profit sharing, infrastructure improvements, sustainable partnership patterns, access to technology and information, as well as ease of capital. For intermediaries/collectors are: profitable margins, continuity of product quantity and quality, price stabilization, minimization of business risk, low level of product damage, and access to technology, finance, and infrastructure. As for the industry, these are: maximizing profits, ensuring the quality and continuity of raw materials, increasing company productivity, ensuring partnerships with farmers/producers, and fulfilling needs according to market demand. Meanwhile, the regional and central governments are: equal distribution of needs, controlled inflation, and price stabilization. From this needs analysis, an input-output diagram was produced as the basic model in this study, shown in Figure 2.
Figure 2. Diagram input-output of AGRIBARU
Table 1. Problem hierarchy analysis of AGRIBARU
|
Levels Part of involved |
Problem objective |
Characteristic |
|
Directive |
|
|
|
|
The main person responsible for the sustainability of the coffee agro-industry business |
|
Startegic |
|
|
|
|
Responsible and involved as a whole in the agro-industry development process |
|
Tactical |
|
|
|
|
Agro-industry development programs are carried out regularly from pre-harvest to post-harvest and marketing |
|
Operational |
|
|
|
|
The program takes place regularly according to the time of the planting/harvest season and tends to be simultaneous |
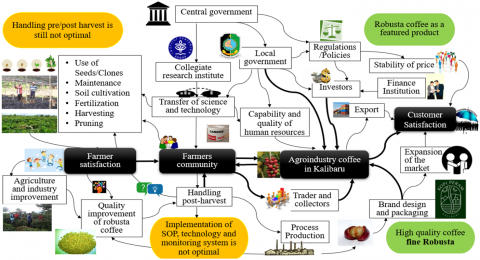
The general goals and objectives of this study are listed in Table 2. and to see deeper into the problem, exploration, and identification of the model are carried out in the form of a rich picture which is visualized in Figure 3.
From the results of direct observations in the field, it can be explained in Figure 3 that the problems of the coffee agro-industry in Kalibaru have not shown optimal handling both upstream and downstream. Quality improvement and efforts to produce superior products are a common agenda, starting from farmers, traders, collectors, government and all stakeholders. Supply chains and value chains that are still weak require thorough integration by involving universities as levers and drivers to formulate a more comprehensive policy development strategy. The level of farmer satisfaction will be in line with the level of consumer satisfaction, if there is an understanding between stakeholders who have the same views regarding quality, quantity and continuity as well as the running of all product, information and money flows.
Table 2. The goals and objectives of the design
|
Objectives |
Procedures to Achieve Goals |
|
Economic, social, and environmental development |
Community involvement in the coffee business |
|
Business development or expansion |
Regional expansion and intervention in several villages and districts |
|
Innovation and technology |
Innovation in cultivation, post-harvest, processing, and its derivative industries |
|
Education and training |
Training on planting, post-harvesting, and coffee processing for members |
|
Commercial cooperation |
Strengthen business networks and expand marketing of coffee products |
|
Implement policies |
Broader development or cooperation |
|
Target |
Kalibaru People's Coffee Plantation |
|
Stakeholders |
Network development and increased collaboration |
|
Market |
Continuous fulfillment of requests |
|
Operational |
Strengthen existing groups and members |
|
Member |
Strengthen the ability of old members and attract more members |
|
Performance |
Fulfillment of requests for increased productivity and quality of coffee |
Figure 3. Rich picture of AGRIBARU system model design
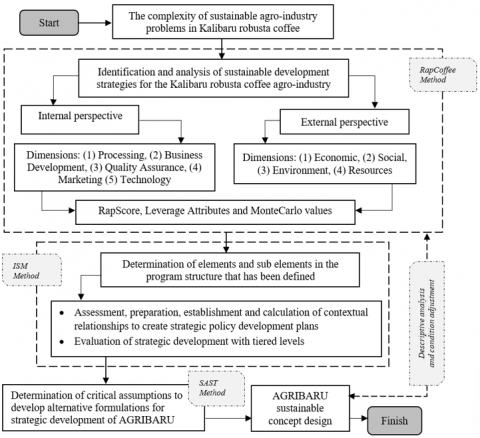
The concept of sustainable design in the Kalibaru robusta coffee agro-industry uses several decision-making techniques, namely Multi Dimensional Scaling hereinafter referred to as Rap Coffee [16-18] identify and analyze the development and complexity of the problem. Robusta coffee agribusiness in Kalibaru, refers to the dimensions of sustainability from an internal and internal perspective, then determines the elements in the established program structure [19], and evaluates strategic development with tiered levels using the Interpretive Structural Model [20, 21], then makes critical assumptions to build alternative formulations with the Strategic Assumption Surface and Testing Method [22] which is preceded by exploration and elaboration of problems using the SSM approach, following the research scheme of Figure 4.
Figure 4. Research scheme of AGRIBARU
3.1 MDS-RapCoffee
The Multidimensional Scaling (MDS) method is used by the Center for Fisheries at the University of British Columbia, while Rapfish is an extension of the MDS for rapid assessment of fisheries, which is designed to be purposeful, transparent, and is one of the multi-disciplinary evaluation techniques, without replacing stock assessments. conventional in setting specific goals [23] Sustainability can be analyzed through several perspectives, one of the techniques that can be used is the Rapid Appraisal technique, which was previously used in fisheries analysis so it is called the Rapfish analysis technique [24, 25] while the sustainable status can be divided into: (1) discontinuous status with index values range from 0-20; (2) barely growing with an index between 21-40; (3) moderate with an index between 41-60; (4) almost continuous with index 61-80; and (5) sustainable with an index of 81-100 [26, 27] and currently, many studies are using this technique in various sectors. RapCoffee is implemented using the R software, while the RapCoffee stages in the R system are carried out by identifying sustainability issues, determining sustainability dimensions and indicators, then entering data in excel format and then the data that has been entered into the R software is processed to produce a sustainability index output [27]. The steps taken to implement MDS are as follows: (a) Determination of aspects and indicators is carried out by way of discussion and assessment with experts. Scores are given on an ordinal scale ranging from 1 (low) to 5 (high) according to the character of the indicator being measured; (b) Coordination to increase attribute factors based on Root Mean Square (RMS) on the X and Y axes, to determine the ordinate based on Euclidean distance (d), which is formulated:
$d=\sqrt{\left(X_1-X_2\right)^2+\left(Y_1-Y_2\right)^2}$ (1)
This value is then approximated by a distance regression (dij) from point 1 to point j to the starting point (δij) using the following formula:
$d_{i j}=\alpha+\beta \delta_{i j}+\varepsilon$ (2)
This formula is regressed using the ASCAL method, which optimizes the squared distance (dij) to the starting point (Oijk) in 3 dimensional space (i, j, k), expressed by the S-Stress formula (S):
$S=\sqrt{\frac{1}{m} \sum_{k=1}^m\left|\frac{\sum_i \sum_j\left(d_{i j k}^2-O_{i j k}^2\right)^2}{\sum_i \sum_j O_{i j k}^2}\right|}$ (3)
(a) Sensitivity analysis (leverage) and uncertainty using the Monte Carlo method to determine the error in the assessment. Error estimation was performed within 95% confidence intervals. Sensitivity analysis is needed to observe the most sensitive indicators that contribute to the sustainability index.
(b) The weighting aims to determine the priority of each aspect of sustainability. The weighting results are multiplied by the sustainability index value obtained through the MDS method. The concept of weighting will turn the order into a value, where the first order has the highest (value) and the second order has a lower level (value). The weight value (We) can be calculated using the following formula:
$W_e=\sum_{j=1}^n \lambda_{e j} / \sum_{e=1}^k \lambda_{e j} \sum_{j=1}^n e_{e j}$ (4)
where, λ is the objective value of λ by expert j, and n is the number of experts. Furthermore, this research refers to multidimensional analysis which is divided into two dimensions, namely internal dimensions: (1) processing, (2) business development, (3) quality assurance, (4) marketing, (5) technology and external dimensions: (1) economic, (2) social, (3) environmental, (4) resources, the use of RapCoffee in this study through a mode value approach resulting from expert perceptions using a Likert scale, on each dimension and attribute. This study uses secondary data, then the data is coordinated, grouped, and made into blocks, calculations, indexing, and scoring are carried out according to the dimensions and attributes that have been made, RapCoffee will compensate and map objects into distances between spaces, so that the dimensions entry can be determined in the category of good (strong sustainability) or bad (weak sustainability). This technique is a technique in the sustainability evaluation category that functions to bridge complex and dynamic cases towards new sustainability by existing changes, and the stages, techniques, and formulas for solving them in detail can be described in Figure 5.
Figure 5. Technical stages and evaluation of sustainability
3.2 Interpretative Structural Modeling (ISM) method
This method is one of the strategic policy development techniques, used to deal with habits that are difficult to change, and can identify relationships between items. The ISM technical approach is divided into two parts, namely the hierarchical arrangement and sub-element classification. The basic principle of the ISM technique is to identify the structure in a system that can provide high-value benefits in formulating the system effectively in making better decisions. The arrangement of a hierarchy is done to determine the level of structure of a system, thus providing clarity in understanding the material being studied. The structure is used to describe the arrangement of elements and relationships between elements that contribute to forming a system. The program studied is compiled and then divided into elements, each element is broken down into several sub-elements [28, 29]. Elements can be policy objectives, organizational targets, rating factors, etc. The ISM technique is very suitable for compiling a program structure based on key elements that have the highest driving force and the lowest level of dependency and each output of an element (subsystem) is input for another element (subsystem) [30, 31].
3.3 Strategic Assumption Surfacing and Testing (SAST) method
This method can identify the stakeholder components that are affected by the policy, and serves to help reveal the critical and strategic assumptions that underlie the policy [32]. SAST also aims to ensure that alternative policies and procedures must always be considered in cross-actor coordination processes. The steps taken in the SAST technique to formulate alternative strategic assumptions in the development of a basic knowledge-based model are (1) forming a group involving parties who have criteria and strategies, and (2) making assumptions (assumptions that emerge) to explore the information significantly. Throthe ugh group, discussions to make the desired policies and strategies, (3) explore cases studied through expert discussions, (4) synthesize results of compromises on assumptions that can produce new strategies in continuing and outperforming old strategies. The SAST pattern was built because almost all organizations find it difficult to break away from old habits, in addition to solving existing problems SAST also aims to create alternative policies and procedures that encourage organizational development through a learning process. This method will bring conflicts to the surface and then resolve them by displaying answers on the map, which are arranged based on "important" or "certain" weighted assumptions. Assessment is obtained by providing a relative assessment of the weight of each component in each answer [21] using the SAST philosophy with several characteristics, namely: (1) On the other hand, with the belief that efforts to assess unstructured problems can be broken down properly, then they can be explained properly after considering conflicting perspectives. (2) Participatory, as a way to acquire broad and varied knowledge through involving various individuals or related groups or different organizations to solve complex problems and then distribute the implementation of the results of solving these problems to various parties. (3) Integrative, based on the assumption that it is necessary to synthesize from various points of view to formulate a practical action plan. (4) Support managerial ideas, where involving experts and managers can build confidence in the various assumptions that have been set.
Data collection is carried out by (1) Desk study: at this stage, an information search is carried out regarding the internal and external perspectives that will be used, then identifying the dimensions and attributes used. (2) Consultation and expert assessment: this activity is carried out to obtain an assessment of the dimensions and attributes that have been made, by assessing the questions that have been prepared, as well as consultation regarding questions in the attribute column, as well as extracting information related to secondary data for information improvement. (3) Field verification: this activity is carried out through field visits to enrich secondary data with existing facts, besides that during field visits interviews/discussions are conducted with relevant agencies, local village officials, coffee actors, and activists.
4.1 Internal and external perspective data
Data collection was carried out by distributing questionnaires using a likert scale to four experienced experts, while the results of the data tabulation are in Table 3.
Table 3. Internal and external dimensions data tabulation
|
Perspective > Coffeeries V |
Dimensions |
Processing |
Business Development |
Quality Assurance |
Marketing |
Technology |
Economic |
Social |
Environment |
Resources |
|
Code |
PC |
BD |
QA |
MR |
TC |
EC |
SC |
EV |
RS |
|
|
Ex. PTPN XII (41th) |
DJW |
3,00 |
4,00 |
3,00 |
4,00 |
4,00 |
3,00 |
4,00 |
3,00 |
5,00 |
|
Active plantation practitioner |
ZAL |
3,00 |
3,00 |
5,00 |
3,00 |
3,00 |
4,00 |
3,00 |
4,00 |
4,00 |
|
Academics (S3) |
IQB |
3,00 |
3,00 |
2,00 |
3,00 |
2,00 |
3,00 |
3,00 |
3,00 |
4,00 |
|
Coffee Community (34th) |
YHS |
2,00 |
2,00 |
2,00 |
2,00 |
2,00 |
2,00 |
2,00 |
2,00 |
5,00 |
4.2 Program structure data
Data collection at this stage used a questionnaire that was distributed to three experts representing actors from coffee plantations, academics, and the government, while the questionnaire consisted of 9 program structures, hereinafter referred to as elements, namely (A) identification of influential sectoral communities, there were 8 sub-elements; (b) program needs, there are 8 sub-elements; (C) the main obstacles that arise, there are 11 sub-elements; (D) the potential for change, there are 7 sub-elements; (E) focus on program objectives, there are 7 sub-elements; (f) benchmarks in assessing each program there are 9 sub-elements; (g) activities required for action planning, there are 9 sub-elements; (h) a measure of effectiveness to assess the achievement of each activity, there are 7 sub-elements; and (I) the institutions involved in program implementation, there are 5 sub-elements described in Table 4.
Table 4. Program structure element data for sustainable design concept analysis
|
A |
Identify influential sectors of society |
|
A1 |
Community farmers |
|
A2 |
Traders |
|
A3 |
Agroindustry-coffee Industry/Others |
|
A4 |
Indigenous NGO |
|
A5 |
Village-Regional-Provincial-Central Government |
|
A6 |
Campus |
|
A7 |
Public figure |
|
A8 |
Millennial Generation |
|
B |
The need for programs |
|
B1 |
Guaranteed adaptive selling price |
|
B2 |
Minimizing business risks |
|
B3 |
Fair profit sharing |
|
B4 |
Continuity of product quantity and quality |
|
B5 |
Infrastructure improvements |
|
B6 |
Sustainable partnership pattern |
|
B7 |
Access to technology and information |
|
B8 |
Ease of Capital |
|
C |
The main obstacle that arose |
|
C1 |
Availability of derivative industry management |
|
C2 |
Working capital for coffee cultivation, harvesting, and postharvest business |
|
C3 |
Supervision and weak implementation of quality standardization |
|
C4 |
The low quality of the coffee commodity produced. |
|
C5 |
The application of technology (agronomy, processing, and post-harvest) is still limited |
|
C6 |
Productive technology and collaboration packages are not yet available |
|
C7 |
Inadequate infrastructure to support coffee production activities |
|
C8 |
Limited market information and a clear marketing system have not been established. |
|
C9 |
Land ownership still varies and has not been measured with a definite area. |
|
C10 |
Weak farmer institutions in determining the position (gaming position). |
|
C11 |
Awareness has not yet been formed to build a sustainable coffee agro-industry |
|
D |
Possible potential changes |
|
D1 |
Coffee quality with fine robusta orientation |
|
D2 |
Target quantity |
|
D3 |
Opening of importing countries |
|
D4 |
Great potential for downstream production centers for coffee plantations |
|
D5 |
The high demand for coffee products and processed products |
|
D6 |
Availability of machinery and equipment ranging from cultivation, harvest, and post-harvest |
|
D7 |
The potential for sustainable coffee agribusiness development |
|
E |
Focus on program goals |
|
E1 |
Sustainability reach |
|
E2 |
Implementation of GAP/GMP/SOP by village government, investors, and community of experts |
|
E3 |
Partnership cooperation based on cash and carry payment |
|
E4 |
Empowerment and utilization of local energy sources during the harvest season (red picks) |
|
E5 |
Activation of socio-cultural activities and field education to welcome the harvest season |
|
E6 |
Build a product processing unit with the recommended technology and equipment |
|
E7 |
Improvement of infrastructure, access to distribution, and provision of alternative markets |
|
F |
Benchmark in assessing each program |
|
F1 |
There are Networking and partnerships |
|
F2 |
Build strong social capital |
|
F3 |
Adequate infrastructure |
|
F4 |
Have strong competence/expertise |
|
F5 |
There is a strong innovation base |
|
F6 |
There are big companies |
|
F7 |
Access to transportation and distribution |
|
F8 |
Strong access to capital |
|
F9 |
Access to information technology |
|
G |
Activities required for action planning |
|
G1 |
Mapping and mapping of fine robusta-oriented coffee areas |
|
G2 |
Sustainable robusta coffee processing |
|
G3 |
Socialization of fine-oriented coffee quality, according to geographical conditions |
|
G4 |
Increase coffee consumption with good and healthy standards. |
|
G5 |
Expansion and penetration of new markets |
|
G6 |
Rejuvenation and expansion as well as factory establishment |
|
G7 |
Knowledge of sustainable agribusiness |
|
G8 |
Utilization of farmer groups to become Community farmer |
|
G9 |
Development of Women Farmers Groups (WFG). |
|
H |
Measures of effectiveness to assess the achievement of each activity |
|
H1 |
Increasing production, productivity, and quality of sustainable coffee plants |
|
H2 |
Improvement and application of Good Agriculture Practices (GAP, GMP, and SOP) |
|
H3 |
Plant pest control (OPT) |
|
H4 |
Provision of recommended superior clone seeds and procurement of production facilities |
|
H5 |
Application of Indonesian National Standard (SNI) |
|
H6 |
Human resource development for small farmers and workers |
|
H7 |
Partnerships between farmers that are mutually beneficial and sustainable. |
|
I |
Agencies involved in program implementation |
|
I1 |
Financial institutions |
|
I2 |
Research Institute |
|
I3 |
Campus |
|
I4 |
Regional Government Services, SMEs, and Cooperatives |
|
I5 |
Community of farmers, SMEs, and coffee activists |
5.1 Problem elaboration of Kalibaru robusta coffee
Low productivity and quality are caused by improper pre-harvest and post-harvest handling of coffee, as well as the absence of a vision and mission at the level of sustainability efforts, making it less efficient and effective. This problem will be analyzed carefully in the root definition, which is an activity in the system that carries out planning, supervision, and control of pre-harvest, post-harvest processes, and efforts to properly process sustainable Robusta Kalibaru coffee (P), and as a whole involves various interested parties. (Q), so that Robusta coffee is produced as a regional superior product of high quality both at the domestic and international levels (R), the root definition results of the problem are described in the CATWOE conceptual model as in Table 5.
Table 5. CATWOE analysis of AGRIBARU
|
Descriptions |
Results Definitions |
|
Customer: |
Farmers, Traders/Collectors, Agroindustry, End Users |
|
Actor: people and the role of the system in activities |
Farmers: actors who carry out pre-harvest coffee activities such as coffee nurseries, coffee planting, coffee plant maintenance, and coffee harvesting to traditional coffee processing and post-harvest handling. Traders/Collectors: Actors collect coffee commodity products from farmers and process and sell them to various agro-industry or related companies Universities: institutions that provide scientific facilities and institutions that can cooperate in research to solve the problem of sustainable coffee quality Agroindustry: actors who carry out production activities at the industrial level with coffee as raw material |
|
Transformation: The process of changing inputs into outputs |
Planning, control, and improvement activities for pre-harvest, post-harvest, and marketing of finished coffee products have not been established properly and comprehensively by involving various interested parties to produce quality coffee locally and internationally |
|
World-view: Impact of system implementation |
Good and integrated cooperation has not been established between pre-harvest activity actors (farmers, extension workers), post-harvest activity actors (farmers, collectors, traders), and production actors (agroindustry) and educational institutions to improve quality in building a sustainability process |
|
Owner: An authorized actor terminates system activity |
Farmers, Entrepreneurs (agroindustry), Local Government |
|
Environment: Environmental barriers to on-site systems |
There is no adequate support between the central and regional governments for farmers in the provision of quality superior coffee seeds Low farmer education in handling pre-harvest and post-harvest processes Support from financial institutions to finance planning, supervision, and control of pre-harvest and post-harvest coffee is still lacking |
5.2 Build a conceptual model
Based on the deductive and inductive analysis in the first stage: classifying the program structure elements into three parts, namely planning, controlling, and improvement, the second stage: looking for potential relationships between elements that support and complement each other, and for the third stage: classifying the elements into four levels, namely: directive, strategic, tactical and operational, is illustrated in Figure 6.
Figure 6. Conceptual model of program structure elements
5.3 Logical analogy with the 5E formulation
Analysis of the transformation logic between elements in each program shows that the conversion of each relationship from element one to the element in question is considered not potentially successful and/or not based on the five criteria set out in Formulation 5E as shown in Table 6.
Table 6. Formulation of the 5E elements of the program structure
|
No |
Aspect |
Formulation between elements in the program structure |
|
1 |
Efficacy |
There is no comprehensive and systematic collaboration between related parties, so there is great potential for improvement in efforts to build sustainability for the development of the Kalibaru robusta coffee agroindustry. |
|
2 |
Efficiency |
Utilization of natural resources and labor has not shown compatibility with the needs of sustainability issues, namely economic, social and environmental improvements. |
|
3 |
Effectiveness |
There are no objectives for planning, monitoring, and controlling, as well as improving aspects of coffee cultivation, processing, use of technology, and/or upstream-downstream. |
|
4 |
Ethically |
All efforts made to improve and preserve Kalibaru coffee will not reduce and violate the rights of farmers, and will not violate ethics, morals, humanity, and religion as well as applicable laws, instead, they will have a better impact. |
|
5 |
Elegance |
The efforts made in increasing and maintaining Kalibaru coffee are by the triple bottom line balance and issues of stronger recovery and joint recovery as a result of the G20 conference in Bali namely energy transition, digital transformation, and focus on global social health. |
5.4 Sustainability status of AGRIBARU
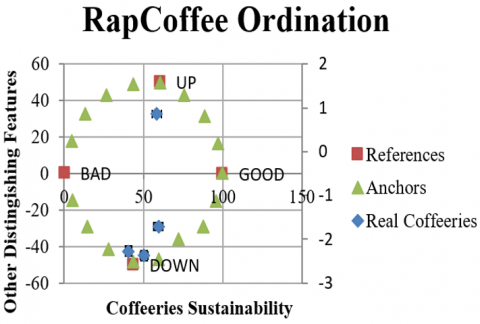
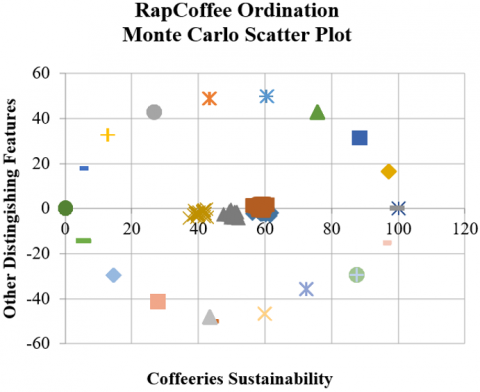
Based on the results of RapCoffee Analysis, the real value of coffee is strengthened by Monte Carlo analysis, the value of sustainability from an internal perspective is better than an external perspective because only one internal dimension falls into the category of almost unsustainable status with a score between 21-40, namely the business development dimension of 31.85. As for the external perspective, two dimensions fall into the almost unsustainable category, namely the social dimension of 35.39 and the environmental dimension with a value of 37.16 as shown in Figure 7.
Figure 7. RapCoffee ordination
Based on the results of the LEVERAGE analysis for all dimensions of the Kalibaru robusta coffee agro-industry, there are main dimensions that have a strong influence on sustainability, namely the dimensions of quality assurance, technology, and resources with a value in each dimension ≥ 1, while the Range Sum Query (RSQ) value is 0.9353 and a Strees value of 0.1816, this shows that the three dimensions above have a strong and very good influence (strong sustainability) to be considered and considered in formulating and making sustainable design concepts, as shown in Figure 8 and Figure 9.
Figure 8. Leverage of dimensions
The results of the analysis of the dimensions and attributes of the Kalibaru robusta coffee agro-industry based on expert judgment obtained an average index value of 0.4984 meaning that the overall sustainability status is in the medium sustainability classification, while the partial sustainability status has one sustainability dimension, with a value of 89.41 on the quality assurance, and two dimensions in the almost sustainable classification, namely (1) the technological dimension with a score of 62.54; (2) the resource dimension with a value of 57.14, and there are also three dimensions in the medium sustainability classification, namely (1) the economic dimension with a value of 50.59; (2) marketing dimensions with a value of 45.12; (3) the processing dimension with a value of 42.16, and there are three that fall into the almost unsustainable category, namely (1) the environmental dimension with a value of 37.16; (2) the social dimension with a value of 35.39; business development dimension with a value of 31.85. In the almost non-sustainability status dimension, it is necessary to intervene on attribute values by generating recommendations to increase the index value, so that the sustainability value can be estimated. in Figure 10.
Figure 9. Ordination Monte Carlo
Figure 10. Sustainability dimension overlay diagram of AGRIBARU
5.5 Strategic policy development
At this strategic policy development stage, data processing was carried out using ISM PROFESSIONAL 2.0 software developed by the Swanstatistics Team, namely a web-based application with the R programming language. Interpretative Structural Modeling was initiated by John N. Warfield in 1973 and is one of the modeling techniques developed for strategic planning in the group learning process. Following are some of the results of processing on element A, namely the identification of influential people, as shown in Figure 11.
Figure 11. Distribution of influential elements of society
From the analysis of the figure above, the distribution of sub-elements in element A causes community farmers (A1) to have a strong push to become a priority in building an influential community program structure, then the higher education sub-element (A6) also has a strong push, even though it has little dependence on other program structures, there are sub-elements at level III namely indigenous NGOs (A4), Village-Provincial-Central Government (A5), community leaders (A7), and Millennial Generation (A8) who are in a position of driving power and dependency are weak, requiring attention and interest linkages to build involvement with other program structures, while positions that have weak driving power are found in the small-large trader’s sub-element. (A2) and coffee agro-industry (A3), but these sub-elements can be used as alternative drivers if sub-elements at the level I experience complex difficulties in formulating development policies. The overall data processing results for the 9 elements studied, for plotting and mapping of dependent and independent power, as well as the level of distribution of the scattered sub-elements and grouped in Table 7.
In the structure of the AGRIBARU program, there are 71 sub-elements spread over 4 sectors. For policy development, evaluation is carried out in stages by selecting sub-elements that have strong driving forces and dependencies at each level. The first scheme that becomes a priority is the target of the independent variable program which has a greater impetus, namely at level IV which consists of: farmers community (A1) in influential communities (A); adaptive selling price guarantee (B1) with program needs (B); availability of derivative industry management (C1); infrastructure supporting coffee production that is inadequate (C7) is the main obstacle that arises (C); coffee quality with fine robusta orientation (D1) towards potential changes that may occur (D); socialization of sustainability (E1) on the focus of program objectives (E); there are networks and partnerships (F1), strong social capital is built (F2), there is a strong innovation base (F5) on benchmarks in assessing each program (F); plotting and mapping the fine robusta oriented coffee area (G1) on the activities required for action planning (G); increase in production, productivity and quality of sustainable coffee plants (H1) on a measure of effectiveness to assess the achievements of each activity (H) and financial institutions (I1) in institutions involved in program implementation (I). Then at level III, namely the field of linkages is a program goal that can increase the main goal, but the lack of attention to the sub-elements at this level will cause program failure, so the sub-elements at this level must also become co-driving power for the main program objectives, consisting of A6, B2, B3, B5, B7, C2, C4, C8, D2, D3, D6, D7, E4, F3, G2, G4, G5, H2, H3, and I2. Then at level II, namely the dependent sector is in a position of weak driving force and dependence, so attention and linkages of interests are needed to build involvement with other program structures, consisting of A4, A5, A7, A8, B6, C3, C5, C6, C9, D4, E2, E3, E6, F4, F8, F9, G3, G6, G7, H6, H7, I4, and I5.
Table 7. Potential and development of the AGRIBARU program structure
|
Element |
A |
B |
C |
D |
E |
F |
G |
H |
I |
|
Total Sub-element |
8 |
8 |
11 |
7 |
7 |
9 |
9 |
7 |
5 |
|
Sector |
Distribution of sub-elements to sectors |
||||||||
|
Level I Autonomous |
A2, A3 |
B4, B8 |
C10, C11 |
D5 |
E5, E7 |
F6, F7 |
G8, G9 |
H5, H4 |
I3 |
|
Level II Dependent |
A4, A5, A7, A8 |
B6 |
C3, C5, C6, C9 |
D4 |
E2, E3, E6 |
F4, F8, F9 |
G3, G6, G7 |
H6, H7 |
I4, I5 |
|
Level III Lingkage |
A6 |
B2, B3, B5, B7 |
C2, C4, C8 |
D2, D3, D6, D7 |
E4 |
F3 |
G2, G4, G5 |
H2, H3 |
I2 |
|
Level IV Independent |
A1 |
B1 |
C1, C7 |
D1 |
E1 |
F1, F2, F5 |
G1 |
H1 |
I1 |
5.6 Alternative strategic development
For further processing, the data used in strategic development alternatives are sub-elements of each element in the autonomous sector at the level I, while the results of the SAST test are illustrated in Figure 12.
After analysis using the Strategic Assumption Surface and Testing (SAST) method, the critical assumptions located in quadrants II, III, and IV can be ignored in formulating policy alternatives because this sector is still in the category of problematic planning and needs further evaluation to involve sub-elements in the sector so that critical assumptions adjacent to the sector are not a planning priority in this strategic development alternative. Based on the mapping of the situation and the formulation of the strategy, the sectors that become an alternative focus are sectors with a high level of certainty and interest which are the benchmarks in the development of alternative strategies, from the results of the synthesis in quadrant I, the value of certainty and interest is set at ≥ 5.7 As for the assumption alternative development strategies selected and which are development priorities are: 1. Continuity of product quantity and quality (B4), 2. Development of women farmer groups (G9), 3. Development of coffee agro-industry (A3), 4. Strengthening of farmer institutions in determining position (C10), 5. Improvement of infrastructure, access to distribution, and provision of alternative markets (E7), 6. Involvement of universities (I3), and 7. Activation of socio-cultural activities and field education in welcoming the harvest season (E5).
Figure 12. Alternative of AGRIBARU strategy
5.7 Managerial implication
This research can be used as an initial scheme for making a pilot project in an area and can also be used as a recommendation for practical implementation at the application level. The results of this study have very good implications and broad implications, if supported by planning, controlling and improving program structures by involving control mechanisms for every action at every level, namely: (1) directive: developing networks and increasing cooperation by involving influential and permanent communities focus on program needs; (2) strategic: carrying out business development and area expansion, technological innovation, cultivation innovation to the processing industry and its derivatives, as well as intervening in meeting market demand by taking into account potential changes and constraints that may arise; (3) tactical: strengthening the capabilities of old members and recruiting new members by conducting regular education and training by assessing each program as a benchmark for sustainability activities; and (4) operational: strengthening business and strengthening groups in carrying out policies to increase productivity, quality and quantity of coffee with a measure of effectiveness in achieving implementation in each program, which is accompanied by a monitoring and evaluation system for sustainability at every level.
6.1 Conclusion
The concept of sustainable design is the need for every actor that can be used as a basis for determining the targets to be achieved. This can be seen from the results of research that produced three dimensions of sustainability status, namely the dimensions of quality assurance and technology on internal perceptions and the dimensions of resources on an internal perspective. This shows that each criterion in these dimensions is a top priority for improvement, namely (1) dimensions quality assurance by taking action to understand and implement GAP, GMP, SOP, labeling, certification must refer to national standards; (2) the technological dimension by making improvements and using more efficient equipment at each stage of the process from upstream to downstream to packaging; (3) dimension of resources by planning and controlling in increasing sustainable productivity, preparing the availability of raw materials in better quality, quantity, continuity, and distribution. Based on the expert's assessment, the overall sustainability status is in the medium sustainability classification, so it is necessary to interfere with each attribute on the almost unsustainable dimension, namely (1) the environmental dimension through cultivation management with an organic system, waste management with the 8R system, prevention and maintenance of potential damage land, (2) the social dimension through increasing skills, fulfilling human rights, health, and safety services, and increasing institutional access, (3) the business development dimension, namely conducting entrepreneurship training activities, strengthening and innovating partnership models, group empowerment, business legalization and regular business meetings.
At the policy development stage and strategic development alternatives, planning, control and improvement can be proposed which refers to sector classification by looking at the potential distribution of sub-elements that have a strong attachment as program drivers and drivers for each element, namely: (A) involving the community influence by developing and expanding networks with farmers, community farmers, universities, traditional institutions and traders, as well as strengthening and increasing structured cooperation by involving the community in the coffee business, (B) fulfilling program needs with guaranteed adaptive selling prices, making constructive analysis of business risks that may arise, building a new partnership pattern by prioritizing rational profit sharing and building a sustainability plan for continuity of product quantity and quality, (C) creating a derivative industry development scheme, helping to gain the trust of investors and financial institutions to gain more in joint efforts, overseeing each unit against agreed quality standards and expanding farmer groups by recruiting new members with better abilities and skills, (D) building potential for change by continuing to develop opinions on the importance of fine-oriented coffee quality, building on the importance building downstream production centers close to raw materials, intervening farmers with sustainable management so that market mechanisms will be formed automatically and with high demand potentially increasing income, (E) conducting socialization on the importance of implementing GAP/GMP/SOP in improving quality and quantity, empowering local workforce sources and activating socio-cultural activities and field education to welcome the harvest season, (F) planning sustainable partnerships by expanding networks using digital media, improving distribution channels, infrastructure and bringing building a product processing unit to increase production, (G) carrying out action activities by making maps and mapping of fine robusta oriented coffee areas, processing robusta coffee with a sustainability strategy, strengthening the capabilities and utilization of old farmer groups, (H) developing human resources and business consolidation with a measure of the effectiveness of achieving implementation in each program, and (I) encouraging institutions involved in program implementation, especially financial institutions, research centers, local governments, related agencies, universities and communities of coffee activists.
6.2 Recommendations
To build a sustainable design concept, it is advisable to involve more influential community structures in an area and make better plans by prioritizing the practical needs of short, medium, and long-term programs, and in sustainability research, it is advisable to involve coffee experts from several fields of expertise and institutions as well as involving coffee farming communities from other research areas as a comparison.
Stakeholders and policymakers are encouraged to carry out complete collaboration from concept to application involving farmers, universities, traditional NGOs, and related agencies, to form an integrated system from upstream to downstream.
The study in this paper was conducted in Kalibaru, Banyuwangi Regency, East Java, Indonesia with an area of coffee plantations reaching 4,847.74 ha with details of 1,943.24 ha for PTPN XII, 558.98 ha for PBS and 1,158.74 ha for smallholder plantations, involving 4 experts for sustainability assessment, 3 experts for policy development, 1 expert in developing strategic alternative formulas, and only involving coffee farmers and communities in the area.
Thank you to all residents of Kalibaru village, from the planters to Kalibaru coffee activists, and all robusta coffee experts in East Java, the National Research and Innovation Agency (BRIN), and IPB-University.
[1] Srivastava, S.K. (2007). Green supply-chain management: A state-of-the-art literature review. International Journal of Management Reviews, 9(1): 53-80. https://doi.org/10.1111/j.1468-2370.2007.00202.x
[2] Stadtler, H. (2005). Supply chain management and advanced planning––basics, overview and challenges. European Journal of Operational Research, 163(3): 575-588. https://doi.org/10.1007/s11934-006-0006-0
[3] Porter, M.E., Kramer, M.R. (2006). The link between competitive advantage and corporate social responsibility. Harvard Business Review, 84(12): 78-92.
[4] Ahi, P., Searcy, C. (2013). A comparative literature analysis of definitions for green and sustainable supply chain management. Journal of Cleaner Production, 52: 329-341. https://doi.org/10.1016/j.jclepro.2013.02.018
[5] Website. (2019). Vision and mission of development. https://disbun.jatimprov.go.id/web/front/halaman_static/visi_misi.
[6] Sriwana, I.K., Arkeman, Y., Syah, D., Marimin. (2017). Sustainability improvement in cacao supply chain agro-industry. World Review of Science, Technology and Sustainable Development, 13(3): 256-275. https://doi.org/10.1504/WRSTSD.2017.087154
[7] Checkland, P., Scholes, J. (1999). Soft Systems Methodology in Action. John Wiley & Sons.
[8] Checkland, P. (1991). Systems Thinking, Systems Practice. John Wiley & Sons, Chichester
[9] Pagell, M., Shevchenko, A. (2014). Why research in sustainable supply chain management should have no future. Journal of Supply Chain Management, 50(1): 44-55. https://doi.org/10.1111/jscm.12037
[10] Hanafizadeh, P., Aliehyaei, R. (2011). The application of fuzzy cognitive map in soft system methodology. Systemic Practice and Action Research, 24: 325-354. https://doi.org/10.1007/s11213-011-9190-z
[11] Xie, R., Yao, S., Han, F., Fang, J. (2019). Land finance, producer services agglomeration, and green total factor productivity. International Regional Science Review, 42(5-6): 550-579. https://doi.org/10.1177/0160017619836270
[12] Hidle, U. (2011). The role of professional values in motivating associate degree nursing students to pursue higher nursing education. International Journal of Nursing Education, 3(2).
[13] Vachon, S., Klassen, R.D. (2006). Extending green practices across the supply chain: the impact of upstream and downstream integration. International Journal of Operations & Production Management, 26(7): 795-821. https://doi.org/10.1108/01443570610672248
[14] Darmawan, M.A., Putra, M.P.I.F., Wiguna, B. (2014). Value chain analysis for green productivity improvement in the natural rubber supply chain: A case study. Journal of Cleaner Production, 85: 201-211. https://doi.org/10.1016/j.jclepro.2014.01.098
[15] Dalkin, S., Lhussier, M., Williams, L., Burton, C.R., Rycroft-Malone, J. (2018). Exploring the use of Soft Systems Methodology with realist approaches: A novel way to map programme complexity and develop and refine programme theory. Evaluation, 24(1): 84-97. https://doi.org/10.1177/1356389017749036
[16] Septarianes, S., Marimin, Raharja, S. (2020). Strategy to improve performance and sustainability of robusta coffee agroindustry supply chain in tanggamus district. Jurnal Teknologi Industri Pertanian, 30(2): 207. https://doi.org/10.24961/j.tek.ind.pert.2020.30.2.207
[17] Septiani, W., Marimin, M., Herdiyeni, Y., Haditjaroko, L. (2016). Method and approach mapping for agri-food supply chain risk management: A literature review. International Journal of Supply Chain Management, 5(2): 51-64.
[18] Sriwana, I.K., Arkeman, Y., Syah, D., Marimin. (2017). Sustainability improvement in cacao supply chain agro-industry. World Review of Science, Technology and Sustainable Development, 13(3): 256-275. https://doi.org/10.1504/WRSTSD.2017.087154
[19] Saxena, J.P., Vrat, P. (1992). Hierarchy and classification of program plan elements using interpretive structural modeling: a case study of energy conservation in the Indian cement industry. Systems practice, 5: 651-670. https://doi.org/10.1007/BF01083616
[20] Sofiyessi, E. (2020). The shallot agro-industrial cluster based on regional characteristic with soft system methodology approach: A conceptual design. In IOP Conference Series: Earth and Environmental Science, 443(1): 012058. https://doi.org/10.1088/1755-1315/443/1/012058
[21] Eriyatno, P.D. (2013). Ilmu Sistem. Pertama. Jakarta: Guna Widya.
[22] Djatna, T., Asrol, M., Papilo, P., Taufik, B., Darmawan, M.A. (2020). Supply chain performance measurement and improvement of palm oil agroindustry: A case study at Riau and Jambi Province. In IOP Conference Series: Earth and Environmental Science, 443(1): 012056. https://doi.org/10.1088/1755-1315/443/1/012056
[23] Pitcher, T.J. dan Preikshot, P. (2001). RAPFISH: A rapid appraisal techniques to evaluated sustainability status of fisheries. Journal of Fisheries Research, 49: 255-270.
[24] Fauzi, A., Anna, S. (2002). Evaluasi status keberlanjutan pembangunan perikanan: aplikasi pendekatan Rapfish. Jurnal Jurusan Sosial Ekonomi Perikanan FPIK IPB, 4(3): 43-55.
[25] Fauzi, A. (2019). Teknik Analisis Keberlanjutan. Jakarta (ID): Gramedia Pustaka Utama. ISBN/ISSN 978-602-06-3025-0
[26] Houshyar, E., SheikhDavoodi, M.J., Almassi, M., Bahrami, H., Azadi, H., Omidi, M., Sayyad, G., Witlox, F. (2014). Silage corn production in conventional and conservation tillage systems. Part I: Sustainability analysis using combination of GIS/AHP and multi-fuzzy modeling. Ecological Indicators, 39: 102-114. https://doi.org/10.1016/j.ecolind.2013.12.002
[27] Anand, A., Bansal, G. (2017). Interpretive structural modelling for attributes of software quality. Journal of Advances in Management Research, 14(3): 256-269. https://doi.org/10.1108/JAMR-11-2016-0097
[28] Teniwut, Y.K., Marimin, M., Indrasti, N.S. (2017). Spatial intelligent decision support system for increasing productivity on natural rubber agroindustry by green productivity approach. International Journal of Productivity and Performance Management, 66(6): 742-765. https://doi.org/10.1108/IJPPM-01-2016-0005/full/html
[29] Shoffiyati, P., Noer, M., Syahni, R., Asrinaldi. (2019). Performance analysis of kakao agroindusry suplly chain in lima puluh kota regency, West Sumatra Province. Jurnal Teknologi Industri Pertanian, 29(1): 27-33. https://doi.org/10.24961/j.tek.ind.pert.2019.29.1.27
[30] Mitroff, I.I., Mason, R.O. (1983). Can we design systems for managing messes? or, why so many management information systems are uniformative. Accounting, Organizations and Society, 8(2-3): 195-203. https://doi.org/10.1016/0361-3682(83)90027-2
[31] Mason, R.O., Mitroff, I.I. (1981). Challenging strategic planning assumptions. Administrative Science, 18: 246-276. https://doi.org/10.1177/017084068400500106
[32] Vachon, S., Klassen, R.D. (2006). Extending green practices across the supply chain: the impact of upstream and downstream integration. International Journal of Operations & Production Management, 26(7): 795-821. https://doi.org/10.1108/01443570610672248