Siska Amelia*![]() | Guswandi
| Guswandi![]()
© 2023 IIETA. This article is published by IIETA and is licensed under the CC BY 4.0 license (http://creativecommons.org/licenses/by/4.0/).
OPEN ACCESS
The rapid development of urban areas is one of the driving factors for hazard exposure which causes vulnerability and environmental degradation. Environmental degradation causes vulnerability to disasters which will have implications for a decrease in economic benefits and an increase in community poverty. Landslides and floods are frequent natural disasters that cause environmental degradation. To reduce the risk of landslides and floods and formulate development policies and strategies in disaster-prone areas is necessary to identify landslides and flood areas. This study aims to identify and detect areas prone to landslides and floods in Metropolitan Palapa using GIS analysis and Moran's Local Index based on LISA statistics. The analysis results show that the northern to northeastern areas of Metropolitan Palapa (Pariaman regency and Pariaman municipal) are areas with high vulnerability to landslides, with high positive spatial associations of landslide occurrence and intensity. The area has an altitude between 350 to >1100 above sea level and a slope between 15 to >45%. Meanwhile, Padang and Pariaman municipal are areas that are vulnerable to flood hazards, and this is because these areas are lowlands/coastal areas. We can implement strategies and policies for the Palapa Metropolitan area, including a) limiting development in the northern region, b) applying engineering to areas prone to landslides by applying cut and fill techniques, c) improvement of drainage systems in areas prone to flooding; d) increase public awareness to care and provide incentives to people who care about the environment. Appropriate strategies and policies will reduce environmental degradation. We required disaster-based development planning to reduce environmental degradation, but the data is often an obstacle.
regional development, regional economy, spatial analysis, LISA statistics, environmental degradation
Rapid development in urban areas is one of the factors causing damage and environmental degradation. Urban economic development is one of the engines of danger worldwide that causes urban vulnerability [1, 2]. Vulnerability will occur because urban areas are the centre of complex economic, socio-cultural, political, institutional and environmental interactions.
Urban environmental degradation occurs due to industrial growth, increased energy consumption [3], economic growth [4], population growth and utilisation of natural resources that cause a decrease in environmental quality [5, 6]. Environmental degradation causes vulnerability to disasters [7]. Ecological degradation has implications for reducing economic benefits [8] and increasing poverty, especially in developing countries [9]. Urban environmental problems are a threat to people's welfare and hinder the realisation of sustainable development [10].
Metropolitan Palapa is a strategic economic area with three administrative regions: Padang Pariaman regency, Padang municipal and Pariaman municipal. The Palapa Metropolitan administrative area consists of 32 sub-districts and 235 urban villages/nagari with the potential to be developed for trade and services, industry and tourism. A strategic area is an economic area with the potential to have a significant dual effect across sectors, regions and actors [11]. Strategic economic areas are prioritised for development [12] and have characteristics that distinguish them from the other regions [13].
The urban area in Metropolitan Palapa has developed mainly by converting land use from agricultural land to urban use, especially in urban areas. Metropolitan Palapa will continue developing with various activities as a functional area. The diversity of development activities and economic interests impacts the decline in the environment's carrying capacity [1, 14].
According to the National Disaster Management Agency (BNPB), for the past ten years (2011-2021), floods and landslides have been disasters that have frequently occurred in Indonesia. Landslides and floods represent 47% to 67% of the total disasters. The average incidence of floods reaches 30%, and landslides are 25% of the total disasters. Data for 2022 shows that the incidence of floods and landslides in Indonesia from January to August is 39% for floods and 18% for landslides.
A landslide is the movement of masses of rock, debris or soil down a slope due to the influence of gravity [15, 16]. According to Cruden and Varnes [16], the trigger for landslides is external stimuli such as high rainfall, earthquakes, changes in water levels, storms, or river erosion which causes a decrease in the strength of the slope-forming material. In addition, other factors that trigger landslides are increased human activity, population increase, urbanisation, and development in areas with high soil vulnerability.
Floods are natural disasters when overflowing rivers, lakes, and oceans inundate land caused by high rainfall. A flood is an overflow of water that submerges land and is a catastrophe for life and property that affects the environment around the world [17]. Flood is a natural disaster that is quite dangerous because it causes negative moral and material consequences [18] for human health and life, the environment, cultural heritage, economic activity and infrastructure [19, 20].
Heavy rainfall causes rivers and seas to overflow and can occur at any time of the year. Climate change will also cause sea level rise and increase the danger of flooding, especially in coastal areas [21]. Population growth and improvement of the built environment also significantly increase the risk of flooding. Apart from that, other things that can increase the risk of flooding are the shape of the land, elevation, land cover, population density and accessibility [22].
Rapid development and increasing environmental damage will cause disasters like landslides and floods. These natural disasters will become an essential issue in sustainable urban ecological management. As a result, it is necessary to identify locations prone to landslides and floods to plan appropriate disaster prevention [21-23]. This study aims to identify the spatiotemporal distribution pattern and spatial clustering of areas prone to landslides and floods in Metropolitan Palapa using Moran's Index based on Local Indicators of Spatial Association (LISA) statistics.
Mapping disaster-prone areas will assist local governments in reducing environmental degradation by making policies and strategies [24]. Among the strategies and policies that we can be implemented are establishing cooperation with areas around disaster-prone areas [10], increasing community innovation in reducing environmental degradation [25], strengthening natural resource management strategies, increasing literacy communities, and increasing community involvement [26], maintaining the presence of woody vegetation and grasslands [27].
2.1 Study areas
The Study Area is located in the Palapa Metropolitan Area of West Sumatra Province, Indonesia, which consists of three regencies/cities (Figure 1). The height of the Palapa Metropolitan area varies from 0-1,650 meters above sea level. Most of the area is at an altitude of 0-200 meters above sea level (Figure 2). The land use of most of the Palapa Metropolitan area is agricultural land, with a population of between 303-34,825 people in 2021, with rainfall ranging from 228,000-398,000 millimetres per year.
The Palapa metropolitan area, which consists of three regency/municipal, 32 sub-districts and 235 urban villages and nagari, had a population of 1,437,354 people in 2021 (Figure 2a). Nagari is the division of administrative areas after sub-districts in the province of West Sumatra. The highest population is in Kuranji urban village, Padang municipal, at 34,825 people, and the area with the lowest population is in Pasir Sanur, Pariaman municipal, at 303 people. The land use of most of the Palapa Metropolitan area is agricultural land consisting of dry land agriculture and rice fields, followed by forest consisting of primary dry land forest and secondary dry land forest (Figure 2b). The slope of the Palapa Metropolitan area varies from 0 to>45%. Areas with a slope of 0 – 15% are in the coastal area, and areas with a slope of 25 to greater than 45% are in the northeast and southeast (Figure 2c). The area's altitude varies widely between 0 – 1392 above sea level (Figure 2d). Annual rainfall in the Palapa Metropolitan area is relatively high. Areas with very high rain are north and northeast (Figure 2e).
Figure 1. Palapa Metropolitan Location Map
Figure 2. Metropolitan Palapa thematic map a) population, b) land use, c) slope, d) elevation, e) rainfall
2.2 Data and method
The data is on the number of landslides and floods in each village. Data were obtained from PODES (Village Potential Statistics) from 2011 to 2018 and data from the Central Bureau of Statistics (BPS) for 2021. We made the map for the distribution of landslides and floods based on the number of landslides and floods in 2011, 2015, 2017, and 2021. The unit of analysis in this study is the village level.
We used GIS analysis and Moran's Local Index based on LISA statistics to see the spatiotemporal distribution pattern and identify the spatial clustering of landslide and flood-prone areas. Local Moran Index analysis based on LISA statistics using Geographic Data Analysis (Geoda) software
The approach used in Moran's Index is a spatial autocorrelation approach [28, 29]. A positive autocorrelation will indicate that adjacent locations have similar values and tend to cluster. Negative autocorrelation indicates that adjacent areas have different values and tend to spread. The Moran Index (global index) clustering method will provide a single statistic that summarises the spatial pattern of the research area. Moran's index is used to determine whether there is a spatial relationship in an event [30-32].
The local clustering technique is carried out by examining a particular sub-region or environment in the study to determine whether the area represents a group of high values (hot spots) or low values (cold spots) [33], using the Local Indicator of Spatial Autocorrelation (LISA) [34].
This study uses the local Moran Index approach, a local spatial autocorrelation measurement based on Moran's I developed by Anselin [35] as LISA statistics [36]. LISA statistics have two characteristics: 1) each observation indicates the extent to which the spatial clustering has a significant value, and 2) the number of LISA for all observations is proportional to the global indicator of spatial association. Global spatial association shows the presence or absence of a relationship in a single event. Local spatial associations indicate the location of local clusters and spatial outliers. We can identify spatial clusters of areas, landslides and floods using the Moran Index and LISA methods.
$I=\frac{1}{S_0} \frac{\sum_{i=1}^n \sum_{j=1}^n W_{i j}\left(x_i-\bar{x}\right)\left(x_j-\bar{x}\right)}{S_x{ }^2} \ i \neq j$
where,
$S_0=\sum_{i=1}^n \sum_{j=1}^n W_{i j}$
$I i=\frac{\sum_{j=1}^n W_{i j} \left(x_i-\bar{x}\right)\left(x_j-\bar{x}\right)}{\sum_{j=1}^n W_{i j} S_x^2}$
$=\left(x_i-\bar{x}\right) \frac{\sum_{j=1}^n W_{i j}\left(x_j-\bar{x}\right)}{\sum_{j=1}^n W_{i j} S_x^2}$
$=\left(x_i-\bar{x}\right) \sum_{j=1}^n \frac{W_{i j}\left(x_j-\bar{x}\right)}{W_{i j} S_x^2}$
where:
I = Moran's Global Index
ii = Moran's Local Index
$x_i$ = value of interest of variable x for point i
$x_j$ = value of interest of variable x for point j
$\bar{\chi}$ = average value of x
$W_{i j}$ = continuity matrix, representing the proximity of point i's and point j's locations, with Wii = 0 for all points
n = total number of points
$S_x^2$ = variance of the observed values
The data used in the analysis is the number of floods and landslides in 2011, 2015, 2017 and 2021. Analysis of Moran's Local Index will identify the spatial clustering of areas prone to landslides and floods. Spatial clustering of the flood-prone regions will appear if the spatial association (SA) is positive with high-high (HH) or low-low (LL) types and negative values (spatial outliers) with high-low (HL) or low-high types. (LH). A positive spatial association (SA) will appear if a high value is correlated with a high-value neighbour or a low value is correlated with a low-value neighbour.
Conversely, a negative spatial association (SA) will appear when a high value correlates with a low neighbour value or a low value correlates with a high-value neighbor [33, 35]. In this study, queen contiguity will be used as a spatial weighting method to detect the spatial association of landslides and floods in Metropolitan Palapa. Queen contiguity weighting is the touch of both sides and vertex points of one region to another [33].
According to Law number 26 of 2007 concerning spatial planning, an area is a geographical unit and all related elements whose boundaries and systems are determined based on administrative and/or functional aspects. Based on typology and regional classification consisting of homogeneous areas, nodal areas, planning areas, metropolitan regions, development axes, frontier regions and depressed regions [37, 38]. We developed Metropolitan Palapa as a planning area into a metropolitan area. It is essential to look at the definition of the region, typology, and regional classification to see development strategies, policies and programs related to regional development [37, 39].
The geographical position of West Sumatra Province, especially the Palapa Metropolitan area, and community activities will lead to environmental degradation, creating vulnerability to disasters, especially landslides and floods. Areas with high exposure to disasters will hinder sustainable development goals [10]. The overexploitation of natural resources can also cause environmental degradation and vulnerability to landslides and floods. Results of research conducted by Shahbaz et al. [40] and Bai et al. [41] show that the inefficient use of energy resources harms environmental quality. The development of energy-efficient technologies at production and consumption levels will significantly help reduce environmental degradation and increase productivity in the long term. In addition, the cooperation of the banking sector is also needed to provide credit relief to the energy sector and allocate funding for environmentally friendly business activities.
Çakar et al. [27] researched the relationship between human resources to environmental degradation in the European Union. The results show that human resources can reduce carbon emission levels in low-growth activities but increase carbon emissions in high-growth activities. Reducing environmental degradation is necessary to improve human resources to innovate to protect the environment.
The results of previous studies show a two-way relationship between regional growth and the environment. The results show that the level of environmental degradation and economic growth has a U-shaped relationship known as the Kuznets Curve in the long run [42, 40]. Development is associated with reduced environmental degradation to some extent. After this threshold, increased development will increase environmental degradation.
In this study, we observe the relationship between development and environmental degradation in the Palapa Metropolitan area. Landslides and floods were chosen as representatives of natural disaster hazards and are proxies for environmental degradation. The Palapa Metropolitan Area is a planning area that has been developed into a metropolitan area in West Sumatra Province. In preparing the development plan for the area, the government and the community should pay attention to reducing environmental degradation.
Regarding regional topography, the Palapa Metropolitan Area is at various altitudes and slopes, so the area is prone to landslides and floods. Population growth and rapid development are also the causes of degradation in the Palapa Metropolitan area. So it is essential to identify areas vulnerable to landslides and floods [22, 23]. Identification of landslide and flood areas will assist the government in making appropriate policies and strategies to reduce environmental degradation [42, 43].
3.1 Spatiotemporal distribution patterns of landslides and floods
Natural disasters are complex events and pose risks to landscape changes that cause harm to the environment, economic activities and public health [19, 44]. Landslides and floods are frequent natural disasters that cause significant losses to human life and livelihoods. Increased human activities and development further exacerbate the factors that cause landslides and floods. Landslides and floods will cause environmental degradation in the long term.
The making of landslide and flood maps needs to be done to see the extent of the landslide and flood phenomena in an area and to know the spatial distribution pattern of landslide and flood events. The landslide and flood map will be able to be developed to determine the landslide and flood zone areas and the vulnerability and risk of landslides and floods. Landslide and flood zone maps will be handy in spatial planning by local governments to formulate development policies and strategies.
Figure 3. Distribution pattern of landslide in 2011, 2015, 2017 and 2021
Figure 3 shows the distribution pattern of landslides in Metropolitan Palapa in 2022, 2015, 2017 and 2021. The landslide disasters show that the number of urban villages/nagari and the area of landslides has increased and spread widely from 2011 to 2021. In 2021 most of the landslides occurred in the eastern part of the Palapa Metropolitan area. The eastern part of Metropolitan Palapa is a highland region. This area is an area with an altitude between 350 ->1100 above sea level (Figure 2d) and is on a slope of between 15 ->45% (Figure 2c), with rainfall between 227.085 to 397.806 millimetres/year (Figure 2e). The number of urban villages/nagari experiencing landslides has increased.
The complex morphology of the area causes landslides [45] at Metropolitan Palapa. The slope and altitude of the area are factors that cause landslides [46, 47]. The slope of the Palapa Metropolitan area ranges from 00 to >450, and the altitude is between 350 to >1100 masl. Areas with slopes above 150 and elevations>350 meters above sea level are in the northern to southeastern regions of Metropolitan Palapa. These areas are areas with high soil vulnerability, so landslides often occur.
The diverse topography of the Palapa Metropolitan area is exacerbated by high enough rainfall, causing landslides [48, 49]. The rain in the Palapa Metropolitan area ranges from 225,000 to >400,000 millimetres per year. The northern to eastern regions have high rainfall ranging from 320.00 to 400.000 millimetres per year. High rain will cause softening of strength and reduce slope stability, causing weakened soil cohesion [50]. Population and population density, as well as human activities, are also the causes of landslides [51]. The construction of the road network and the cutting of hilly areas are also the causes of landslides [48].
The landslide disaster in the Palapa Metropolitan area has caused a significant loss of property and life. Landslides have buried many people's houses and cut off road access. As has happened in the Sungai Sirah Kuranji Hulu urban village, Sungai Geringging sub-district, Padang Pariaman Regency, which has isolated 78 heads of families because of the material blocking the road as high as 2 meters. The landslide in Nagari Pasie Laweh, Lubuk Alung sub-district, Padang Pariaman Regency, also claimed seven lives. Losses reduce landslides; it is necessary to zone landslide-prone areas and evaluate landslide hazards [52]. The zoning of the landslide-prone regions can practically be applied to regional and infrastructure development planning in the Palapa Metropolitan area.
Figure 4. Distribution pattern of flood in 2011, 2015, 2017 and 2021
Figure 4 shows the distribution pattern of flooding in Metropolitan Palapa in 2011, 2015, 2017 and 2021. Flood disasters also show that the number of villages and areas affected by floods has increased from 2011 to 2021. Flood areas in 2011 and 2015 generally occurred in plain areas low in 2017 and 2021, spreading to the highlands. Flood events have increased; in 2011, the flooded areas were 29 urban villages/nagari increasing to 52 urban villages/nagari in 2015, rising to 94 urban villages/nagari in 2017, and becoming 196 urban villages/nagari in 2021.
The floods in the Palapa Metropolitan area caused losses to property and lives. Floods and landslides in October 2021 in Padang resulted in 8 sub-districts being affected, with water levels reaching 150 cm. The floods submerged 350 houses, 418 residents were evacuated, and two road points were affected by landslide materials. Floods in the Koto Tangah sub-district, Padang municipal, resulted in 1 person's death and two people being declared missing. Floods in Banda Gadang and Gurun Laweh urban villages, Nanggalo sub-district, Padang municipal, with a height of 200 cm. The flood that hit the Sungai Limau sub-district damaged the Belimbing River Dam. In September 2021, floods and landslides killed four people in Padang Pariaman Regency. Floods in Padang Pariaman Regency impact ten sub-districts with water levels between 75 to 200 cm. In addition to the fatalities damaged, 338 housing units, 80 hectares of agricultural land, one unit of public facilities, and one unit of educational facilities. Floods in Ulakan Tapakis sub-district, with water levels reaching 100 to 150 cm, damaged 70 houses and 17 hectares of rice fields.
Floods that occurred in the Palapa Metropolitan area were caused by high rainfall intensity. In addition to the intensity of rainfall, flooding can also be caused by land use and land cover [27], population growth and development activities [21], elevation and slope of the area, as well as drainage density [53]. The high intensity of rainfall and climate change are causing rivers to overflow and sea levels to rise, especially in coastal areas [54]. Parts of the southwest to northwest Palapa Metropolitan area are low-lying coastal areas prone to flooding [22]. Climate change causes the generation and distribution of storm waves, which has implications for the danger of flooding in coastal areas [21]. The human factor and lack of human concern for the environment further exacerbate flooding [55].
Floods are natural disasters that often occur in the Palapa Metropolitan area and the world, so it is necessary to identify and map flood-prone locations [56] to determine mitigation measures to prevent flood hazards [57]. Mapping flood-prone areas are needed to plan safety measures for both property and lives when a flood occurs. In addition, to carry out evacuation and planning shelter areas [22]. Mapping the flood area in the Palapa Metropolitan area will help the local government plan a development strategy and a strategy for building shelters.
The government can implement strategies to reduce the risk of flooding, including maintaining many perennials and grassland vegetation and providing early flood warnings [27]. It is no less important to increase public awareness of the environment. Local governments incentivise communities or groups of people who care about the environment [58].
3.2 Spatial clustering of areas prone to landslides and floods
The spatial clustering of areas prone to landslides and flooding in Metropolitan Palapa was carried out using the LISA method using the Local Moran Index. LISA statistical method, according to Asselin [35], serves two purposes. The first objective is to indicate the extent to which spatial areas have significant value as local indicators or hot spots. The second goal of LISA statistics is to see the effect of individual locations on global statistics and identify outliers. LISA statistics are handy for viewing spatial scrambling and identifying local hotspots. We used a randomisation approach to generate references for statistical significance values.
See the spatial clustering of the Palapa Metropolitan area as the number of landslides and floods in 2021 (Figure 5). The landslide and flood clustering maps resulting from the LISA analysis can be seen in Figures 6 and 7. Observations were made of 235 urban villages and nagari in Metropolitan Palapa.
The LISA clustering map is a map that identifies significant spatial relationships and their outliers. At the same time, the LISA significance map is a map of the significance level for each object that is interconnected with a p-value of 0.05, 0.01 and 0.001. An outlier is an area that has the opposite value to the surrounding area. The spatial relationship on the LISA clustering map consists of 1) not significant, which is an area that is not significant at the 0.05 standard quasi-significance level); 2) aloft hot spots are areas of high value surrounded by high and significant values; 3) low-low cold spots are areas that have low values surrounded by low and significant values; 4) low-high outliers are areas that have low values surrounded by high and significant values;
The results of LISA analysis using the Local Moran Index can be used to identify the spatial classification of landslides and floods in Metropolitan Palapa. Each index has a statistical test, so we can map areas with a statistically significant relationship with their neighbours and see the type of relationship.
Figure 5. Spatial distribution of landslides and floods in 2021
Figure 6. LISA cluster map and landslide significance map for 2021
Figure 5 shows the distribution of landslide and flood events in 2021 based on the number of flood events in each urban village and nagari. Figures 6 and 7 show the LISA clustering map and the landslide and flood significance map for 2021. The areas in red are hot spots representing the height-height group (HH); we can call it a positive spatial association of HH. That means that urban villages/nagari with a high incidence of landslides and floods are adjacent to areas with a high incidence of landslides and floods. The analysis results show that areas with a positive HH association with landslides are in the north and northeast of Metropolitan Palapa. Most of these areas are located in Padang Pariaman Regency and Pariaman municipal, significantly in 18 urban villages/nagari (Figure 6).
The areas in blue are cold spots representing the low-low (LL) group, and we can call it the LL positive spatial association. That means urban villages/nagari with a low incidence of landslides and floods are surrounded by areas with low incidence. The analysis results show that the landslide areas with positive spatial associations LL are located in the western and southern parts of Metropolitan Palapa (Pariaman municipal and Padang municipal) and are significant in 50 urban villages/nagari (Figure 6). Meanwhile, the positive association of LL in flood-prone areas from the west to the south of Metropolitan Palapa (Padang Pariaman regency, Pariaman municipal and Padang municipal) is significant in 9 urban villages/nagari.
Regions in purple are outliers representing the low-high (LH) group, which we call the LH negative association (Figure 7). Areas with negative associations (outliers) mean that the value representing the number of landslides and floods differs from the value representing the number of landslides and/or flooding from neighbouring areas. The negative association of LH means that areas surround areas with low landslide and flood events with high incidence. The analysis results show that the hostile association areas for landslides are in the north, northeast, southwest, the south of Metropolitan Palapa (Padang Pariaman regency, Pariaman municipal and Padang municipal) and are significant in 12 urban villages/nagari (Figure 6). Negative associations for flood LH are in the western and southern parts of Metropolitan Palapa (Pariaman municipal and Padang municipal) (Figure 7).
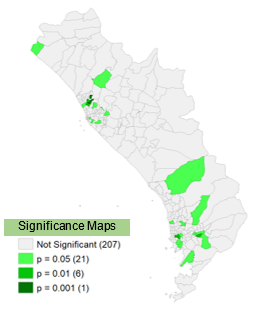
Figure 7. LISA cluster map and flood significance map for 2021
Regions in pink are outliers representing high-low (HL) clusters which we refer to as HL-negative associations. The negative association of HL means that an area surrounds an area with a high number of landslides and floods with a low incidence of landslides and flooding. The analysis results show that the negative association of LH landslides is in the southern part of Metropolitan Palapa (Padang municipal) and is significant in 3 urban villages (Figure 6). The negative association of flood HL was also found in the southern part of Metropolitan Palapa (Padang municipal) and was significant in 2 urban villages (Figure 7).
Figure 8. Spatial autocorrelation of landslide-prone areas
Figure 9. Spatial autocorrelation of flood-prone areas
Based on the significance map, we can see that the positive association of landslides was significant in 42 urban villages/nagari with a p-value of 0.05, significant in 33 urban villages /nagari with a p-value of 0.01, and significant in 8 urban villages/nagari with a p-value of 0.001 (Figure 6). Based on the significance map, we can see that there is a positive association of significant flood HH in 21 urban villages with a p-value of 0.05, significant in 6 urban villages with a p-value of 0.01, and significant in 1 urban village with a p-value of 0.001 (Figure 7).
In this study, apart from looking at the LISA statistics using the Local Moran Index, we can also look at the Global Moran Index to determine the spatial autocorrelation of landslide and flood-prone areas (Figures 8 and 9). Global Moran Index to see if the landslide and flood-prone areas are clustered, random or spread out.
Figures 8 and 9 show the spatial autocorrelation of landslide and flood-prone areas in Metropolitan Palapa. The spatial autocorrelation of the landslide-prone regions shows a Moran Index value of 0.1447 and a z-score of 9.4146, while for flood-prone areas, the Moran Index is 0.704 and a z-score of 4.5568. That means the spatial associations of landslide and flood-prone areas are clustered based on the number of landslides and floods. The existence of clustered landslide and flood-prone areas will make it easier for local governments to create development plans to realise sustainable development and establish strategies to reduce the risk of landslides and floods [10, 47] at Metropolitan Palapa.
The mapping of landslide-prone areas, which are generally located from north to southeast, will provide an overview of development planning in the area. We can implement policies and strategies to limit development in the north and southeast of Metropolitan Palapa. In addition, we propose applying technological engineering in developing the northern to southeastern areas of Metropolitan Palapa. For flood-prone areas grouped from the west to the southwest, the local government can make policies and strategies related to the drainage system.
The rapid development of the urban economy is one of the driving factors for hazard exposure worldwide, which causes vulnerability and environmental degradation [1]. Environmental degradation in an area causes disaster vulnerability, which will have implications for reducing economic benefits and increasing poverty. Landslides and floods are the most frequent natural disasters in Indonesia and throughout the world, which cause environmental degradation. The minimise the risks of floods and landslides, it is necessary to identify areas prone to landslides and floods. Maps of landslide and flood areas will significantly assist the government in implementing project policies and strategies to minimise hazard risks [24].
We identified local spatial associations of landslides and floods in Metropolitan Palapa using LISA statistics. The analysis results show that the area north to northeast of Metropolitan Palapa (Padang Pariaman regency and Pariaman municipal) is a high vulnerability to landslides, with a high positive spatial association of landslide occurrence and intensity. Meanwhile, Padang and Pariaman are areas that are vulnerable to flooding; this is because these areas are lowland/coastal areas. The LISA landslide and flood clustering map can be used as zoning for landslide and flood areas used for spatial planning in Metropolitan Palapa.
Strategies and policies are needed in integrated environmental planning and management to reduce the decline in social and economic benefits due to environmental degradation. Some of these things include: a) strengthening strategies for the use of natural resources that are effective and efficient; b) increasing community participation in environmental management [26]; c) increasing public awareness to care for the environment [55]; d) establishing inter-regional cooperation [10]; e) increasing community innovation [25]; f) strengthening environmental management institutions and implementing an integrated watershed approach for flood management [53]; g) maintaining the presence of woody vegetation and grasslands as well as disaster early warning [27]; h) provide incentives to communities and community groups concerned with the environment [58].
Strategies and policies we can be implemented for the Palapa Metropolitan area include: a) limiting development in the northern region; b) applying engineering to areas prone to landslides by applying cut and fill techniques; c) improvement of drainage systems in areas prone to flooding; d) increase public awareness to care and provide incentives to people who care about the environment.
[1] Eakin, H., Keele, S., Lueck, V. (2022). Uncomfortable knowledge: Mechanisms of urban development in adaptation governance. World Development, 159: 106056. https://doi.org/10.1016/j.worlddev.2022.106056
[2] McHale, M.R., Pickett, S.T., Barbosa, O., Bunn, D.N., Cadenasso, M.L., Childers, D.L., Gartin, M., Hess, G.R., Iwaniec, D.M., McPhearson, T., Peterson, M.N., Poole, A.K., Rivers, L., Shutters, S.T., Zhou, W. (2015). The new global urban realm: Complex, connected, diffuse, and diverse social-ecological systems. Sustainability, 7(5): 5211-5240. https://doi.org/10.3390/su7055211
[3] Kahouli, B., Miled, K., Aloui, Z. (2022). Do energy consumption, urbanization, and industrialization play a role in environmental degradation in the case of Saudi Arabia?. Energy Strategy Reviews, 40: 100814. https://doi.org/10.1016/j.esr.2022.100814
[4] Pandey, K.K., Rastogi, H. (2019). Effect of energy consumption & economic growth on environmental degradation in India: A time series modelling. Energy Procedia, 158: 4232-4237. https://doi.org/10.1016/j.egypro.2019.01.804
[5] Burki, U., Tahir, M. (2022). Determinants of environmental degradation: Evidenced-based insights from ASEAN economies. Journal of Environmental Management, 306: 114506. https://doi.org/10.1016/j.jenvman.2022.114506
[6] Capps, K.A., Bentsen, C.N., Ramírez, A. (2016). Poverty, urbanisation, and environmental degradation: Urban streams in the developing world. Freshwater Science, 35(1): 429-435.
[7] Ananda, J., Herath, G. (2003). Soil erosion in developing countries: A socio-economic appraisal. Journal of Environmental Management, 68(4): 343-353. https://doi.org/10.1016/S0301-4797(03)00082-3
[8] Hoagland, P., Kite-Powell, H.L., Jin, D., Solow, A.R. (2013). Supply-side approaches to the economic valuation of coastal and marine habitat in the Red Sea. Journal of King Saud University-Science, 25(3): 217-228. https://doi.org/10.1016/j.jksus.2013.02.006
[9] Burki, M.A.K., Burki, U., Najam, U. (2021). Environmental degradation and poverty: A bibliometric review. Regional Sustainability, 2(4): 324-336. https://doi.org/10.1016/j.regsus.2022.01.001
[10] Majeed, M.T., Mazhar, M. (2021). An empirical analysis of output volatility and environmental degradation: A spatial panel data approach. Environmental and Sustainability Indicators, 10: 100104. https://doi.org/10.1016/j.indic.2021.100104
[11] Shalih, O. (2014). Kajian Evaluasi Program Pembangunan Dan Pengembangan Kawasan Khusus Dan Daerah Tertinggal. http://dx.doi.org/10.13140/RG.2.2.13190.22080
[12] Sosnovskikh, S. (2017). Industrial clusters in Russia: The development of special economic zones and industrial parks. Russian Journal of Economics, 3(2): 174-199. https://doi.org/10.1016/j.ruje.2017.06.004
[13] Komarovskiy, V., Bondaruk, V. (2013). The role of the concept of “growth poles” for regional development. Journal of Public Administration, Finance and Law, 4(4): 31-42.
[14] Rustiadi, E., Pribadi, D.O., Pravitasari, A.E., Indraprahasta, G.S., Iman, L.S. (2015). Jabodetabek megacity: From city development toward urban complex management system. In: Singh, R. (eds) Urban Development Challenges, Risks and Resilience in Asian Mega Cities. Advances in Geographical and Environmental Sciences. Springer, Tokyo. https://doi.org/10.1007/978-4-431-55043-3_22
[15] Arsyad, S. (2009). Konservasi Tanah dan Air. Pt Penerbit Ipb Press.
[16] Cruden, D.M., Varnes, D.J. (1996). Landslide types and processes. Special Report - National Research Council, Transportation Research Board, 247: 36-75.
[17] Maskong, H., Jothityangkoon, C., Hirunteeyakul, C. (2019). Flood hazard mapping using on-site surveyed flood map, Hecras V. 5 and GIS tool: A case study of Nakhon Ratchasima Municipality, Thailand. GEOMATE Journal, 16(54): 1-8.
[18] Araújo, P.V.N., Amaro, V.E., Silva, R.M., Lopes, A.B. (2019). Delimitation of flood areas based on a calibrated a DEM and geoprocessing: Case study on the Uruguay River, Itaqui, southern Brazil. Natural Hazards and Earth System Sciences, 19(1): 237-250. https://doi.org/10.5194/nhess-19-237-2019
[19] Perz, A., Wrzesiński, D., Sobkowiak, L., Stodolak, R. (2022). Copula-based geohazard assessment–case of flood-prone area in Poland. Journal of Hydrology: Regional Studies, 44: 101214. https://doi.org/10.1016/j.ejrh.2022.101214
[20] Rutgersson, A., Kjellström, E., Haapala, J., Stendel, M., Danilovich, I., Drews, M., Jylhä, K., Kujala, P., Guo Larsén, X., Halsnæs, K., Lehtonen, I., Luomaranta, A., Nilsson, E., Olsson, T., Särkkä, J., Tuomi, L., Wasmund, N. (2022). Natural hazards and extreme events in the Baltic Sea region. Earth System Dynamics, 13(1): 251-301. https://doi.org/10.5194/esd-13-251-2022
[21] Mayo, T.L., Lin, N. (2022). Climate change impacts to the coastal flood hazard in the northeastern United States. Weather and Climate Extremes, 36: 100453. https://doi.org/10.1016/j.wace.2022.100453
[22] Uddin, K., Matin, M.A. (2021). Potential flood hazard zonation and flood shelter suitability mapping for disaster risk mitigation in Bangladesh using geospatial technology. Progress in Disaster Science, 11: 100185. https://doi.org/10.1016/j.pdisas.2021.100185
[23] Edamo, M.L., Ukumo, T.Y., Lohani, T.K., Ayana, M.T., Ayele, M.A., Mada, Z.M., Abdi, D.M. (2022). A comparative assessment of multi-criteria decision-making analysis and machine learning methods for flood susceptibility mapping and socio-economic impacts on flood risk in Abela-Abaya floodplain of Ethiopia. Environmental Challenges, 9: 100629. https://doi.org/10.1016/j.envc.2022.100629
[24] Islam, M.T., Meng, Q. (2022). An exploratory study of Sentinel-1 SAR for rapid urban flood mapping on Google Earth Engine. International Journal of Applied Earth Observation and Geoinformation, 113: 103002. https://doi.org/10.1016/j.jag.2022.103002
[25] Xiao, Y., Tang, X., Li, Y., Huang, H., An, B.W. (2022). Social vulnerability assessment of landslide disaster based on improved TOPSIS method: Case study of eleven small towns in China. Ecological Indicators, 143: 109316. https://doi.org/10.1016/j.ecolind.2022.109316
[26] Kahal, A.Y., Abdelrahman, K., Alfaifi, H.J., Yahya, M.M. (2021). Landslide hazard assessment of the Neom promising city, northwestern Saudi Arabia: An integrated approach. Journal of King Saud University-Science, 33(2): 101279. https://doi.org/10.1016/j.jksus.2020.101279
[27] Çakar, N.D., Gedikli, A., Erdoğan, S., Yıldırım, D.Ç. (2021). Exploring the nexus between human capital and environmental degradation: The case of EU countries. Journal of Environmental Management, 295: 113057. https://doi.org/10.1016/j.jenvman.2021.113057
[28] Pham, N.T.T., Nong, D., Sathyan, A.R., Garschagen, M. (2020). Vulnerability assessment of households to flash floods and landslides in the poor upland regions of Vietnam. Climate Risk Management, 28: 100215. https://doi.org/10.1016/j.crm.2020.100215
[29] Pabi, O., Egyir, S., Attua, E.M. (2021). Flood hazard response to scenarios of rainfall dynamics and land use and land cover change in an urbanized river basin in Accra, Ghana. City and Environment Interactions, 12: 100075. https://doi.org/10.1016/j.cacint.2021.100075
[30] Gelaw, Y.A., Magalhães, R.J.S., Assefa, Y., Williams, G. (2019). Spatial clustering and socio-demographic determinants of HIV infection in Ethiopia, 2015–2017. International Journal of Infectious Diseases, 82: 33-39. https://doi.org/10.1016/j.ijid.2019.02.046
[31] Di, W.A.N.G., Zhou, Q.B., Peng, Y.A.N.G., Chen, Z.X. (2018). Design of a spatial sampling scheme considering the spatial autocorrelation of crop acreage included in the sampling units. Journal of Integrative Agriculture, 17(9): 2096-2106. https://doi.org/10.1016/S2095-3119(17)61882-3
[32] Kurnia, A.A., Rustiadi, E., Pravitasari, A.E. (2019). Cluster analysis and spatial pattern approaches in identifying development pattern of Bodebek region, West Java. In Sixth International Symposium on LAPAN-IPB Satellite, 11372: 103-112. https://doi.org/10.1117/12.2541834
[33] Oliver, M.A. (2010). The Variogram and Kriging. In: Fischer, M., Getis, A. (eds) Handbook of Applied Spatial Analysis. Springer, Berlin, Heidelberg. https://doi.org/10.1007/978-3-642-03647-7_17
[34] Saputro, D.R.S., Widyaningsih, P., Kurdi, N.A., Hardanti, S.A. (2017). Local Indicator of Spatial Association (LISA) cluster map untuk identifikasi penyebaran dan pemetaan penyakit Demam Berdarah Dengue (Dbd) di Jawa Tengah. Program Studi Matematika FMIPA UNS.
[35] Anselin, L. (1995). Local indicators of spatial association—LISA. Geographical Analysis, 27(2): 93-115. https://doi.org/10.1111/j.1538-4632.1995.tb00338.x
[36] Pravitasari, A.E., Saizen, I., Tsutsumida, N., Rustiadi, E. (2014). Detection of spatial clusters of flood-and landslide-prone areas using Local Moran Index in Jabodetabek metropolitan area, Indonesia. International Journal of Ecology and Environmental Sciences, 40(4): 233-243.
[37] Rustiadi, E. (2018). Perencanaan dan Pengembangan Wilayah. Yayasan Pustaka Obor Indonesia.
[38] Adisasmita, R. (2018). Dasar-Dasar Ekonomi Wilayah. 2nd ed. Yogyakarta: Expert.
[39] Amelia, S., Rustiadi, E., Barus, B., Juanda, B. (2022). Mapping the diversity of regional characteristics towards sustainable economic strategic area development: A case study of west-east corridor of West Sumatra Province. International Journal of Sustainable Development and Planning, 17(1): 185-193. https://doi.org/10.18280/ijsdp.170118
[40] Shahbaz, M., Shahzad, S.J.H., Ahmad, N., Alam, S. (2016). Financial development and environmental quality: the way forward. Energy Policy, 98: 353-364. https://doi.org/10.1016/j.enpol.2016.09.002
[41] Bai, X., Dawson, R.J., Ürge-Vorsatz, D., Delgado, G.C., Salisu Barau, A., Dhakal, S., Dodman, D., Leonardsen, L., Masson-Delmotte, V., Roberts, D.C., Schultz, S. (2018). Six research priorities for cities and climate change. Nature, 555(7694): 23-25. https://doi.org/10.1038/d41586-018-02409-z
[42] Vo, D.H., Nguyen, N.T., Ho, C.M., Nguyen, T.C. (2021). Does the Kuznets curve apply for financial development and environmental degradation in the Asia-Pacific region?. Heliyon, 7(4): e06708. https://doi.org/10.1016/j.heliyon.2021.e06708
[43] Sarkodie, S.A., Adams, S., Owusu, P.A., Leirvik, T., Ozturk, I. (2020). Mitigating degradation and emissions in China: the role of environmental sustainability, human capital and renewable energy. Science of the Total Environment, 719: 137530. https://doi.org/10.1016/j.scitotenv.2020.137530
[44] UNDRR. Hazard Definition & classification review: Technical Report [Internet]. (2020). Hazard Definition & Classification Reviewazard Definition & Classification Review. Geneva: United Nation, pp. 1-88. Available from: https://www.undrr.org/publication/hazard-definition-and-classification-review, accessed on Jan. 10, 2023.
[45] Li, Y., Utili, S., Milledge, D., Chen, L., Yin, K. (2021). Chasing a complete understanding of the failure mechanisms and potential hazards of the slow moving Liangshuijing landslide. Engineering Geology, 281: 105977. https://doi.org/10.1016/j.enggeo.2020.105977
[46] Panchal, S., Shrivastava, A.K. (2022). Landslide hazard assessment using analytic hierarchy process (AHP): A case study of National Highway 5 in India. Ain Shams Engineering Journal, 13(3): 101626. https://doi.org/10.1016/j.asej.2021.10.021
[47] Qi, W., Xu, C., Xu, X. (2021). AutoGluon: A revolutionary framework for landslide hazard analysis. Natural Hazards Research, 1(3): 103-108. https://doi.org/10.1016/j.nhres.2021.07.002
[48] Pradhan, S., Toll, D.G., Rosser, N.J., Brain, M.J. (2022). An investigation of the combined effect of rainfall and road cut on landsliding. Engineering Geology, 307: 106787. https://doi.org/10.1016/j.enggeo.2022.106787
[49] Alvioli, M., Melillo, M., Guzzetti, F., Rossi, M., Palazzi, E., von Hardenberg, J., Brunetti, M.T., Peruccacci, S. (2018). Implications of climate change on landslide hazard in Central Italy. Science of The Total Environment, 630: 1528-1543. https://doi.org/10.1016/j.scitotenv.2018.02.315
[50] Zhou, D., Zhang, Z., Li, J., Wang, X. (2019). Seepage-stress coupled modeling for rainfall induced loess landslide. Theoretical and Applied Mechanics Letters, 9(1): 7-13. https://doi.org/10.1016/j.taml.2019.02.006
[51] Kamal, A.M., Ahmed, B., Tasnim, S., Sammonds, P. (2022). Assessing rainfall-induced landslide risk in a humanitarian context: The Kutupalong Rohingya Camp in Cox's Bazar, Bangladesh. Natural Hazards Research, 2(3): 230-248. https://doi.org/10.1016/j.nhres.2022.08.006
[52] Asmare, D. (2022). Landslide hazard zonation and evaluation around Debre Markos town, NW Ethiopia—a GIS-based bivariate statistical approach. Scientific African, 15: e01129. https://doi.org/10.1016/j.sciaf.2022.e01129
[53] Ogato, G.S., Bantider, A., Abebe, K., Geneletti, D. (2020). Geographic information system (GIS)-based multicriteria analysis of flooding hazard and risk in Ambo Town and its watershed, West shoa zone, oromia regional State, Ethiopia. Journal of Hydrology: Regional Studies, 27: 100659. https://doi.org/10.1016/j.ejrh.2019.100659
[54] Townend, I.H., French, J.R., Nicholls, R.J., Brown, S., Carpenter, S., Haigh, I.D., Hill, C.T., Lazarus, E., Penning-Rowsell, E.C., Thompson, C.E.L., Tompkins, E.L. (2021). Operationalising coastal resilience to flood and erosion hazard: A demonstration for England. Science of the Total Environment, 783: 146880. https://doi.org/10.1016/j.scitotenv.2021.146880
[55] Oulahen, G. (2021). Flood hazards, environmental rewards, and the social reproduction of risk. Geoforum, 119: 43-51. https://doi.org/10.1016/j.geoforum.2020.12.021
[56] Thapa, S., Shrestha, A., Lamichhane, S., Adhikari, R., Gautam, D. (2020). Catchment-scale flood hazard mapping and flood vulnerability analysis of residential buildings: The case of Khando River in eastern Nepal. Journal of Hydrology: Regional Studies, 30: 100704. https://doi.org/10.1016/j.ejrh.2020.100704
[57] Xafoulis, N., Farsirotou, E., Kotsopoulos, S., Alamanis, N. (2022). Flood hazard assessment in a mountainous river basin in Thessaly, Greece, based on 1D/2D numerical simulation. Energy Nexus, 8: 100142. https://doi.org/10.1016/j.nexus.2022.100142
[58] Entorf, H., Jensen, A. (2020). Willingness-to-pay for hazard safety–A case study on the valuation of flood risk reduction in Germany. Safety Science, 128: 104657. https://doi.org/10.1016/j.ssci.2020.104657