Atiek Iriany*![]() | Agus Dwi Sulistyono
| Agus Dwi Sulistyono![]() | Niken Hendrakusma Wardani
| Niken Hendrakusma Wardani![]() | Jeky Melkianus Sui
| Jeky Melkianus Sui![]() | Danang Ariyanto
| Danang Ariyanto![]()
© 2023 IIETA. This article is published by IIETA and is licensed under the CC BY 4.0 license (http://creativecommons.org/licenses/by/4.0/).
OPEN ACCESS
The spread of COVID-19, apart from being influenced by specific pathogenic factors, is also influenced by population structure and mobility. This study was conducted to develop a forecasting model for the increase in COVID-19 cases due to variations in the holiday calendar and the sun's distance to the earth. This study uses secondary data taken from the East Java Provincial Health Office in collaboration with the East Java Province COVID-19 Task Force. This study uses two independent variables: the Calendar Variation in 2020 and 2021 (X1); The Sun-Earth Distance (X2) and dependent variable (Y) is the Daily Case of COVID-19 in East Java Province from March 2020 to June 2021. The process of data analysis is carried out by analyzing time series data and building a forecasting model with a symbolic time series prognosis approach. The analysis process is carried out using Heuristic Lab 3.3 software. Based on the results of this study, it can be concluded that variations in the holiday calendar and the sun-earth distance have a strong influence on daily cases of COVID-19. The symbolic time series prognosis model obtained has an accuracy rate of up to 90.04% on training data and 82.14% on testing data.
calendar variation, COVID-19, sun distance, symbolic time series prognosis
COVID-19 has now become a pandemic with a dangerous level of spread and severity. Since March 11th, 2020, WHO has declared COVID-19 a global pandemic [1]. The rapid spread of this disease has new confirmed cases outside China, namely in countries in Europe, North America, Asia, and the Middle East [2-4]. WHO inaugurated four scenarios in assessing the spread of COVID-19 at the national level: countries without positive confirmed cases, first confirmed cases, first confirmed clusters, and local transmission countries. Therefore, every country must respond quickly in an emergency, including preparing health infrastructure and mobilizing community social interactions. Indonesia is included in the 4th scenario due to positive confirmed cases in local transmission in several regions [5]. The spread of the COVID-19 pandemic is strongly influenced by the interaction between two main factors, namely the transmission of the pathogen and the characteristics of the human population in the proliferation of the pathogen.
The spread of COVID-19, apart from being influenced by specific pathogenic factors, is also influenced by population structure and population mobility as social vulnerabilities in dealing with disease outbreaks, including population density, poverty, socio-economic activities outside the home, and travel between cities [6]. The COVID-19 pandemic began in Indonesia since the first and second positive confirmed cases were identified on March 3rd, 2020. The first transmission case in Indonesia is estimated to occur around the end of January - early February. It refers to the data on the number of patients with COVID-19 symptoms in several health facilities, the high number of flights to and from Wuhan, and the unavailability of adequate health checks at the airport, so that it is still possible for people without symptoms or those who are still in the incubation period of the virus [7-9].
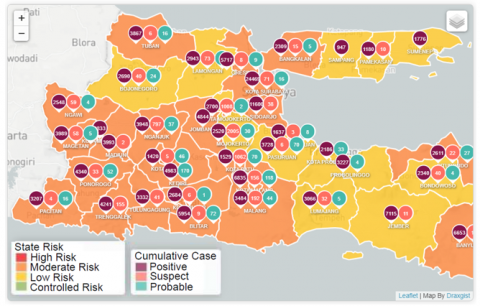
Figure 1. Map of the distribution of COVID-19 in East Java Province on June 14th, 2021
Source: http://infocovid19.jatimprov.go.id/
From Figure 1, it is shown that the spread of COVID-19 cases in East Java Province is still widespread in almost all districts/cities. There are positive confirmed cases in each district/city, with the highest positive confirmed cases found in Surabaya with 24,469 cases. The government has made various efforts to reduce the transmission of COVID-19 with PSBB, and in recent months a policy of eliminating and tightening homecoming and return flow has been implemented. However, it seems that this policy was not heeded by some people, as evidenced by the discovery of homecoming cases in several areas in East Java. Therefore, it is important to find out whether the variation in the number of holidays can affect the number of covid cases that have occurred in East Java.
Research on the effect of community mobility on the increase in COVID-19 cases has been investigated in Turkey, Italy, and Indonesia [6]. Modelling with a geographic information system approach also proves a link between mobility and increased transmission of COVID-19 [8, 10, 11]. Another modelling approach was using transportation models [12], dynamic systems [6], big-data-driven [13], and forecasting with a Spatio-temporal approach [14-16]. Apart from the possible influence of calendar variations on the number of COVID cases, other factors can influence COVID cases such as sun-earth distance. Apart from the mobility factor, we also need to know the natural factors that can affect the number of cases. Therefore, this study was conducted to develop a forecasting model for the increase in COVID-19 cases due to variations in the holiday calendar. The results of modelling and forecasting the effect of calendar variations on the increase in COVID-19 are expected to contribute to stakeholders, both government agencies and the general public, to better comply with health protocols to control the spread of COVID-19 in East Java.
2.1 Research data and sources
This study uses secondary data taken from the East Java Provincial Health Office in collaboration with the East Java Province COVID-19 Task Force. The sun-earth distance data is accessed from available data from the official website of the United States Geological Survey where the data is Earth-Sun Distance in Astronomical Units for Days of the Year [17].
2.2 Research variable
This study used two independent variables: the Calendar Variation in 2020 and 2021 (X1) and the sun-earth distance (X2). This study's dependent variable (Y) was the Daily Case of COVID-19 in East Java Province from March 2020 to June 2021.
2.3 Data analysis method
The process of data analysis was carried out by analyzing time series data and building a forecasting model with a symbolic time series prognosis approach. The symbolic time series prognosis method is one of the methods in genetic programming that has been proven to produce models with high accuracy to predict the incidence of COVID-19 in India [18]. The analysis process was carried out using Heuristic Lab 3.3 software.
3.1 The spread of the COVID-19 pandemic in East Java
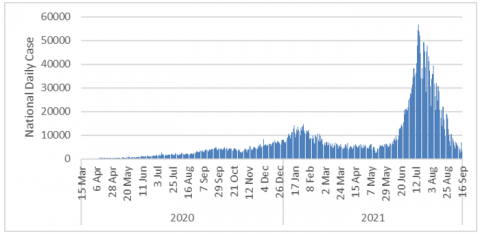
Cases of the spread of the COVID-19 pandemic in Indonesia were currently experiencing a decline. In the last two months, July – August 2021, it reached its peak. The following is the distribution of daily cases in Indonesia and East Java Province.
(a)
(b)
Figure 2. National (a) and East Java Province Daily Case of COVID-19 (b)
Based on Figures 1 and 2, judging from the distribution of daily cases in 2020 until September 16th, 2021, it is shown that the distribution of national and regional daily cases of East Java province has a relatively similar pattern. There were two waves: the first wave between November 22nd, 2020 - March 10th, 2021, and the second between June 6th, 2021 - September 6th 2021. Both waves are likely to occur due to the long holiday. The first wave is likely due to the Christmas and New Year holidays. At the same time, the second wave is likely to occur due to the Eid al-Fitr holiday. Transmission of COVID-19 can occur due to uncontrolled community mobility [4, 19]. Activities outside the home without implementing health protocols and community mobilization have the potential for human-to-human transmission [8, 20, 21].
3.2 The 2020 and 2021 holiday calendar
Handling the COVID-19 pandemic is very important to prevent and transmit, primarily through human transmission. One of the government's efforts to prevent this is to issue SKB for 3 Ministers, namely the Minister of Religion, the Minister of Manpower, and the Minister of Administrative Reform and Bureaucratic Reform regarding National Holidays. This arrangement hoped that it would minimize community mobilization, especially during the holiday period. The following is data related to national holidays in 2020 and 2021:
Table 1. National holidays in 2020 and 2021 in Indonesia
|
2020 |
2021 |
||||
|
National Holiday |
Date |
Description |
National Holiday |
Date |
Description |
|
1 |
January 1 |
New Year's Eve 2020 |
1 |
January 1 |
New Year's Eve 2021 |
|
2 |
January 25 |
Chinese New Year 2571 Kongzili |
2 |
February 12 |
Chinese New Year 2571 Kongzili |
|
3 |
March 22 |
Isra' Mi'raj Prophet Muhammad SAW |
3 |
March 11 |
Isra' Mi'raj Prophet Muhammad SAW |
|
4 |
March 25 |
Balinese Day of Silence Saka New Year 1942 |
4 |
March 14 |
Balinese Day of Silenceaka New Year 1943 |
|
5 |
April 10 |
The Good Friday |
5 |
April 2 |
The Good Friday |
|
6 |
May 1 |
The International Labour Day |
6 |
May 1 |
The International Labour Day |
|
7 |
May 7 |
Vesak Day 2564 |
7 |
May 13 |
the Ascension Day |
|
8 |
May 21 |
the Ascension Day |
8 |
13-14 May |
Eid Al-Fitr 1442 Hijriyah |
|
9 |
24 - 25 May |
Eid Al-Fitr 1441 Hijriyah |
9 |
May 26 |
Vesak Day 2565 |
|
10 |
June 1 |
Pancasila's Born Day |
10 |
June 1 |
Pancasila's Born Day |
|
11 |
July 31 |
Eid al-Adha 1441 Hijriyah |
11 |
July 20 |
Eid al-Adha 1441 Hijriyah |
|
12 |
August 17 |
Independence Day of the Republic of Indonesia |
12 |
August 11 |
Islamic New Year 1443 Hijriyah |
|
13 |
August 20 |
Islamic New Year 1442 Hijriyah |
13 |
August 17 |
Independence Day of the Republic of Indonesia |
|
14 |
October 29 |
Mawlid al-Nabi Muhammad SAW |
14 |
October 20 |
Mawlid al-Nabi Muhammad SAW |
|
15 |
December 25 |
Christmas Day |
15 |
December 25 |
Christmas Day |
|
official day-off |
official day-off |
||||
|
1 |
22 May |
Eid Al-Fitr 1441 Hijriyah |
1 |
12 May |
Eid Al-Fitr 1442 Hijriyah |
|
2 |
21 August |
Islamic New Year 1442 Hijriyah |
|||
|
3 |
28 and 30 October |
Mawlid al-Nabi Muhammad SAW |
|||
|
4 |
December 24 |
Christmas Day |
|||
|
5 |
28-31 December |
replacement official day off of Eid Al-Fitr 1441 Hijriyah |
|||
Based on Table 1, xalendar variations are repeated patterns with varying lengths due to the influence of different calendar calendars each year. There are two types of calendar variations, namely trade variations and holiday variations [22, 23]. In this study, time modelling with calendar variations that affect holiday variations is studied, especially for the effects of holidays due to religious holidays, national holidays, and collective leave. The existence of a holiday period is feared to significantly increase the community's mobility [6, 11]. The government has officially imposed large-scale social restrictions (PSBB) to suppress community mobility, especially in big cities such as Jakarta, Bandung, Surabaya, etc. However, the implementation of PSBB has not proven effective in preventing the transmission of COVID-19. It happens because of the people's desire to take a vacation or return home to their homeland. In addition, the ineffectiveness of the PSBB is also due to a large number of foreigners, especially from China, who enter Indonesia. Thus, community mobility that cannot be controlled has been proven to create human-to-human transmission of COVID-19 [14].
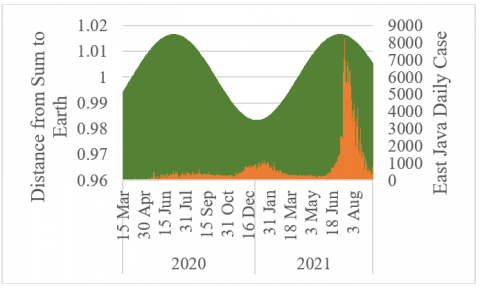
3.3 Distance from Sun to Earth
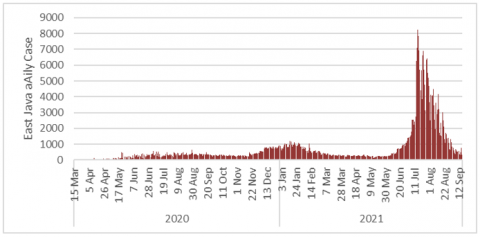
In addition to observing calendar variations from 2020-2021, this study also observes the sun-earth distance in astronomical units. The following is the sun-earth distance during the years 2020-2021:
Figure 3. The sun-earth distance during the years 2020-2021
Based on the graph of the sun-earth distance during the years 2020-2021 that shown in Figure 3, it is shown that in June-July, the sun-earth distance is at its farthest point, which is 1.0167 astronomical units. At the same time, the closest distance occurs in December-January, which is 0.9833 astronomical units. The following is a plot of the relationship between the sun-earth distance and the daily cases of COVID-19 in East Java Province:
Figure 4. Relationship between the sun-earth distance and the daily cases of COVID-19 in East Java
Based on the graph plot of the relationship between the distance of the sun to the earth and the daily cases of COVID-19 in East Jawa that shown in Figure 4, it is shown that when the sun is at its closest position to the earth, there is an increase in the daily cases of COVID-19, namely between December 2020 - February 2021. Thus, also in the range of June-August 2021, the sun's position is at its farthest point, but the daily COVID-19 cases are at their highest point. As explained in the study of Dang et al. [24], the difference in the Sun-Earth distance between the solstice in December and June has a significant impact on the annual asymmetry of the ionosphere. Variations in solar radiation between December and June directly cause a difference in electron density from December to June of about 6%, while recombination with a neutral composition contributes to a difference in electron density of 12%-15% [24]. However, the difference in sun-earth distance is not the only factor that influences climate. In fact, during the COVID-19 pandemic, there has been a sharp decrease in UV index concentrations with a slight increase in tropospheric O3 levels. Excess O3 has contributed significantly to trapping harmful UV radiation, which has lowered UVI in India's most polluted major cities [25].
3.4 Influence model of calendar variation and Sun-Earth distance on daily cases of COVID-19 in East Java
The model for the effect of calendar variations and sun-earth distance on daily COVID-19 cases in East Java is estimated using the Symbolic Time Series Prognosis Model approach. The formation of a model of the influence of calendar variations and sun-earth distance on daily cases of COVID-19 in East Java was carried out based on the evaluation of model possibilities as many as 1,000,000 models with a mutation probability of 15% and the number of generations of 1000. The following is the performance measure value of the model built:
Table 2. Performance measure of the symbolic time series prognosis model
|
Performance Measure |
Data Training |
Data Testing |
|
R2 |
90.04% |
82.14% |
|
RMSE |
354.483 |
665.212 |
|
ARE |
15.46% |
29.42% |
Based on Table 2, the model built has a relatively good level of performance with an R2 of 90.04% on training data and 82.14% on testing data. It proves that the model obtained has a good level of accuracy. However, in terms of Average Relative Error (ARE), the model still has an error rate exceeding 10%, indicating a relatively high error rate. The following are the results of the Symbolic Time Series Prognosis Model for the simplified model estimation of the effect of calendar variations and sun-earth distance on daily cases of COVID-19 in East Java:
$Y=\left(\left(\left(26847.18-158.97 Y_{(t-1)}+\frac{2.075}{3.898 X_{2(t-8)}\quad-0.688 \cdot X_{1(t-1)} \quad\cdot X_{1(t-11)}}\right)-\frac{-18.748}{1.318 X_{2(t-12)}\quad+23.461 X_{2(t-14)} \quad\cdot 0.97 X_{2(t-6)}}\right) \cdot(-0.006)+194.27\right)$.
where:
Y = Daily Case COVID-19 In East Java
X1 = Calendar Variations (Holidays)
X2 = Sun-Earth Distances
Based on the estimation results of the model of the effect of calendar variations and sun-earth distance on daily cases of COVID-19 in East Java, it is shown that there is a Y(t-1) variable in the model. It means that the incidence of COVID-19 cases in the previous period (yesterday) influences the current incidence of COVID-19 cases. Variables X1(t-1) and X1(t-11) show that the current incidence of COVID-19 cases is influenced by yesterday's holiday (X1(t-1)) and 11 days of holiday (X1(t-11)). Likewise, the Sun-Earth Distance variables X2(t-6), X2(t-8), X2(t-12), and X2(t-14) also influence the current incidence of COVID-19 cases. The following is the variable impact score for each variable:
Table 3. The variable impact score for each variable
|
Variable |
Impact Score |
||
|
Data Training |
Data Testing |
Overall |
|
|
Y |
0.902 |
0.818 |
0.906 |
|
X1 |
0.003 |
0.821 |
1.33E-09 |
|
X2 |
0.003 |
0.812 |
6.74E-09 |
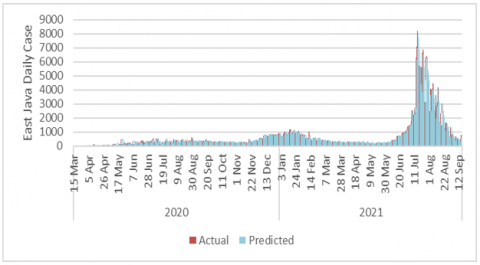
The Table 3 above shows the impact score of each variable. Based on the impact score in the table above, it is shown that the Y variable has the highest impact score. It means that the spread of COVID-19 cases in East Java is most affected by the spread of COVID-19 cases in the previous period. The following is an actual data plot with daily case prediction data for COVID-19 in East Java:
Figure 5. Prediction performance for COVID-19 in East Java
Based on the Figure 5 above, it is shown that the plots between the actual data and the predicted data are similar. It proves that the prognostic time series model obtained has a good level of accuracy. The strength of this research is that the data is collected centrally, openly and can be accessed in real-time. In addition, the forecasting results generated from the prognostic time series model have a high accuracy of up to 90%. Building a statistical prediction model can be done using a logistic regression model approach [26, 27]. However, the logistic regression model has limitations on the degree of linear polynomials. Likewise, forecasting models with spatial and Spatio-temporal approaches are also limited to linear polynomial degrees [15, 28]. Forecasting models generated with a machine learning approach have advantages, especially in the level of accuracy of forecasting results [18, 29, 30].
Therefore, the validity of the data is relatively high. However, this study has limitations, especially incomplete data and high completion variability, delays in reporting data, and not providing a history of patient social contacts. While the history of diseases such as fever and cough were previously reported separately, so they are prone to memory bias.
4.1 Conclusions
Based on the results of this study, it can be concluded that variations in the holiday calendar and the sun-earth distance have a strong influence on daily cases of COVID-19. The symbolic time series prognosis model obtained has an accuracy rate of up to 90.04% on training data and 82.14% on testing data.
4.2 Suggestions
Some suggestions that can be given based on the results of this study are as follows:
4.2.1 Theoretical suggestions
Future research can use variables other than Calendar Variation and Sun-Earth Distance to see their effect on the Daily Case Forecasting for COVID-19. There are other factors that can influence. Furthermore, other time series modeling can be used in forecasting.
4.2.2 Practical suggestions
Based on the results of the research, the Government of Indonesia, especially government agencies dealing with COVID-19, can pay more attention to calendar variations where variations in holiday periods have a large effect so that the government can make further policies when the holidays have started. In addition, the distance from the sun to the earth also needs to be considered in making further policies in handling COVID-19.
We want to express our gratitude to Universitas Brawijaya for funding research with the COVID Integrated Research scheme.
[1] Suhana. (2020). Dampak COVID-19 terhadap Pelaku Perikanan Lokal. https://suhana.web.id/2020/04/17/dampak-covid-19-terhadap-pelaku-perikanan-lokal/, accessed on Oct. 13, 2020.
[2] Kang, D., Choi, H., Kim, J.H., Choi, J. (2020). Spatial epidemic dynamics of the COVID-19 outbreak in China. International Journal of Infectious Diseases, 94: 96-102. https://doi.org/10.1016/j.ijid.2020.03.076
[3] Mollalo, A., Vahedi, B., Rivera, K.M. (2020). GIS-based spatial modeling of COVID-19 incidence rate in the continental United States. Science of the Total Environment, 728: 138884. https://doi.org/10.1016/j.scitotenv.2020.138884
[4] Nian, G., Peng, B., Sun, D.J., Ma, W., Peng, B., Huang, T. (2020). Impact of COVID-19 on urban mobility during post-epidemic period in megacities: From the perspectives of taxi travel and social vitality. Sustainability (Switzerland), 12(19): 7954. https://doi.org/10.3390/SU12197954
[5] Eryando, T., Sipahutar, T., Rahardiantoro, S. (2020). The Risk Distribution of COVID-19 in Indonesia: A Spatial Analysis. Asia-Pacific Journal of Public Health, 32(8). https://doi.org/10.1177/1010539520962940
[6] Sirkeci, I., Yüceşahin, M.M. (2020). Coronavirus and migration: Analysis of human mobility and the spread of COVID-19. Migration Letters, 17(2): 379–398. https://doi.org/10.33182/ml.v17i2.935
[7] Hizbaron, D.R., Ruslanjari, D., Mardiatno, D. (2021). Amidst COVID-19 pandemic: An adaptive disaster governance in Yogyakarta, Indonesia. Social Sciences, 10(3): 92. https://doi.org/10.3390/socsci10030092
[8] Irawan, M.Z., Rizki, M., Joewono, T.B., Belgiawan, P.F. (2020). Exploring the intention of out-of-home activities participation during new normal conditions in Indonesian cities. Transportation Research Interdisciplinary Perspectives, 8: 100237. https://doi.org/10.1016/j.trip.2020.100237
[9] Putera, M.L.S. (2020). Improvisasi model arimax-anfis dengan variasi kalender untuk prediksi total transaksi non-tunai. Indonesian Journal of Statistics and Its Applications, 4(2): 296–310. https://doi.org/10.29244/ijsa.v4i2.603
[10] Kourentzes, N., Saayman, A., Jean-Pierre, P., Provenzano, D., Sahli, M., Seetaram, N., Volo, S. (2021). Visitor arrivals forecasts amid COVID-19: A perspective from the Africa team. Annals of Tourism Research, 88: 103197. https://doi.org/10.1016/j.annals.2021.103197
[11] Saha, J., Barman, B., Chouhan, P. (2020). Lockdown for COVID-19 and its impact on community mobility in India: An analysis of the COVID-19 Community Mobility Reports, 2020. Children and Youth Services Review, 116: 105160. https://doi.org/10.1016/j.childyouth.2020.105160
[12] Gautam, Y. (2021). Transfer Learning for COVID-19 cases and deaths forecast using LSTM network. ISA Transactions. https://doi.org/10.1016/j.isatra.2020.12.057
[13] Hu, S., Xiong, C., Yang, M., Younes, H., Luo, W., Zhang, L. (2021). A big-data driven approach to analyzing and modeling human mobility trend under non-pharmaceutical interventions during COVID-19 pandemic. Transportation Research Part C: Emerging Technologies, 124: 102955. https://doi.org/10.1016/j.trc.2020.102955
[14] Jiang, P., Fu, X., Fan, Y. Van, Klemeš, J.J., Chen, P., Ma, S., Zhang, W. (2021). Spatial-temporal potential exposure risk analytics and urban sustainability impacts related to COVID-19 mitigation: A perspective from car mobility behaviour. Journal of Cleaner Production, 279: 123673. https://doi.org/10.1016/j.jclepro.2020.123673
[15] Sun, F., Matthews, S.A., Yang, T.C., Hu, M.H. (2020). A spatial analysis of the COVID-19 period prevalence in U.S. counties through June 28th, 2020: where geography matters? Annals of Epidemiology, 52: 54-59. https://doi.org/10.1016/j.annepidem.2020.07.014
[16] Zeng, C., Zhang, J., Li, Z., Sun, X., Olatosi, B., Weissman, S., Li, X. (2021). Spatial-temporal relationship between population mobility and COVID-19 outbreaks in south carolina: Time series forecasting analysis. Journal of Medical Internet Research, 23(4): e27045. https://doi.org/10.2196/27045
[17] USGS. (2021). Earth-Sun Distance in Astronomical Units for Days of the Year. https://www.usgs.gov/media/files/earth-sun-distance-astronomical-units-days-year.
[18] Salgotra, R., Gandomi, M., Gandomi, A.H. (2020). Time Series Analysis and Forecast of the COVID-19 Pandemic in India using Genetic Programming. Chaos, Solitons and Fractals, 138: 109945. https://doi.org/10.1016/j.chaos.2020.109945
[19] Zhang, C., Qian, L.X., Hu, J.Q. (2021). COVID-19 Pandemic with Human Mobility Across Countries. Journal of the Operations Research Society of China, 9(2): 229-244. https://doi.org/10.1007/s40305-020-00317-6
[20] Dobusch, L., Kreissl, K. (2020). Privilege and burden of immobility governance: On the reinforcement of inequalities during a pandemic lockdown. Gender, Work and Organization, 27(5): 709-716. https://doi.org/10.1111/gwao.12462
[21] Wei, Y., Wang, J., Song, W., Xiu, C., Ma, L., Pei, T. (2021). Spread of COVID-19 in China: analysis from a city-based epidemic and mobility model. Cities, 110: 103010. https://doi.org/10.1016/j.cities.2020.103010
[22] Suhartono, Dana, I. M.G.M., Rahayu, S.P. (2019). Hybrid model for forecasting space-time data with calendar variation effects. Telkomnika (Telecommunication Computing Electronics and Control), 17(1). https://doi.org/10.12928/TELKOMNIKA.v17i1.10096
[23] Suhartono, Rahayu, S.P., Prastyo, D.D., Wijayanti, D.G.P., Juliyanto. (2017). Hybrid model for forecasting time series with trend seasonal and salendar variation patterns. In Journal of Physics: Conference Series, 890: 012160. https://doi.org/10.1088/1742-6596/890/1/012160
[24] Dang, T., Wang, W., Burns, A., Dou, X., Wan, W., Lei, J. (2017). Simulations of the ionospheric annual asymmetry: Sun-Earth distance effect. Journal of Geophysical Research: Space Physics, 122(6): 6727-6736. https://doi.org/10.1002/2017JA024188
[25] Bera, B., Bhattacharjee, S., Shit, P.K., Sengupta, N., Saha, S. (2021). Variation and correlation between ultraviolet index and tropospheric ozone during COVID-19 lockdown over megacities of India. Stochastic Environmental Research and Risk Assessment. https://doi.org/10.1007/s00477-021-02033-w
[26] Aisyah, D.N., Mayadewi, C.A., Diva, H., Kozlakidis, Z., Siswanto, Adisasmito, W. (2020). A spatial-temporal description of the SARSCoV-2 infections in Indonesia during the first six months of outbreak. PLoS ONE, 15(12): e0243703. https://doi.org/10.1371/journal.pone.0243703
[27] Medina-Mendieta, J.F., Cortés-Cortés, M., Cortés-Iglesias, M. (2020). COVID-19 Forecasts for Cuba Using Logistic Regression and Gompertz Curves. MEDICC Review, 22(3). https://doi.org/10.37757/MR2020.V22.N3.8
[28] Huang, R., Liu, M., Ding, Y. (2020). Spatial-temporal distribution of COVID-19 in China and its prediction: A data-driven modeling analysis. Journal of Infection in Developing Countries, 14(3): 246-253. https://doi.org/10.3855/jidc.12585
[29] Qeadan, F., Honda, T., Gren, L.H., Dailey-Provost, J., Benson, L.S., Vanderslice, J.A., Shoaf, K. (2020). Naive forecast for COVID-19 in utah based on the South Korea and Italy models-the fluctuation between two extremes. International Journal of Environmental Research and Public Health, 17(8): 2750. https://doi.org/10.3390/ijerph17082750
[30] Roosa, K., Lee, Y., Luo, R., Kirpich, A., Rothenberg, R., Hyman, J.M., Chowell, G. (2020). Real-time forecasts of the COVID-19 epidemic in China from February 5th to February 24th, 2020. Infectious Disease Modelling, 5: 256-263. https://doi.org/10.1016/j.idm.2020.02.002