Sanjay Taneja![]() | Mukul Bhatnagar
| Mukul Bhatnagar![]() | Pawan Kumar
| Pawan Kumar![]() | Simon Grima*
| Simon Grima*![]()
© 2023 IIETA. This article is published by IIETA and is licensed under the CC BY 4.0 license (http://creativecommons.org/licenses/by/4.0/).
OPEN ACCESS
In the Indian marketplace, agriculture is an essential function. Cultivation is one of India's largest businesses. The various agricultural operations help ensure the country’s development. Considering the relevance of agricultural companies, this study attempts to measure the effectiveness of asset management by these companies (the top 5 as per market capitalisation). This highlights the need to understand the relationship between net profit and fixed assets. Another objective is to measure the trend in fixed assets and profitability of the top agricultural companies in India. To do this, a regression analysis and time series analysis was carried out on the dataset. The Jarque-Bera test was used to ensure normality, followed by the calculation of poolability. The study found that India's top agribusiness companies balance their fixed assets according to profitability. So if an agricultural company wants to ensure its survival, continuance, earnings, and growth, it must manage its fixed assets efficiently in tandem with the profits gained.
Indian, effectiveness, asset management, panel analysis, agricultural companies, Jarque-Bera test, regression
In the Indian marketplace, agriculture impersonates an essential function. Cultivation is one of India's largest businesses. The country’s financial development depends highly on agricultural operations [1]. In India, 60.45% of the land is cultivated [2]. It meets the needs of about 1.2 billion people [3]. Modernization of agriculture is extensive [4-6], leading to lower-cost returns [7]. In India, 45.6% of the population is employed in agriculture, but still, its condition is not promising [8]. Therefore, to boost Agri productivity, agricultural businesses have to flourish [9]. The present study looks at the business management of top agricultural companies in India so that a learning perspicuity for the companies which are thriving to earn more can be developed.
An agricultural enterprise is a division that promotes the development and economic expansion of the agricultural industry [10]. It continues to play an important role in emerging nations' development [11]. Agricultural production may be improved by agribusinesses [12], which is why governments frequently provide agricultural subsidies [13]. Agriculture also contributes to an enhanced food safety system [14], sustainable food production [15], and income for the majority of impoverished people in developing nations [16]. However, activities increase greenhouse gas emissions and contribute to global warming. This is why innovation is essential in addressing these issues [17].
Innovation is an ongoing effort among farmers as the sector seeks better and more efficient production and processing techniques [18, 19]. Many businesses, for example, now provide drone monitoring on farms, providing farmers with information on crop health and helping them develop stock forecasts and plans for the future [20]. New and better equipment, such as robotic harvesters [21], automated pesticide sprayers [22] and autonomous tractors [23], are also being developed and produced on a broad scale. The objective of agri-business innovation is to increase agricultural production and simplify agriculture for farmers [24]. It seeks to reduce production costs and raise profitability for farmers who frequently suffer from unpredictable market circumstances as prices of crops vary under shifting economic situations [25].
Considering the relevance of agricultural companies, this study attempts to measure the effectiveness of agri-business asset management. For this, the relationship between the net profit and fixed assets needs to be understood. Another objective of this study is to measure the trend in fixed assets and profitability of top agricultural companies in India. Also, this study will explore whether the benefits increase agricultural companies' profitability by investing adequately in assets. An increase in companies' fixed assets is significant as it favourably impacts the company's financial position in the coming years. If the value of fixed assets increases with an increase in profitability, the company is said to have better asset management [26].
This study will be beneficial for agricultural companies which are seeking to increase the profitability of their business. Business profitability depends upon many factors, and profit reinvestment is one of the significant determinants [27]. Profits earned in a business can be used for different purposes, for example, investment into fixed assets [28], current assets [29] or throwing money expenses into such areas as an advertisement, selling promotion, etc. [30]. Every company chooses a blend where to invest the profits into different alternatives [31]. However, there is always subjectivity regarding the weight and prioritisation of profit-share investing [32]. This article will help clarify how investing for profit through purchasing new fixed assets can help increase business. This is by establishing how the relationship between a business's profitability adds value by investing in fixed assets. If their relationship is significant and positive, the interpretation and discussion on the positive relationship between fixed assets and profitability will be made [33, 34]. On the other hand, if the relationship is negative or insignificant, an interpretation and discussion on the usefulness of investing a major percentage of profits into fixed assets will be made [35]. This observation will be consequential for the owners and managers of agricultural companies as it will provide clear insight regarding the correct approach to reinvesting profits. A company's profits are majorly reinvested in both fixed and current assets. But since fixed assets associate with more weight age than other assets in the context of investment expenditure, they are considered a part of the present research. Furthermore, it is correct that it does not guarantee an increased profit, but its role in profits must be supported and cannot be undermined.
Therefore, this article will focus on measuring the effectiveness of asset management in agricultural companies to establish the relationship between the company's net profits and fixed asset investment and to calculate whether the investment of earnings into fixed assets increases the profitability of agricultural companies. Present research is restricted to the objective of looking at fixed asset management through earned profits by top performing public sector agri-businesses in India. This can be done by looking at the quantities of fixed assets in relation to the profitability.
To maximise the enterprise value, it is necessary to take asset investment decisions judiciously. Profitability management and asset management activities are critical success factors for the efficient performance of an enterprise [36]. In the real estate sector, reinvesting profit into the business is significant to achieve the goal of revenue maximization and cost minimization [37]. Moreover, if a business is small, it is crucial to choose a suitable asset management model for business survival and growth [38]. Furthermore, the government is also involved in many businesses in a developing nation. Hence asset management through the judicious investment of profits in fixed assets can help the government to deliver results in different domains efficiently. It was found after studying the case of the Indonesian government that there are many challenges a government face to improve the quality of asset management through proper management of government receipts [39].
Asset management is not only about profit. It also helps to ensure that the business is more cost-efficient. A study in San Fransisco found that with judicious asset management, total energy costs can be reduced by 14.8 percent, saving billions of dollars for an industrial unit [40]. A model considering Economic Order Quantity (EOQ) was used to ensure cost-effective asset management. It was constructed on the basis that managing cash inflows effectively to purchase the right asset at the right time can help maximize the firm's value [40].
Asset management is a significant part of maintaining the potential of making an entity a profit-sustaining concern. This is because it attracts new customers by persuading referrals to purchase the product or service delivered [41].
India's top 5 agricultural companies are chosen based on market capitalisation from the Bombay Stock Exchange. The data set of selected companies is framed for ten years, from 2012 to 2021.
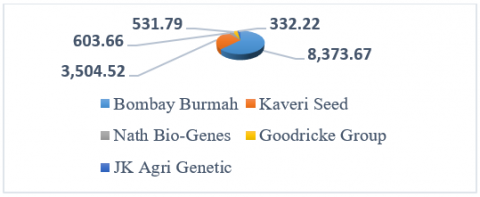
Figure 1. Market Cap (Rs. cr)
SOURCE: Authors’ Compilation adapted from Top Agriculture Companies in India, Top Agriculture Stocks in India by Market Capitalization, List of Top Agriculture Stocks in India {2021} - BSE
Net profits and the value of fixed assets are taken as a variable. Net profit acts as the independent variable and fixed assets as the dependent variable. A time series analysis is conducted on the framed dataset. The Jarque-Bera test is employed to check the normality, and then poolability is measured. Based on individual and time effects, seemingly unrelated regression is then applied. Figure 1 contains the market capitalisation of 5 companies taken as a sample in the study.
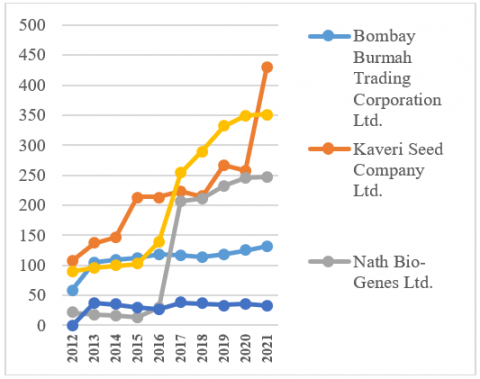
Figure 2. Value of fixed assets owned by top 5 Agricultural companies in India
SOURCE: Authors’ Compilation adapted from Equity Study |Capital Markets Study& Information Services| Dion Global 2021
Figure 2 shows a comparative projection of fixed assets of India's top 5 agricultural companies for ten years. From the bar diagrams and fitted trend lines, it can be seen that nearly every company shows an upward movement in terms of the value of its fixed assets. Only one company, i.e. J.K. Agri Genetics limited, shows a minimum elastic slope in the trend line of fixed assets. The rest all have a considerable jump over time in fixed asset increase.
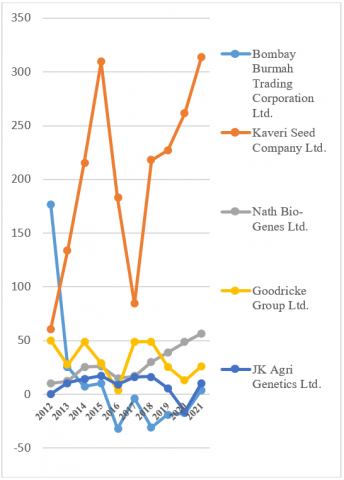
Figure 3. Value of net profit of top 5 Agricultural companies in India
SOURCE: Authors’ Compilation adapted from Equity Study |Capital Markets Study& Information Services| Dion Global 2021
Figure 3 shows a comparative projection of the Net profit of India's top 5 agricultural companies for ten years. From the bar diagrams and fitted trend lines, it can be interpreted that there is significant variance in terms of its net profits as the f-ratio value is 28.07762. The p-value is <.00001. The result is significant at p<.05. Only one company, i.e. J.K. Agri Genetics limited, shows a negative elastic slope in the trend line of net profits.
The hypotheses test is used in statistics to check a population’s parameter assumption. In line with the study objectives, the following hypothesis is framed:
H0A- Data is normally distributed
H0B- There is no Individual effect
H0C- There is no time effect
H0D- There is no significant relationship between profitability and agricultural company fixed assets.
The following equations are employed for concluding about the study problem:
$y_{i r}=x_{i r}^{\top} \beta_i+\varepsilon_{i r}, i=1, \ldots, m$ (1)
Different regression equations formed in seemingly unrelated regressions are represented by the number ‘m’ in Eq. (1). “i” stands for the equation number, “r” is the individual observation, yir the response variable and ki a dimensional vector of regressors xir.
Moreover, if the placement of these “m” vector equations is stacked on one another, it will take the form of Eq. (2)
$\left(\begin{array}{c}y_1 \\ y_2 \\ \vdots \\ y_m\end{array}\right)=\left(\begin{array}{cccc}X_1 & 0 & \ldots & 0 \\ 0 & X_2 & \ldots & 0 \\ \vdots & \vdots & \ddots & \vdots \\ 0 & 0 & \ldots & X_m\end{array}\right)\left(\begin{array}{c}\beta_1 \\ \beta_2 \\ \vdots \\ \beta_m\end{array}\right)+\left(\begin{array}{c}\varepsilon_1 \\ \varepsilon_2 \\ \vdots \\ \varepsilon_m\end{array}\right)=X \beta+\varepsilon$ (2)
According to the model's assumptions, error terms εir are assumed to be cross-equationally uncorrelated across observations but may exist inside them. The following equation denotes the matrix Kronecker product to structure the calculation in the form of an R-dimensional identity matrix [42].
$\Omega \equiv \mathrm{E}\left[\varepsilon \varepsilon^{\top} \mid X\right]=\Sigma \otimes I_R$ (3)
The SUR model is usually evaluated employing the feasible generalized least squares (FGLS) methodology. This is a two-step process where we run ordinary least squares regression in the foremost stage. The residuals from this regression are utilized to assess the matrix elements [43].
$\hat{\sigma}_{i j}=\frac{1}{R} \hat{\varepsilon}_i^{\top} \hat{\varepsilon}_j$ (4)
The secondary step is the application of generalized least squares regression for (2) using the variance matrix $\widehat{\Omega}=\widehat{\Sigma} \otimes I_R$.
$\hat{\beta}=\left(X^{\top}\left(\hat{\Sigma}^{-1} \otimes I_R\right) X\right)^{-1} X^{\top}\left(\hat{\Sigma}^{-1} \otimes I_R\right) y$ (5)
Finally, the following distribution (6) is used in the long panel analysis.
$\sqrt{R}(\hat{\beta}-\beta) \stackrel{d}{\rightarrow} \mathcal{N}\left(0,\left(\frac{1}{R} X^{\top}\left(\Sigma^{-1} \otimes I_R\right) X\right)^{-1}\right)$ (6)
Normality test is considered as the starting point for panel data analysis, which can be done by several methods. For testing the normality of the time series data used in the study, the Jarque-Bera test is used, as shown in Table 1. The Lagrange multiplier test Jarque-Bera is a normality test. Normality is one of the assumptions that a Jarque-Bera test is normally performed before one of these tests to validate normality, such as t-tests or F-tests. This is typically employed in big data sets since alternative normality testing when n is large is not trustworthy.
Table 1. Normality test
|
Particulars |
Jarque-Bera test |
p-value |
Normality |
|
Fixed Assets |
4.50452 |
0.105161 |
Yes |
|
Profit |
31.1984 |
1.6801 |
No |
Source: Authors’ Compilation
Table 2. Model for the poolability test
|
Dependent variable: Fixed Assets |
||||
|
|
Coefficient |
std. error |
t-ratio |
p-value |
|
const |
115.455 |
18.053 |
6.395 |
8.85 *** |
|
Profit |
0.4253 |
0.2483 |
1.7128 |
0.093* |
Source: Authors’ Compilation
Table 3. Descriptive statistics for checking poolability
|
Particular |
Amount |
Particular |
Amount |
|
Mean dependent var |
139.379 |
S.D. dependent var |
106.2330141 |
|
Sum squared resid |
287894.383 |
S.E. of regression |
80.88914735 |
|
LSDV R-squared |
0.4793 |
Within R-squared |
0.062507403 |
|
LSDV F(5, 44) |
8.1030 |
P-value(F) |
1.74E-05 |
|
Log-likelihood |
-287.405 |
Akaike criterion |
586.8101514 |
|
Schwarz criterion |
598.282 |
Hannan-Quinn |
591.178807 |
|
rho |
0.816 |
Durbin-Watson |
0.345480132 |
Source: Authors’ Compilation
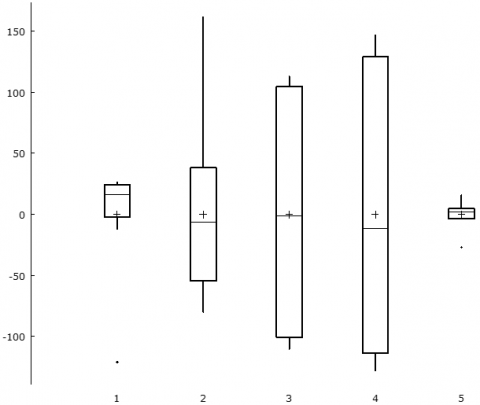
Figure 4. Box plot
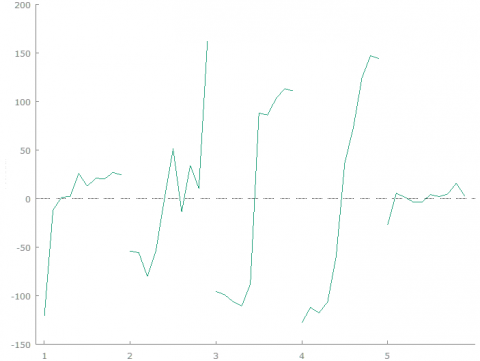
Figure 5. Residual plot by observation number
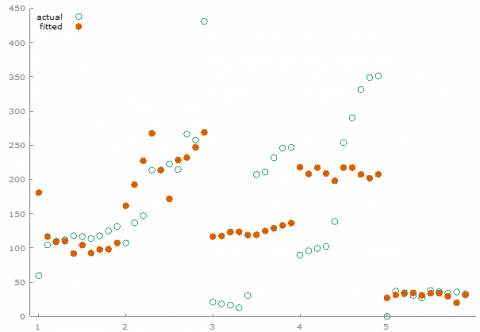
Figure 6. Fitted actual plot by observation number
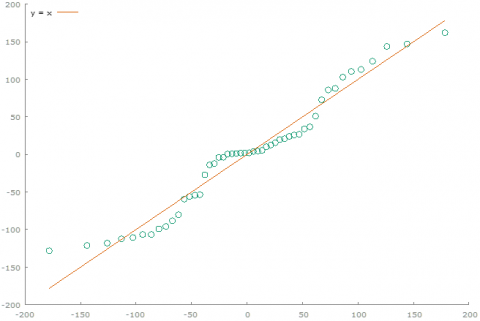
Figure 7. Q-Q plot
Source: Authors’ Compilation
Table 4. Joint test on named regressors
|
Particulars |
Value |
|
dfn |
1 |
|
dfd |
44 |
|
test statistic |
2.933703938 |
|
p-value |
0.093787753 |
Source: Authors’ Compilation
Table 5. Test for differing group intercepts
|
Particulars |
Value |
|
dfn |
4 |
|
dfd |
44 |
|
test statistic |
5.361966046 |
|
p-value |
0.00132002 |
Source: Authors’ Compilation
Figure 4 shows the distribution of residual by group and Figure 5 shows the residual by observation number and Figures 6 and 7 show the fitted actual plot by observation number and Quantile-Quantile plot (used to compare the two distributions) respectively.
To choose an appropriate model after checking normality, next thing is to check the poolability of framed dataset that will analyse the stability of the parameters. All the tables from Table 2 to Table 5 are calculated to check the data's probability. Based on whether the data is poolable or not, further calculations to conclude will be made.
In Table 5, data is not poolable since the p-value < .05.
Table 6. Pearson CD test for cross-sectional dependence
|
Particulars |
Value |
|
Test statistic: z |
6.286347 |
|
p-value |
P(|z| > 6.28635) = 3.25e-010 |
|
Average absolute correlation |
0.629 |
Source: Authors’ Compilation
In Table 6, since the P-value is less than 5%, hence there is an individual effect. Hence there is heterogeneity in data. These values are achieved by the application of the following equation:
$C D_{L M}=T \sum_{i=1}^{N-1} \sum_{j=i+1}^N \hat{\rho}_{i j}^2$
Wald Joint Test on Time Dummies -
Null hypothesis: No time effects
Asymptotic test statistic: Chi-square (9) = 25.0226
with p-value = .120591008
There is no time effect in the dataset. Hence the dataset’s not poolable, but there is an individual effect and no time effect. The distribution of the wald test under the null hypothesis is:
$\begin{gathered}\left(R \hat{\theta}_n-r\right)^{\prime}\left[\left.R\left(\hat{V}_n / n\right) R^{\prime}\right|_{\mathcal{D}} ^{-1}\left(R \hat{\theta}_n-r\right) / Q \stackrel{\mathcal{D}}{\rightarrow} F(Q, n\right. -P) \stackrel{{ }^{D}}{\rightarrow} \chi_Q^2\end{gathered}$
Equation System, Seemingly Unrelated Regressions
Eq. (1): SUR, using observations 1:01-5:10 (T = 50)
Dependent variable: Fixed Assets
coefficient std. error t-ratio p-value
--------------------------------------------------------
Profit 1.14750 0.176900 6.487 4.14e-08 ***
Cross-equation VCV for residuals (correlations above the diagonal)- 16555.
log determinant = 9.71442
Equation
^Fixed Assets = 115 + 0.425*Profit
n = 50, R-squared = 0.479 (standard errors in parentheses)
Hence in the conclusion of the above calculations, it can be said that India's top companies in agro-businesses are balancing their fixed assets with profitability. So if an agricultural company wants to ensure its survival, profit and growth, it must effectively manage its fixed assets with the profits earned.
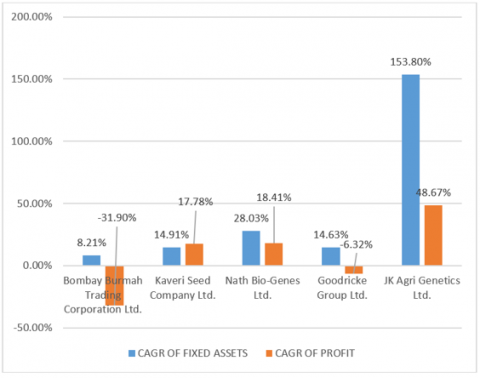
Figure 8. CAGR for trend measurement
SOURCE: Author's Calculations
Please After analysing the relationship between net profit and fixed assets, it was found that an individual effects exist between the variables. As discussed by many researchers, such an assessment of the relationship between the dependent and independent variables is carried out based on individual effect measurement. As many researchers have discussed, such an assessment of the relationship between the dependent and independent variables serves as the foundation for individual effect measurement. After assessing the individual effect, the next step is to check the poolability in the data set. This valuation of poolability is done by measuring the time effect in the framed data set, and in the present study, the data is not poolable. That is, there is no time effect. From the current computations, it can be interpreted that India's leading agro-businesses are balancing their fixed assets and profitability. Therefore, if an agricultural firm wants to secure its survival, profitability, and expansion, it must adequately manage its fixed assets using the earnings gained. This is a significant conclusion, which corroborates the study by Bruce and David, who found that it would be challenging to meet considerable fixed-assets expenditure to stay innovative in terms of updated technology [44]. This current study emphasises on demystifying the significance of profit reinvestment to update technology in fixed assets. Findings are in line with results from similar studies conducted to observe the impact of variables in asset management in different sectors. e.g., [45-49]. The present study employs a compound annual growth rate (CAGR) to measure the companies' yearly growth. The CAGR is the average annual rate of return on investments over a period larger than one year. The CAGR of fixed assets and net profit for the enterprises evaluated has been estimated in Figure 8. This is one of the most accurate approaches for calculating and evaluating the returns on individual assets, investment portfolios, and anything else with potential growth or decline in value over time. In terms of compound annual growth rate, J.K. Agri Genetics Ltd. has the highest profitability and fixed asset performance. It has grown its fixed assets and net earnings at rates of 153.80 percent and 48.67 percent, respectively. On the other side, Bombay Burmah Trading Corporation Ltd. had the lowest performance, growing at an annual rate of 8.21 percent in fixed assets and -31.90 percent in profit. Anupam and Karuna, in their study, used the same tool to measure the growth of a Kuwait food company, which provided them with an insight into the business's journey over time [50]. Also, this tool is significantly used to measure asset management effectiveness in different industries widely by researchers, e.g. [51-53]. The current results are in line with the study, which arrived at the same conclusions with a different model affirming that profit maximization can only be achieved by taking a conscious and calculated asset management decision [54].
Furthermore, it is the opinion of many U.K. and UAE experts that using business profitability for asset management is critical to the success of a business [36]. Additionally, the current consequence supports equivalent research conducted in real estate, remarking on the rational application of funds forged from profit to accomplish efficient asset management for acquiring economies of scale in a business [37]. Also, in small businesses, efficiency in the manufacturing process is a critical success factor. This efficiency can be achieved by continuously updating technology. Hence bringing a profit-controlling factor in the industry to invest in fixed assets can boost the productivity level of an enterprise [38]. In addition, the government of a developing nation often owns or controls a variety of firms. Therefore, the government may benefit from prudent asset management by investing surplus funds in long-term assets. After examining the Indonesian government's situation, it became clear that there are numerous obstacles in the way of enhancing the quality of asset management through the efficient administration of tax revenues. Hence their research supports the results of the current analysis [39]. Thus, comparing the results of this research with the related studies, asset management is significant for the survival and growth of every industry and if an agri-business wants to establish an upward trend in business operations investment in fixed asset, they need to carry out a technological up gradation through profit earned.
Survival, profit and growth are the aims of every business and the agricultural industry. The objective of survival and growth can be met only by sustainable profitability in business. If we consider agrarian companies, the scope of growth of agricultural enterprises in India is very high. But the figures for profitability are not satisfactory as per the recently published data in the company's financial statements. Currently, almost 50% of the Indian population is involved in agriculture. Agricultural companies act as the most extensive support system for the farmers by providing them with a platform to sell their products and offer various allied services. The agri-companies need to prosper to act as a catalyst in the nation's growth. To do this, the financial management of the assets has a crucial role. India's leading agro-enterprises balance their fixed assets with profitability. Therefore, if an agricultural company wants to secure its continuance, earnings and growth, it must manage its fixed assets efficiently in line with the profits gained. Hence, judicious asset management is required to earn consistent long-run profits and maintaining the capability of regular profit-earning requires a steady up-grade in its fixed assets. Since we do not recall finding many studies on agri-business earnings and growth, managed through fixed assets upgradation in line with the profits gained, we believe that the results of this article to be significant for policy makers of a country that like India depends highly on this business sector. However, present research suffers from some limitations. Considering the basis of financial modelling, business success is affected by many factors. Though, retained earnings of the business can be used in several other ways, this research focuses on studying the managerial financial behaviour concerning investment of profit in fixed assets only. Also, this research focuses on studying the financial behavior of agricultural companies only. The same financial modelling can be applied to other companies as well. Hence it can be stated that, it sets a perspective that top agricultural companies are bearing upon the fixed asset investment from their profits retained. Therefore, if an agri-business wants to florish, profit utilization must consider acquiring relevant fixed assets in the form of new technologies.
Conceptualization, S.T.;M.B.;P.K. and S.G.; methodology, S.T.;M.B.;P.K. and S.G..; software, S.T.;M.B.;P.K. and S.G.; validation, S.T. and S.G.; formal analysis, S.T.;M.B.;P.K. and S.G.; investigation, S.T.;M.B.;P.K. and S.G.; resources, S.T.;M.B.;P.K. and S.G.; data curation, S.T.;M.B.;P.K. and S.G.; writing—original draft preparation, S.T.;M.B. and P.K. a; writing—review and editing, S.T. and S.G.; visualization, S.T.;M.B.;P.K. and S.G.; supervision, S.T. and S.G.; project administration, S.T. and S.G. All authors have read and agreed to the published version of the manuscript.
[1] Swaminathan, M.S. (2006). Serving Farmers And Saving Farming: Agricultural Renewal Report. https://agricoop.nic.in/sites/default/files/NCF5%20Vol.-1%20%281%29.pdf.
[2] Nikhade, S.R., Gunaki, A.S. (2020). Agricultural mechanization in India. International Journal of Engineering Development and Research, 8(5): 2594-2605. http://www.ijedr.org/papers/IJCRT2005333.pdf.
[3] FAO. (2017). The future of food and agriculture: Trends and challenges. https://www.fao.org/3/i6583e/i6583e.pdf.
[4] Choudhury, P.R., Behera, M.K. (2017). Using Administrative Data for Monitoring and Improving Land Policy and Governance in India. In Proceedings of the 10th International Conference on Theory and Practice of Electronic Governance, pp. 127-135. https://doi.org/10.1145/3047273.3047296
[5] Moeis, F.R., Dartanto, T., Moeis, J.P., Ikhsan, M. (2020). A longitudinal study of agriculture households in Indonesia: The effect of land and labor mobility on welfare and poverty dynamics. World Development Perspectives, 20: 100261. https://doi.org/10.1016/j.wdp.2020.100261
[6] Tuli, A., Hasteer, N., Sharma, M., Bansal, A. (2014). Framework to leverage cloud for the modernization of the Indian agriculture system. In IEEE International Conference on Electro/Information Technology, Milwaukee, WI, USA, pp. 109-115. https://doi.org/10.1109/EIT.2014.6871748
[7] Chhatre, A., Devalkar, S., Seshadri, S. (2016). Crop diversification and risk management in Indian agriculture. Decision, 43: 167-179. https://doi.org/10.1007/s40622-016-0129-1
[8] Chand, R., Singh, J. (2022). Workforce Changes and Employment: Some Findings from PLFS Data Series (pp. 2022-04). NITI Aayog Discussion Paper (1).
[9] Trukhachev, V.I., Sklyarov, I.Y., Sklyarova, J.M., Latysheva, L.A., Lapina, H.N. (2016). Contemporary state of resource potential of agriculture in South Russia. International Journal of Economics and Financial Issues, 6(5): 33-41.
[10] Dwijanto, A., Rahmadyanti, E., Sarmini, S. (2013). Model of agro-food and beverages smes development based on environmentally friendly strategy for pasuruan acceleration of economic development as a regional agropolitan in Java economic corridors. Int. J. Appl. Environ. Sci., 8(8): 909-920.
[11] Yang, F., Jiang, Y., Pu, X. (2021). Impact of work value perception on workers’ physical and mental health: Evidence from China. In Healthcare, 9(8): 1059. https://doi.org/10.3390/healthcare9081059
[12] Ho, K.L.P., Quang, H.T., Miles, M.P. (2022). Leveraging entrepreneurial marketing processes to ameliorate the liability of poorness: The case of smallholders and SMEs in developing economies. Journal of Innovation & Knowledge, 7(4): 100232. https://doi.org/10.1016/j.jik.2022.100232
[13] Sundar, I. (2002). Sustainable agriculture and sustainability of Indian agriculture in the context of globalisation. International Journal of Environment and Pollution, 18(5): 455-462. https://doi.org/10.1504/IJEP.2002.002339
[14] Kochhar, S. (2008). Institutions and capacity building for the evolution of intellectual property rights regime in India: V - Analysis of review of TRIPS agreement and R&D prospect in Indian agriculture under IPR regime. Journal of Intellectual Property Rights, 13(5): 536-547.
[15] Singh, R., Singh, H., Raghubanshi, A.S. (2019). Challenges and opportunities for agricultural sustainability in changing climate scenarios: A perspective on Indian agriculture. Tropical Ecology, 60: 167-185. https://doi.org/10.1007/s42965-019-00029-w
[16] He, S., Liu, Y., Wu, F., Webster, C. (2010). Social groups and housing differentiation in China's urban villages: An institutional interpretation. Housing Studies, 25(5): 671-691. https://doi.org/10.1080/02673037.2010.483585
[17] Sarkar, B., Omair, M., Choi, S.B. (2018). A multi-objective optimization of energy, economic, and carbon emission in a production model under sustainable supply chain management. Applied Sciences, 8(10): 1744. https://doi.org/10.3390/app8101744
[18] Adams, D.A., Hamre, B.K., Farmer, L. (2021). Instructional Interactions and Literacy: Supporting Classroom Instruction Through Teacher Social-Emotional Skill Development. In Handbook of Research on Supporting Social and Emotional Development Through Literacy Education (pp. 261-282). IGI Global. https://doi.org/10.4018/978-1-7998-7464-5.ch013
[19] Singh, S. (2013). Information and Communication Technology and its potential to transform Indian agriculture. In E-Agriculture and Rural Development: Global Innovations and Future Prospects (pp. 140-168). IGI Global. https://doi.org/10.4018/978-1-4666-2655-3.ch012
[20] Ahirwar, S., Swarnkar, R., Bhukya, S., Namwade, G. (2019). Application of drone in agriculture. International Journal of Current Microbiology and Applied Sciences, 8(1): 2500-2505. https://doi.org/10.20546/ijcmas.2019.801.264
[21] Zion, B., Mann, M., Levin, D., Shilo, A., Rubinstein, D., Shmulevich, I. (2014). Harvest-order planning for a multiarm robotic harvester. Computers and Electronics in Agriculture, 103: 75-81. https://doi.org/10.1016/j.compag.2014.02.008
[22] Talaviya, T., Shah, D., Patel, N., Yagnik, H., Shah, M. (2020). Implementation of artificial intelligence in agriculture for optimisation of irrigation and application of pesticides and herbicides. Artificial Intelligence in Agriculture, 4: 58-73. https://doi.org/10.1016/j.aiia.2020.04.002
[23] Stentz, A., Dima, C., Wellington, C., Herman, H., Stager, D. (2002). A system for semi-autonomous tractor operations. Autonomous Robots, 13: 87-104. https://doi.org/10.1023/A:1015634322857
[24] Naseer, M.A.U.R., Ashfaq, M., Hassan, S., Abbas, A., Razzaq, A., Mehdi, M., Ariyawardana, A., Anwar, M. (2019). Critical issues at the upstream level in sustainable supply chain management of agri-food industries: Evidence from Pakistan’s citrus industry. Sustainability, 11(5): 1326. https://doi.org/10.3390/su11051326
[25] Pérez-Mesa, J.C., Piedra-Muñoz, L., García-Barranco, M.C., Giagnocavo, C. (2019). Response of fresh food suppliers to sustainable supply chain management of large European retailers. Sustainability, 11(14): 3885. https://doi.org/10.3390/su11143885
[26] Marttonen, S., Monto, S., Kärri, T. (2013). Profitable working capital management in industrial maintenance companies. Journal of Quality in Maintenance Engineering, 19(4): 429-446. https://doi.org/10.1108/JQME-08-2013-0054
[27] Cull, R., Xu, L.C. (2005). Institutions, ownership, and finance: the determinants of profit reinvestment among Chinese firms. Journal of Financial Economics, 77(1): 117-146. https://doi.org/10.1016/j.jfineco.2004.05.010
[28] Qin, D., Song, H. (2009). Sources of investment inefficiency: The case of fixed-asset investment in China. Journal of Development Economics, 90(1): 94-105. https://doi.org/10.1016/j.jdeveco.2008.06.001
[29] Cheatham, C.C. (1989). Economizing on cash investment in current assets. Managerial Finance, 15(6): 20-25. https://doi.org/10.1108/eb013630
[30] Cooper, R., Kaplan, R.S. (1988). Measure costs right: Make the right decisions. Harvard Business Review, 66(5): 96-103.
[31] Ansoff, H.I. (1957). Strategies for diversification. Harvard Business Review, 35(5): 113-124.
[32] Greiner, S., Michaelowa, A. (2003). Defining investment additionality for CDM projects—practical approaches. Energy Policy, 31(10): 1007-1015. https://doi.org/10.1016/S0301-4215(02)00142-8
[33] Tang, C.H.H., Jang, S.S. (2007). Revisit to the determinants of capital structure: A comparison between lodging firms and software firms. International Journal of Hospitality Management, 26(1): 175-187. https://doi.org/10.1016/j.ijhm.2005.08.002
[34] Boadi, E.K., Antwi, S., Lartey, V.C. (2013). Determinants of profitability of insurance firms in Ghana. International Journal of Business and Social Research (IJBSR), 3(3): 43-50.
[35] Lazonick, W. (2014). Profits without prosperity. Harvard Business Review, 92(9): 46-55.
[36] Almarri, K., Boussabaine, H. (2017). Interdependency of the critical success factors and ex-post performance indicators of PPP projects. Built Environment Project and Asset Management, 7(5): 546-556. https://doi.org/10.1108/BEPAM-05-2017-0031
[37] Allodi, E., Cacciamani, C., Caliolo, M., De Santis, P.P., Della Marra, F., Sanfelici, S. (2020). Real estate asset management companies’ economies of scale: Is it a dream or reality? The Italian case. Complexity, 2020: 1-9. https://doi.org/10.1155/2020/8752865
[38] Shirai, K., Amano, Y. (2017). Suitable inventory asset management using route-dependent options in mathematical finance. International Journal of Innovative Computing, Information and Control, 13(6): 1791-1811.
[39] Hanis, M., Trigunarsyah, B., Susilawati, C. (2010). Public asset management framework for local governments: Opportunities and challenges for public asset managers. In Proceedings of the Second International Postgraduate Conference on Infrastructure and Environment, pp. 132-142.
[40] Wikoff, D. (2009). Billions of dollars to be saved with reliability excellence. TMS Annual Meeting, pp. 187-191.
[41] Park, K.B., Park, M.J. (2017). Does the interactive quality of premium asset management service promote customers’ referral intentions? The moderating effect of customer’s asset size. International Journal of Bank Marketing, 35(4): 596-615. https://doi.org/10.1108/IJBM-05-2016-0062
[42] Van Loan, C.F. (2000). The ubiquitous Kronecker product. Journal of Computational and Applied Mathematics, 123(1-2): 85-100. https://doi.org/10.1016/S0377-0427(00)00393-9
[43] Amemiya, T. (1985). Generalized Least Squares Theory. Advanced Econometrics. Cambridge, Massachusetts: Harvard University Press.
[44] Kahn, B., LeZaks, D. (2009). Investing in agriculture: far-reaching challenge, significant opportunity: An asset management perspective. Significant Opportunity: An Asset Management Perspective (June 24, 2009). https://dx.doi.org/10.2139/ssrn.2464716
[45] Abdullah, A., Hassan, R., Kassim, S. (2020). A real asset management approach for Islamic investment in containerships. Journal of Islamic Accounting and Business Research, 11(1): 27-48. https://doi.org/10.1108/JIABR-07-2017-0105
[46] Grytsyna, O., Sholudko, O., Synyavska, L., Rubai, O., Zabedyuk, M., Strielkova, Y. (2021). Trends in the formation and correlation of current and non-current assets of agricultural enterprises: A case study of Ukraine. Scientific Papers: Management, Economic Engineering in Agriculture & Rural Development, 21(3): 411-420.
[47] Hasan, Z.A., Othman, A., Ibrahim, K., Md Shah, M.A.M., Noor, A.H.M. (2015). Management of Waqf Assets in Malaysia. International Journal of Nusantara Islam, 1(2): 59-68. https://doi.org/10.15575/ijni.v3i1.412
[48] Nieboer, N., Gruis, V. (2016). The continued retreat of non-profit housing providers in the Netherlands. Journal of Housing and the Built Environment, 31: 277-295. https://doi.org/10.1007/s10901-015-9458-1
[49] Pascual, R., Siña, M., Santelices, G., Román, M., López Droguett, E. (2017). Optimal channel coordination in use-based product-service system contracts. International Journal of Production Research, 55(23): 6946-6956. https://doi.org/10.1080/00207543.2017.1332793
[50] Mehta, A., Lulla, K. (2016). Kuwait food company (Americana): Financial analysis. South Asian Journal of Business and Management Cases, 5(2): 168-180. https://doi.org/10.1177/2277977916665979
[51] Lehtoviita, A. (2016). Asset management and asset tracking in Finnish healthcare. Master's thesis. Tampere University of Technology.
[52] Huynh, N.T., Robu, V., Flynn, D., Rowland, S., Coapes, G. (2017). Design and demonstration of a wireless sensor network platform for substation asset management. CIRED-Open Access Proceedings Journal, 2017(1): 105-108. https://doi.org/10.1049/oap-cired.2017.0273
[53] Mallow, M. (2019). Asset management, index funds, and theories of corporate control. Index Funds, and Theories of Corporate Control (November 12, 2019). https://dx.doi.org/10.2139/ssrn.3483573
[54] Michalski, G. (2013). Portfolio management approach in trade credit decision making. arXiv preprint arXiv:1301.3823. https://doi.org/10.48550/arXiv.1301.3823