Haider I. Alyasari*![]() | Maryam D. Altaweel
| Maryam D. Altaweel![]() | Ammar K. Dhumad
| Ammar K. Dhumad![]()
© 2023 IIETA. This article is published by IIETA and is licensed under the CC BY 4.0 license (http://creativecommons.org/licenses/by/4.0/).
OPEN ACCESS
The development in science and technology in the building industry has proven that the use of traditional construction methods has become undesirable because of its adverse effects on the building itself in terms of weight and thermal performance, thus affecting the energy efficiency of the building. Reducing energy consumption is a high-priority issue at various societal and economic levels. Thermal performance is the extent to which the design of a building responds to the daily and seasonal changing in climatic conditions. Designing buildings that achieve thermal comfort in harmony with the external environment requires involving appropriate modern technologies. The present simulation-based research assesses thermal performances by testing different wall systems, which are Brick Wall (BW), Cellular Concrete Wall (CCW), Concrete Block Wall (CBW), and Izocrete Block Wall (IBW). The thermal performance of a wall system is characterized by its surface temperature when exposed to solar radiation. Preliminary results indicate that the new technology of wall systems plays a vital role in reducing temperature swings, which leads to reducing the internal temperature and thus promotes the building's energy efficiency. The IBW was found to be efficient and best during the test period, followed by CCW.
building technology, sustainability, energy efficiency, thermal performance, brick wall system, simulation, thermal comfort
Reducing energy consumption and related pollutants emissions have been studied thoroughly during the last decades. In Iraq, the residential sector contributes to 48% of the total energy consumption [1-3]. In the European Union, the building sector energy consumption represents 40% which contributes to 33% of the energy related pollutant emissions [4, 5]. In general, the increasing demand for space heating and cooling in the residential sector resulted in increasing energy consumption worldwide which represents 20% of the global energy consumption and greenhouse gas emissions. In Denmark, 25% of the energy consumption goes to residential heating demand [6]. The Iraqi energy supply and demand between 2018 and 2030 have been studied by The International Energy Agency (IEA) which showed a dramatic increase in power demand after 2018. Increasing the power supply would not solve the problem unless embracing an energy efficiency and management strategies and considering a greener resource of energy [7]. Forcing strict policies such as carbon tax or improved building insulation can lead to 84% decarbonization of residential heating [8, 9]. Encouraging energy-saving behavior could reduce the building sector's energy needs by 47% in 2050 and 61% in 2100. The energy-saving practice could be achieved by using building insulation materials and more efficient heating and cooling devices [10].
Energy demand for cooling, heating, and water heating in four countries (United States, Europe, India, and China) could be decreased by adopting energy efficiency strategies in buildings which subsequently could decrease global CO2 emissions by 40% by 2050 [11]. In developed countries, building codes can be an effective policy instrument to reduce energy consumption [12]. On the other hand, in developing countries, the residential energy demand is expected to increase due to the rapid expansion of the building sector and increased income. In contrast, implementing energy-efficient strategies in buildings is optional due to the high initial cost compared to traditional buildings [1, 13].
1.1 Current electrical energy problems in Iraq
Iraq's electricity supply crisis started in the 1990s. The electricity generation system was damaged during the Gulf War in 1991, and only 50% of the systems have been recovered. After 2003, the rise in family income increased the usage of electrical appliances, and the population growth increased energy demand for the residential sector. However, the Iraqi power sector could not generate and supply sufficient power to satisfy demand [14, 15]. To overcome this shortage in electricity, local neighborhood generators were used all over the country. Although the electricity supply increased by 33% over the past five years, the maximum grid supply is still below the electricity demand [7]. In 2022, the Iraqi electricity design capacity was 37,149 MW; however, only 22.250 MW was produced, while the peak daily electricity demand was 36,560 MW [16]. The electricity supply increased from 38.62 TWh in 2010 to 105.8 TWh in 2019 Figure 1. With the increase in energy consumption and the high rate of population growth (1 million per year), electricity demand might reach 150 TWh by 2030 [7].
Figure 1. Supplied electricity 2010-2019 [1]
Increasing the power supply would not solve the problem without decreasing the energy consumption of the residential sector. Improving the building envelope, including building materials for walls, roofs, doors, and windows, can result in a more energy-efficient building. For example, in a hot climate, reducing heat gain in houses through low-cost local materials such as cool roofs and shading might reduce cooling loads [17, 18].
1.2 The climate zones in Iraq
Climate characteristics influence the energy used for cooling and heating. Understanding the climate characteristics of the region is vital to adopt the appropriate building technology, achieving thermal comfort, and reducing energy consumption. The climate in Iraq can be described as a continental and subtropical semi-arid climate. The two main seasons in Iraq are summer and winter, with short transitional periods between them. Summer in Iraq is the most extended season with a hot to scorching temperature. In winter, the temperature may vary between cool to cold. The privilege wind in Iraq is north-westerly. A dry wind carried with dust also blows south and southeast from April to June and September to November [19].
1.3 Walls system construction in Iraq
Houses in Iraq were mainly consisted of two floors and constructed using the load-bearing walls technique. The traditional and most common building materials used for wall construction in Iraq are clay brick (hollow and solid), concrete blocks (hollow and solid), and Thermostone. Since walls represent about 50% of the building envelope, which is exposed to the sun, in addition to the roof and ground, they are responsible for transferring heat from and to the house. To improve the thermal insulation of walls, the Iraqi code of Buildings thermal insulation suggests using various insulation material types, such as polystyrene and mineral wool, on the internal surface of the wall. Building regulations do not have any policy that forces people to use a specific value for wall insulation. Therefore, people tend to disregard using insulation material due to its high cost [20-22]. Many types of research focused on finding alternative building materials that can provide more thermal insulation than traditional materials and have less harm to the environment or improve the thermal quality of the traditional building materials. In Morocco, three types of unfired brick were tested as a sustainable alternative to building materials with better thermal properties and low embodied energy [23, 24]. Material embodied energy represents the energy used to manufacture and produce the material and the energy used to transport the material to construction sites. Using a cleaner energy source during the production process and reducing the distance that the material cross during transportation can reduce its environmental impact [25]. The vernacular building materials used in Basra were studied in three microclimate zones (Marshland district, Desert area, and City center). It was found that the most common building materials used in these regions are mineral materials (clay and brick), organic materials (reeds, straw, and wood), and mixture materials (clay straw). Those materials are characterized to be low-cost and available building materials with decent thermal properties and low embodied energy [26]. Only some methods have been suggested to improve the thermal properties of the traditional load-bearing wall in Iraq. Comparing the thermal resistance of stone, clay brick, and concrete block walls showed that the stone wall has the highest thermal resistance, followed by clay brick and the least concrete block wall. It was also found that the binding material and the gypsum coating layer have a negligible effect on the thermal properties of the wall. On the other hand, including two air cavities (internally and externally) improved the thermal properties of the wall [22]. A comparative study tested the energy-saving capability of vernacular building materials of the region and compared them with autoclaved aerated concrete (AAC) based on their thermal performance. It was found that the vernacular building material is more energy efficient than the AAC because of its high thermal mass [27]. Improving the thermal properties of concrete has been studied intensively. Replacing some materials, such as cement in concrete, with a more sustainable alternative, such as lime and fly ash, can increase its thermal properties and reduce its embodied energy. It is also characterized to be a lightweight material with a lower thermal conductivity and high thermal mass that can provide thermal comfort and reduce energy consumption [28, 29].
The scope of this research consists of assessing thermal performances using different wall systems. The thermal performance of a wall system is characterized by the surface temperature (Tsu) when exposed to solar radiation. Four types, Brick Wall (BW), Cellular Concrete Wall (CCW), Concrete Block Wall (CBW), and Izocrete Block Wall (IBW), widely used in the Iraqi construction industry, have been modeled using the AutoCAD software program. After that, a validated thermal performance analysis tool, THERM (U.S. Department of Energy), was used to test different scenarios so that the overall results could be compared and the initial hypothesis could be proven. All simulated models have been compared against a BaseCase model. Weather data condition obtained from the Iraqi Agrometeorological Center for Karbala city was used, and data for 2021 was analyzed. June was selected as the warmest month of this year. After that, day and night temperature behaviors were selected for comparison using graphs on excel software for the peak and higher temperature differences days. Moreover, to determine if there was any significant difference in the thermal performance of the selected systems, a statistical analysis, a one-way analysis of variance (ANOVA) test, was conducted using the SPSS software program to compare the effect of multiple temperature levels. Furthermore, to determine the relationship between the thermal performances of wall systems and the most effective wall system with the best thermal performance by reducing the temperature swings, Figure 2.
Figure 2. Research framework and phases
2.1 Research hypothesis
The omnibus hypothesis for our data of interest assumes no significant difference between Tsu for all wall systems, while the alternative assumes a significant difference. Since the research aims to prove or disprove the initial hypothesis, ANOVA using SPSS software will be carried out, and tables will be produced for each wall system data comparison based on the following:
H0: assumes the indoor Tsu means are equal.
HA: not all the indoor Tsu means are equal.
2.2 Data analysis
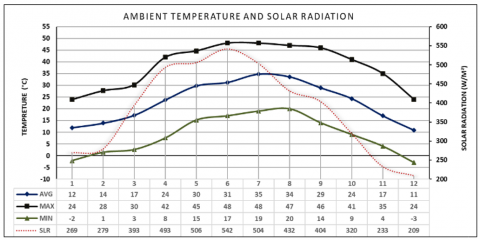
In Karbala, the summers are long, sweltering, and clear, and the winters are cold, dry, and mostly clear. The average monthly ambient temperature for 2021 was 23℃. Maximum, and minimum values registered were 35℃ and 11℃, respectively. An average temperature difference of 24℃ between day and night was recorded, and it is rarely below 2℃ or above 47℃. The month of July was selected to understand the thermal performance of the wall systems and to develop more reliable and precise results for this period. Figure 3 shows the monthly recorded data for the ambient temperatures and solar radiation. The average ambient temperatures for July 2021 vary between 48℃ during the day and 19℃ during the night. An average temperature difference of 28℃ between day and night was recorded. The average solar radiation of 504 W/m² was recorded with a maximum value of 555 W/m². Figure 4 shows the daily recorded data for the ambient temperatures and solar radiation.
Figure 3. Weather condition for 2021
Figure 4. Weather condition for July 2021
The thermal performance of the wall systems under investigation was evaluated by testing and analyzing the surface temperature across the walls. These temperatures were used for detailed explanations based upon:
The peak (July 21) and higher difference in temperature behaviors between day and night (July 10) for the days under consideration are shown in Table 1.
Table 1. Weather conditions for the days under consideration
|
ΔT ℃ |
Min ℃ |
Max ℃ |
Ambient Temp. ℃ |
Max. Solar Radiation (W/m²) |
Date |
|
17 |
32 |
49 |
41 |
479 |
July 21 |
|
19 |
28 |
47 |
38 |
519 |
July 10 |
All measurements are applied to help reach the right decisions, and poor-quality measurements result in poor-quality decisions. Each wall system will be analyzed and compared to the BC. A statistical analysis, a one-way analysis of variance (ANOVA) test, was applied to investigate further the thermal performance of the studied technologies. The statistical test was carried out with the statistical analysis program SPSS Statistics. The surface temperature Tsu was used as a dependent variable to evaluate the performance and investigate whether there was a statistically significant difference. The omnibus hypothesis for our data of interest assumes no significant difference between Tsu for the BC and other systems, while the alternative assumes a significant difference.
2.3 Wall system scenarios
2.3.1 Brick Wall (BW)
Brick is one of the longest-lasting and most robust building materials. The brick was pressed into a mold and then dried in the sun or baked in ovens. This type is considered the BaseCase scenario because it represents the typical-traditional wall system in the building industry market in Karbala. Table 2 shows the pros and cons, Figure 5 shows the layers of the BW.
2.3.2 Cellular Concrete Wall (CCW)
Cellular Concrete (CC) is a construction material consisting of (cement, sand, and water) to which a small percentage of aluminum powder, lime, and gypsum is added, allowing for the construction of load-bearing walls. CC is a very flowable material that can be easily installed using gravity and can be self-leveling. CC is characterized by unique advantages that combine the durability of traditional concrete and the advantages of thermal and acoustic insulation, fire and earthquake resistance, rapid construction, and long life. Make it, therefore, the preferred choice for construction sites. CC is widely used in the building industry market in Karbala. Table 3 shows the pros and cons, Figure 6 shows the layers of the CCW.
Table 2. Pros and cons
|
Pros |
Cons |
|
|
Figure 5. Render view of brick wall
Table 3. Pros and cons
|
Pros |
Cons |
|
|
Figure 6. Render view of cellular concrete wall
2.3.3 Concrete Block Wall (CBW)
Concrete Block (CB) is one of the most widely used building materials due to its low cost, availability of raw materials, and ease of manufacture. CB is commonly used in most construction and architectural works of buildings, such as external and internal walls. Most CBs are of the non-weight bearing type, as they are used to build internal and external walls, especially in structural concrete buildings. Table 4 shows the pros and cons, Figure 7 shows the layers of the CBW.
Table 4. Pros and cons
|
Pros |
Cons |
|
|
Figure 7. Render view of concrete block wall
Table 5. Pros and cons
|
Pros |
Cons |
|
|
Figure 8. Render view of Izocrete block wall
2.3.4 Izocrete Block Wall (IBW)
Izocrete Block (IB) is considered new to the building industry market in the city of Karbala. IB is characterized by a good amount of heat insulation, high tolerance, and good resistance to sound and moisture. Also, it is fast to build and is friendly to all building materials. IB can be assembled as external and internal walls. Table 5 shows the pros and cons, Figure 8 shows the layers of the IBW.
3.1 Analysis of the peak day performance
July 21 was one of the peak days in the data collection period and was selected to evaluate the peak influences of materials under investigation on Tucs. Maximum solar irradiance was 622 W/m², and the maximum temperature was 49℃. More details about the weather condition are presented in Figure 9.
Figure 9. Variation of temperature throughout the day
3.1.1 Thermal performance of CCW vs. BW
The surface temperatures for the BW and CCW plotted against ambient air temperature are reported in Figure 10.
Figure 10. Variation of temperature throughout the day
As seen in the figure above, the average Tsu of CCE was reduced by 6℃ compared to the BW. The Tsu of CCW was at an average of 28℃, while the Tamp was at an average of 41℃, or an average temperature difference of 13℃ between Tsu and Tamb. The amplitude of the Tsu swings of the CCW was 4℃ lower than that of the BW. The peak load was reduced by 6℃, corresponding with a Tamb of 49℃. The maximum Tus of the CCW was 6℃ lower than the maximum Tus of the BW, while the minimum Tus of both the CCW and BW was almost the same. The variance analysis showed a statistically significant difference between Tsu means for BW (M=31.69) and CCW (M=27.69), p=0.0. The analysis of variance confirms the evaluation of the simulation, and the P-value of 0.0 indicates that Tsu is significant in the model as shown in (Table 6).
Table 6. ANOVA results (BW vs. CCW)
|
Source of Variation |
SS |
df |
MS |
F |
P |
|
Wall Systems |
191.98 |
1.00 |
191.98 |
64.64 |
0.00 |
|
Error |
136.61 |
46.00 |
2.97 |
||
|
Total |
328.58 |
47.00 |
3.1.2 Thermal Performance of CBW vs. BW
The surface temperatures for the BC and CBW plotted against ambient air temperature are reported in Figure 11.
Figure 11. Variation of temperature throughout the day
The average Tsu of the CBW compared to the BC was almost the same, with a deference only by about 1℃. The recorded data showed that the Tsu varied between 35℃ and 28℃ for BW; 36.6℃ and 28.4℃ for CBW. The Tamb was at an average of 41℃, while the Tsu of CBW was at an average of 32.7℃. The amplitude of the Tsu swings of the CBW was 1℃ higher than that of the BW. The variance analysis showed a statistically insignificant difference between Tsu means for BW (M=31.69) and CBW (M=32.75), p=0.14. The results in (Table 7) confirms the evaluation of the simulation, and the P-value of 0.14 indicates that Tsu is insignificant in the model.
Table 7. ANOVA results (BW vs. CBW)
|
Source of Variation |
SS |
df |
MS |
F |
P |
|
Wall Systems |
13.40 |
1.00 |
13.40 |
2.27 |
0.14 |
|
Error |
271.72 |
46.00 |
5.91 |
||
|
Total |
285.11 |
47.00 |
3.1.3 Thermal performance of IBW vs. BW
The surface temperatures for the BC and IBW plotted against ambient air temperature are reported in Figure 12.
Figure 12. Variation of temperature throughout the day
As seen in the figure above, the average Tsu of IBW was reduced by 5℃ compared to the BW, corresponding with Tamb of 41℃, or an average temperature difference of 15℃ between Tsu and Tamb. The amplitude of the Tsu swings of the IBW was 6℃ lower than that of the BW. The peak load was reduced by 8℃, corresponding with a Tamb of 49℃. The maximum Tsu of the IBW was 8℃ lower than the maximum Tsu of the BW, while the minimum Tsu of IBW was 2.3℃ lower than that of BW. The variance analysis (Table 8) showed a statistically significant difference between Tsu means for BW (M=31.69) and IBW (M=26.39), p=0.00. The analysis of variance confirms the evaluation of the simulation, and the P-value of 0.00 indicates that Tsu is significant in the model.
Table 8. ANOVA results (BW vs. IBW)
|
Source of Variation |
SS |
df |
MS |
F |
P |
|
Wall Systems |
337.26 |
1.00 |
337.26 |
128.13 |
0.00 |
|
Error |
121.08 |
46.00 |
2.63 |
||
|
Total |
458.33 |
47.00 |
3.2 Analysis of the high-temperature swings day performance
July 10 was the high-temperature swing day in the data collection period and was selected to evaluate the peak influences of materials under investigation on Tucs. Maximum solar irradiance was 472 W/m² and the temperature difference between day and night was 19℃. More details about the weather condition are presented in Figure 13.
Figure 13. Variation of temperature throughout the day
3.2.1 Performance of CCW vs. BW
The surface temperatures for the BW and CCW plotted against ambient air temperature are reported in Figure 14.
Figure 14. Variation of temperature throughout the day
As seen in the figure above, the average Tsu of CCE was reduced by only 3.3℃ compared to the BW. The Tsu of CCW was at an average of 27℃, while the Tamp was at an average of 38℃ or an average temperature difference of 11℃ between Tsu and Tamb. The amplitude of the Tsu swings of the CCW was 4.7℃ lower than that of the BW. The peak load was reduced by 5℃, corresponding with a Tamb of 47℃. The maximum Tus of the CCW was 5℃ lower than the maximum Tus of the BW, while the minimum Tus of both the CCW and BW was precisely the same. The variance analysis showed a statistically significant difference between Tsu means for BW (M=30.52) and CCW (M=27.2), p=0.0. The results in (Table 9) confirms the evaluation of the simulation, and the P-value of 0.0 indicates that Tsu is significant in the model.
Table 9. ANOVA results (BW vs. CCW)
|
Source of Variation |
SS |
df |
MS |
F |
P |
|
Wall Systems |
131.22 |
1.00 |
131.22 |
26.71 |
0.00 |
|
Error |
225.98 |
46.00 |
4.91 |
||
|
Total |
357.20 |
47.00 |
|
|
|
3.2.2 Thermal performance of CBW vs. BW
The surface temperatures for the BW and CBW plotted against ambient air temperature are reported in Figure 15.
Figure 15. Variation of temperature throughout the day
The average Tsu of the CBW compared to the BC was almost the same, with a deference only of about 0.9℃. The recorded data showed that the Tsu varied between 34℃ and 26℃ for BW; 35.7℃ and 26.5℃ for CBW. The Tamb was at an average of 38℃, while the Tsu of CBW was at an average of 31.4℃. The amplitude of the Tsu swings of the CBW was 1.2℃ higher than that of the BW. The variance analysis showed a statistically insignificant difference between Tsu means for BW (M=30.52) and CCW (M=31.39), p=0.34. The analysis of variance confirms the evaluation of the simulation, and the P-value of 0.34 indicates that Tsu is insignificant in the model as shown in (Table 10).
Table 10. ANOVA results (BW vs. CBW)
|
Source of Variation |
SS |
df |
MS |
F |
P |
|
Wall Systems |
9.13 |
1.00 |
9.13 |
0.93 |
0.34 |
|
Error |
452.57 |
46.00 |
9.84 |
||
|
Total |
461.70 |
47.00 |
|
|
|
3.2.3 Thermal Performance of IBW vs. BW
The surface temperatures for the BW and IBW plotted against ambient air temperature are reported in Figure 16. The average Tsu of IBW was reduced by 4.4℃ compared to the BW, corresponding with Tamb of 38℃, or an average temperature difference of 12℃ between Tsu and Tamb. The amplitude of the Tsu swings of the IBW was 6.2℃ lower than that of the BW. The peak load was reduced by 8℃, corresponding with a Tamb of 49℃. The maximum Tsu of the IBW was 7.2℃ lower than the maximum Tsu of the BW, while the minimum Tsu of IBW was 1℃ lower than that of BW. The variance analysis showed a statistically significant difference between Tsu means for BW (M=30.52) and IBW (M=26.15), p=0.00. The analysis of variance confirms the evaluation of the simulation, and the P-value of 0.00 indicates that Tsu is significant in the model as shown in (Table 11).
Figure 16. Variation of temperature throughout the day
Table 11. ANOVA results (BW vs. IBW)
|
Source of Variation |
SS |
df |
MS |
F |
P |
|
Wall Systems |
229.84 |
1.00 |
229.84 |
52.43 |
0.00 |
|
Error |
201.67 |
46.00 |
4.38 |
||
|
Total |
431.50 |
47.00 |
|
|
|
3.3 Thermal performances comparison
The surface temperature profiles for the different walls scenarios that were adopted in this investigation on June 21, 10 are reported in Figure 17.
Figure 17. Temperature behavior for all tested systems
It is clear from the above figure that the thermal behavior of the wall systems used in the research has an almost consistent pattern on the days chosen for comparison. Not surprisingly, the CBW had the highest recorded values of Tuc. Although CBW has the same profile as the BW, its thermal behavior is less than that of the BW. CBW shows better thermal performance to ambient temperature. The analysis of variance confirmed the comparison by showing a statistically insignificant difference between surface temperature means for BW and CBW. CCW dropped the surface temperature by about 5.5℃ and 6℃. This wall system shows better thermal performance for the testing period compared to BW. The variance analysis showed a statistically significant difference between surface temperature means for BW and CCW. The IBW system clearly shows its advantage. The reduction in Tsu was 8℃ and 7.3℃ for June 21 and 10, respectively, which was shown to have a dominant effect concerning the BW. Another vital aspect that results from the analysis of the Tsu is that the daily fluctuations of those values are significantly lower for the IBW. During this test period, the Tsu for all wall systems, except CBW, is lower than the BW. Overall, it is observed that the reduction in Tsu for simulation tests treated with different wall systems is in increasing order with respect to IBW, CCW, and BW. As a result, the IBW was the best during this period.
This study arises from the need to put forward passive solutions that can reduce energy usage and improve building comfort by maximizing the building's thermal performance. Thermal efficient buildings are characterized by maintaining a comfortable indoor quality for the occupants. It significantly impacts the occupants in several ways. The most important of which are health and productivity. The person with an uncomfortable indoor quality spends time adapting to the surrounding atmosphere, which wastes many working hours that could be productive if this person has a comfortable atmosphere in terms of internal temperature and humidity. Findings from the current study suggest that thermal wall performance exerts a potent influence on the thermal performance of buildings. Therefore, help to reach the right decisions, and poor-quality measurements result in poor-quality decisions. A general conclusion is that the investigated wall systems can be arranged in descending order according to their performance as IBW, CCW, and BW.
Establishing a real-time test can confirm or amend the outcomes of this study. Hence, the most important limitation of this research would be the need for an experimental complement to the model. Utilizing experimental tests, some other correlations, such as the effect of humidity on the wall system, can be profoundly analyzed. Further research can be directed at obtaining wall systems with high thermal performance. The wall systems used in the market can be developed to be applied to buildings to achieve long-term efficiency. A wide range of wall samples can be tested for further studies, including the shapes, dimensions, and material quality of different products. Beyond doubt, these sustainable systems are worth investigating due to their construction simplicity, availability, low cost, and excellent bioclimatic benefits.
|
Tsu |
Surface Temperature |
|
Tamb |
Ambient Temperature |
|
BW |
Brick Wall |
|
CCW |
Cellular Concrete Wall |
|
CBW |
Concrete Block Wall |
|
IBW |
Izocrete Block Wall |
[1] Istepanian, H.H. (2020). Towards Sustainable Energy Efficiency in Iraq. Friedrich Ebert Stiftung-Al-Bayan Center for Planning and Studies. https://www.bayancenter.org/en/wp-content/uploads/2020/08/16449.pdf.
[2] Sultan, F.A. (2019). Determine the electrical energy saving in residential sector of Iraq. American Scientific Research Journal for Engineering, Technology, and Sciences (ASRJETS), 58(1): 1-11. https://core.ac.uk/download/pdf/235050865.pdf.
[3] Mohamed, H., Chang, J.D., Alshayeb, M. (2015). Effectiveness of high reflective roofs in minimizing energy consumption in residential buildings in Iraq. Procedia Engineering, 118: 879-885. https://doi.org/10.1016/j.proeng.2015.08.526
[4] Slabe-Erker, R., Dominko, M., Bayar, A., Majcen, B., Primc, K. (2022). Energy efficiency in residential and non-residential buildings: Short-term macroeconomic implications. Building and Environment, 222: 109364. https://doi.org/10.1016/j.buildenv.2022.109364
[5] Siddique, M.B., Bergaentzlé, C., Gunkel, P.A. (2022). Fine-tuning energy efficiency subsidies allocation for maximum savings in residential buildings. Energy, 258: 124810. https://doi.org/10.1016/j.energy.2022.124810
[6] Daioglou, V., Mikropoulos, E., Gernaat, D., van Vuuren, D.P. (2022). Efficiency improvement and technology choice for energy and emission reductions of the residential sector. Energy, 243: 122994. https://doi.org/10.1016/j.energy.2021.122994
[7] Agency, I.E. (2019). A roadmap to a brighter future iraq’s energy sector. https://www.iea.org/reports/iraqs-energy-sector-a-roadmap-to-a-brighter-future, accessed on Nov. 2, 2022.
[8] Knobloch, F., Pollitt, H., Chewpreecha, U., Daioglou, V., Mercure, J.F. (2019). Simulating the deep decarbonisation of residential heating for limiting global warming to 1.5 C. Energy Efficiency, 12: 521-550. https://doi.org/10.1007/s12053-018-9710-0
[9] Alyasari, H.I., Altaweel, M.D., Attya, H. (2022). User Habits Impact on Winter Energy Consumption in Iraqi Houses. Kerbala Journal for Engineering Science, 2(2): 129-144.
[10] Levesque, A., Pietzcker, R.C., Luderer, G. (2019). Halving energy demand from buildings: The impact of low consumption practices. Technological Forecasting and Social Change, 146: 253-266. https://doi.org/10.1016/j.techfore.2019.04.02
[11] Global buildings performance network, & Central european university. (2012). Best Practice Policies for Low Carbon & Energy Buildings: Based on Scenario Analysis. Global buildings performance network.
[12] Edelenbosch, O.Y., Rovelli, D., Levesque, A., Marangoni, G., Tavoni, M. (2021). Long term, cross-country effects of buildings insulation policies. Technological Forecasting and Social Change, 170: 120887. https://doi.org/10.1016/j.techfore.2021.120887
[13] Alessio, M., Byers, E., Poblete-Cazenave, M., Shonali, P. (2021). Global scenarios of residential heating and cooling energy demand and CO2 emissions. Climatic Change, 168(3-4): 1-26. https://doi.org/10.1007/s10584-021-03229-3.
[14] Altai, H.D.S., Abed, F.T., Lazim, M.H., ALRikabi, H.T.S. (2022). Analysis of the problems of electricity in Iraq and recommendations of methods of overcoming them. Periodicals of Engineering and Natural Sciences, 10(1): 607-614. http://dx.doi.org/10.21533/pen.v10i1.2722
[15] Istepanian, H.H. (2014). Iraq's electricity crisis. The Electricity Journal, 27(4): 51-69. https://doi.org/10.1016/j.tej.2014.04.006
[16] Istepanian, N.R.H. (2022). A Roadmap To Prepare Iraqs’ Power Sector For Energy Transition. Amman: Friedrich Ebert Stiftung. https://www.bayancenter.org/en/wp-content/uploads/2020/08/16449.pdf, accessed on Nov. 2, 2022.
[17] IEA. (2019). The Critical Role of Buildings, IEA, Paris https://www.iea.org/reports/the-critical-role-of-buildings, License: CC BY 4.0
[18] Mills, R., Salman, M. (2020). Powering Iraq: Challenges Facing the Electricity Sector in Iraq. Al-Bayan Center for Planning and Studies: Baghdad, Iraq, pp. 1-30.
[19] Group, W.B. (2021). Climate Change Knowledge Portal- Iraq. World Bank. Available: https://climateknowledgeportal.worldbank.org/country/iraq/climate-data-historical
[20] Algburi, O., Beyhan, F. (2019). Cooling load reduction in a single–family house, an energy–efficient approach. Gazi University Journal of Science, 32(2): 385-400.
[21] Department, B. (2022). Iraqi code for buildings thermal insulation. Ministry of Construction, Housing, Municipalities and Public Works. https://moch.gov.iq/en.
[22] Najim, K.B. (2014). External load-bearing walls configuration of residential buildings in Iraq and their thermal performance and dynamic thermal behaviour. Energy and buildings, 84: 169-181. https://doi.org/10.1016/j.enbuild.2014.07.064
[23] El Azhary, K., Raefat, S., Laaroussi, N., Garoum, M. (2018). Energy performance and thermal proprieties of three types of unfired clay bricks. Energy Procedia, 147: 495-502. https://doi.org/10.1016/J.EGYPRO.2018.07.059
[24] Adly, B., & El-Khouly, T. (2022). Combining retrofitting techniques, renewable energy resources and regulations for residential buildings to achieve energy efficiency in gated communities. Ain Shams Engineering Journal, 13(6), 101772. https://doi.org/10.1016/j.asej.2022.101772
[25] Pittet, D., Jagadish, K.S., Kotak, T., Vaghela, K., Zaveri, P., Sareshwala, H., Gohel, J. (2012). Environmental Impacts of Building Technologies: A Comparative Study in Kutch District, Gujarat State, India. Technologies and Innovations for Development: Scientific Cooperation for a Sustainable Future, 113-128. https://doi.org/10.1007/978-2-8178-0268-8_9
[26] Almusaed, A., Almssad, A. (2015). Building materials in eco-energy houses from Iraq and Iran. Case Studies in Construction Materials, 2: 42-54. https://doi.org/10.1016/j.cscm.2015.02.001
[27] Homod, R.Z., Almusaed, A., Almssad, A., Jaafar, M.K., Goodarzi, M., Sahari, K.S. (2021). Effect of different building envelope materials on thermal comfort and air-conditioning energy savings: A case study in Basra city, Iraq. Journal of Energy Storage, 34: 101975. https://doi.org/10.1016/j.est.2020.101975
[28] Kinnane, O., McGranaghan, G., Walker, R., Pavia, S., Byrne, G., Robinson, A. (2015). Experimental investigation of thermal inertia properties in hemp-lime concrete walls. In Proceedings of the 10th conference on advanced building skins, Bern: Author, pp. 942-949.
[29] Rivera, F., Martínez, P., Castro, J., López, M. (2015). Massive volume fly-ash concrete: A more sustainable material with fly ash replacing cement and aggregates. Cement and Concrete Composites, 63: 104-112. https://doi.org/10.1016/j.cemconcomp.2015.08.001