Devianti![]() | Syahrul
| Syahrul![]() | Ridhofa Hafira Afriza
| Ridhofa Hafira Afriza![]() | Agustami Sitorus
| Agustami Sitorus![]() | Dewi Sartika Thamren*
| Dewi Sartika Thamren*![]()
© 2023 IIETA. This article is published by IIETA and is licensed under the CC BY 4.0 license (http://creativecommons.org/licenses/by/4.0/).
OPEN ACCESS
New normal routines have continued to campaign since the COVID-19 pandemic broke out in 2019. One of these new habits is to keep washing your hands after every activity. Hand washing can be done using hand sanitizer or soap and washed in running water. As a result, the need for water to meet the habit of washing hands is expected to affect domestic water needs in a certain area. Therefore, this study aims to estimate the increase in domestic water demand during the COVID-19 pandemic caused by the new routine of washing hands in the research area in the city of Banda Aceh, Indonesia. In addition, this study will also estimate domestic water needs until 2030 if the COVID-19 pandemic has not ended. Innovations in this research can help increase efficiency in water use and help prevent the spread of disease. This study uses a sampling method in several places in Banda Aceh city to obtain data related to the volumetric water used, handwashing time, and frequency of handwashing. Besides, data in water discharge from water supply companies in Banda Aceh city from 2018 to 2020 was also collected. Finally, data on the population of Banda Aceh city was also collected. The information and data are then analyzed using a statistical approach between supply and demand. Although it appears that there is a projected increase in domestic water demand of 1.89% per year due to the COVID-19 pandemic from 2021 to 2030, this is still 41.48% greater than the ability of water supply companies in the city of Banda Aceh to meet domestic water needs up to 2030. In conclusion, if the pandemic continues until 2030, with the expected increase in population, the domestic water needs in Banda Aceh city will still be fulfilled.
Aceh, appropriate technology, environmental, sustainability, natural resources, water
Since the outbreak of the COVID-19 pandemic in 2019, many studies have focused on preventing the spread of the virus. Not only studies related to drugs and medical devices that can help people with COVID-19 but also many studies related to providers of public facilities to reduce the spread of the virus. reports the results of their research related to analyzing the energy needs of an automatic hand sanitizer if it will be applied to the COVID-19 pandemic. In addition, also released the data from his research openly to be used more widely.
New routines during the COVID-19 pandemic also provide new activities that require large natural resources. For example, the habit of using single-use masks will also increase the consumption of natural resources such as materials for making masks. Moreover, a new activity that is no less important is the habit of washing hands with clean water, which creates a large need for clean water . This increase in activity will also impact increasing household water needs . Currently, the availability of clean water in some areas is a problem due to this unexpected increase in demand. One of the reasons for the increased consumption of clean water during the coronavirus pandemic is due to health protocols that require people to wash their hands with water and soap frequently. In addition, many people prefer to buy mineral water rather than water from sources that are not guaranteed to be clean.
The increase in clean water consumption during the COVID-19 pandemic to carry out handwashing activities is unavoidable. This is to avoid the virus COVID-19 . The contribution of each field of science is needed to both be able to solve this problem with their respective expertise. Efforts to ensure the availability of clean water due to new normal activities during the COVID-19 pandemic must be carried out. Infrastructure related to the provision of clean water must also be provided and prepared more thoroughly . Therefore, it is important to know the consumption of clean water for handwashing activities during this pandemic period to make better projections in providing clean water for a particular area. To the best of our knowledge, water consumption to wash hands during the COVID-19 pandemic has not been widely reported.
Therefore, the objective of this study was to predict regional water demand during the COVID-19 pandemic caused by the new activity (handwashing) with the research area in Banda Aceh City, Indonesia. The results of this study are expected to be a reference for water supply companies in estimating the need for clean water in the Banda Aceh city area during the COVID-19 pandemic.
2.1 Population growth prediction on Banda Aceh city
The estimation of the population of Banda Aceh city is approached using the least square method. Several studies have widely used this approach to estimate population growth [16-18]. In general, the increase in population using the least-squares approach can be calculated using Eq. (1). The population data used comes from the Indonesian Central Statistics Agency (BPS, 2021) from 2016 to 2020 (Table 1). With these data, the coefficients a and b can be calculated using Eq. (2) and Eq. (3), respectively. The magnitudes of coefficients a and b are 249.348 and 5.321, respectively. Using this coefficient value makes it possible to estimate the population until 2030.
$P_n=a+b Y_n$ (1)
$a=\frac{\left[\sum(P) \cdot \sum\left(Y^2\right)\right]-\left[\sum(Y) \cdot \sum(P \times Y)\right]}{\left[Y_n \times \sum\left(Y^2\right)\right]-\left[\sum(P)\right]^2}$ (2)
$b=\frac{\left[Y_n \cdot \sum(P)\right]-\left[\sum(Y) \cdot \sum(P)\right]}{\left[Y_n \times \sum\left(Y^2\right)\right]-\left[\sum(P)\right]^2}$ (3)
where, Pn-number of populations in year to-n, a, b- coefficient of least squares, P-number of populations per year, Yn-year to-n, and Y-year.
Table 1. Total population of Banda Aceh city (2016-2020)
|
Year |
Populations (P) |
Y |
Y 2 |
P $X$Y |
|
2016 |
254,904 |
1 |
1 |
254,904 |
|
2017 |
259,913 |
2 |
4 |
519,826 |
|
2018 |
265,111 |
3 |
9 |
795,333 |
|
2019 |
270,321 |
4 |
16 |
1,081,284 |
|
2020 |
276,304 |
5 |
25 |
1,381,520 |
|
Total |
1,326,553 |
15 |
55 |
4,032,867 |
2.2 The water requirement in Banda Aceh city
This study's total domestic water demand consists of household water needs and hydrant water needs. The household water demand for one year is calculated using Eq. (4). The water demand at the hydrant station for one year is calculated using Eq. (5). Besides, due to the COVID-19 pandemic, other activities that require water are washing hands. Based on data obtained from water supply companies in Banda Aceh city, it is known that there are 80% of clean water customers can be served directly to residents' homes, and the rest are served by making hydrant stations.
$W_{h s}=\frac{P_n \times R_{s h s} \times R_{h s} \times D_y}{10^3}$ (4)
$W_{h d}=\frac{P_n \times R_{\text {shd }} \times R_{h d} \times D_y}{10^3}$ (5)
where, Whs-total water demand in households (m3/year), Rshs-presentation of clean water services in households (%), Rhs-level of household water consumption (l/day), Dy-number of days for one year, Whd-total water demand at hydrant stations (m3/year), Rshd-presentation of clean water services at hydrant stations (%), and Rhd-rate of water consumption at hydrant stations (l/day)
The level of household water consumption in Indonesia is known to be 70 l/capita/day. In addition, the consumption level of water use at the hydrant station is 30 l/capita/day. This value is smaller than the level of water use consumption for developed countries reported by Hussien et al. [19], which reached 241 l/capita/day. However, direct observations were carried out for the level of water consumption to wash hands during the COVID-19 pandemic in Banda Aceh city. The water consumption rate for handwashing during the COVID-19 pandemic is calculated using Eq. (6). The total water use for handwashing per year is calculated using Eq. (7).
$R_h=T P D \times V_1$ (6)
$W_h=\frac{P_n \times R_h \times D_y}{10^6}$ (7)
where, Rh-rate of water consumption for washing hands during the COVID-19 pandemic (ml/day), TPD-total per day for washing hands (day-1), V1-volume of water for one hand washing (ml), Wh-total water needs for washing hands during the COVID-19 pandemic for one year (m3/year).
The population was observed in three clusters, i.e., the cluster at the school, the cluster at the traditional market, and the cluster at the household. The number of respondents in each cluster is not less than ten people. The parameters observed were the length of time for washing hands, the total per day for washing hands, and the volume of water used. The duration of the handwashing activity was observed by measuring the time taken by the respondent to wash their hands once using a stopwatch. In addition, the amount of water used by the respondents to wash their hands was also accommodated, and the volume was measured with a measuring glass. After that, respondents were interviewed regarding the total per day to wash their hands during the COVID-19 pandemic.
2.3 Analysis of the percentage of water availability
The volume of water needed in the case study area of this research can be projected more precisely after knowing the level of consumption of each water use activity. Water demand will be estimated for one year in volumetric units of cubic meters (m3), considering the population. After that, data on average water supply for the last three years from water supply companies were collected and analyzed. The percentage of regional water use can then be calculated using Eq. (8). The total area water demand is calculated using Eq. (9).
$U_w=\frac{T_w}{T_s} \times 100 \%$ (8)
$T_W=W_{h s}+W_{h d}+W_h$ (9)
where, Uw-percentage of regional water use (%), Tw-total regional water demand (m3), Ts-total regional water supply (m3).
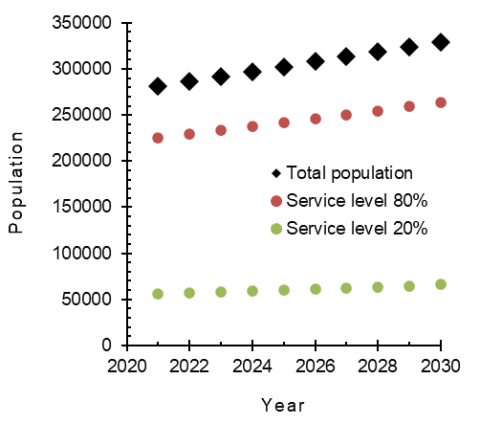
3.1 Prediction of the population in Banda Aceh city
The results of the estimation of the total population from 2021 to 2030 in Banda Aceh city using the least square approach are presented in Figure 1. In addition, the prediction of the total number of residents who can be served through water supply companies in Banda Aceh City directly to the residents’ homes (called water households) about 80% of the total population and another 20% are served at hydrant stations as a collective provider of water for residents. The population increase in this area causes an increase in water supply for households and the hydrant stations. Population increase results from balancing birth and death rates in this study area.
Figure 1. Estimated population of Banda Aceh city from 2020 to 2030
3.2 Handwashing water requirement
The standard of water needs for hand washing during the COVID-19 pandemic has not been widely reported. This makes it difficult to predict the total water needs of a certain area during the COVID-19 pandemic, which is inseparable from the city of Banda Aceh. The total need for handwashing water during the COVID-19 pandemic per person per day in the three main clusters is presented in Table . In general, the time required to wash hands in all observation clusters has been greater than the handwashing time recommended by WHO . According to the World Health Organization (WHO), the recommended time to wash your hands with soap and water is 20 seconds. This is sufficient time to kill germs and bacteria on your hands. In addition, it is essential to ensure that the water and soap touch all parts of the hands, including the palms, wrists, and between fingers.
Table 2. The total need for handwashing water during the COVID-19 pandemic per person per day
|
Location |
Times (s) |
Total per day |
Volume (ml) |
|
School and University |
28.46±10.97 |
7.23±2.76 |
1054.79±579.44 |
|
Traditional Market |
27.45±11.12 |
10.60±5.22 |
867.50±319.87 |
|
Home |
35.70±10.18 |
7.80±1.6 |
855.00±326.69 |
The results show that the home and traditional market clusters provide the fastest time for washing hands. This is presumably because every citizen has understood the importance of washing hands properly so that in the house cluster, the time needed to wash hands is carried out longer.
In addition, the total per day for washing hands is known to be the most found in traditional market clusters. This is probably because residents in traditional market clusters interact more. From that, they often wash their hands after interacting with each other.
The volume of water required to perform one handwashing is greatest in the university and school clusters. This is thought to be influenced by cognitive factors from students at the university and school levels. The volume of water that many students tend to use in washing their hands ensures that their hands have been washed properly and are free of soap residue.
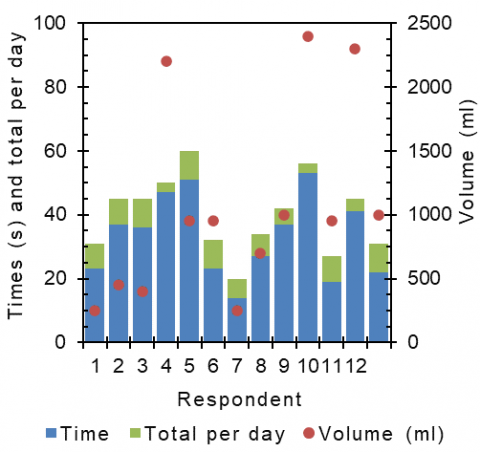
3.2.1 Consumption at the school location
Water consumption for washing hands during the COVID-19 pandemic at the elementary school level is presented in full in Figure 2. The X-axis describes respondents, the Y-axis on the left describes time and total per day, and the Y-axis on the right represents the volume of water used. It can be seen that the average time it takes students to wash is 33.08±12.21 s. The average amount of water used by students was 1061.54±729.9 ml. On average, the total per day for students to wash their hands is 6.67±2.22 times. The longest hand washing time, the largest consumption of handwashing water, and the most frequent total per day for washing hands were 53 s, 2400 ml, 9 times, respectively. The fastest hand washing time, the smallest amount of handwashing water consumption, and the rarest total per day for washing hands were 14 s, 250 ml, 3 times, respectively.
Figure 2. The amount of water used for handwashing in elementary schools location
Water consumption for washing hands during the COVID-19 pandemic at the junior high school level is presented in full in Figure 3. The X-axis describes respondents, the Y-axis on the left describes time and total per day, and the Y-axis on the right represents the volume of water used. It can be seen that the average time it takes students to wash is 18.50±4.61 s. The average amount of water used by students was 1120.0±506.56 ml. On average, the total per day for students to wash their hands is 8.0±2.57 times. The longest hand washing time, the largest consumption of handwashing water, and the most frequent total per day for washing hands were 26 s, 2300 ml, 12 times, respectively. The fastest hand washing time, the smallest amount of handwashing water consumption, and the rarest total per day for washing hands were 12 s, 500 ml, 4 times, respectively.
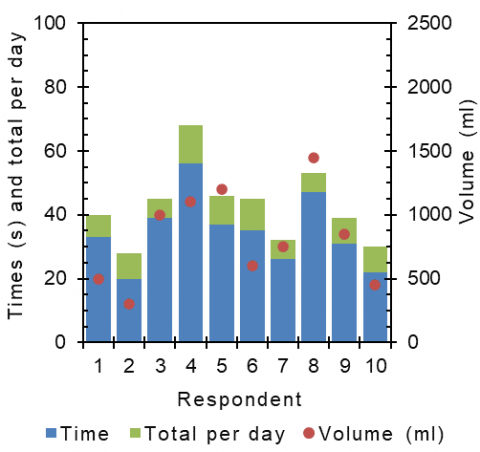
Water consumption for washing hands during the COVID-19 pandemic at the senior high school level is presented in full in Figure 4. The X-axis describes respondents, the Y-axis on the left describes time and total per day, and the Y-axis on the right represents the volume of water used. It can be seen that the average time it takes students to wash is 26.77±4.23 s. The average amount of water used by students was 1200.0±400.0 ml. On average, the total per day for students to wash their hands is 8.38±2.7 times. The longest hand washing time, the largest consumption of handwashing water, and the most frequent total per day for washing hands were 36 s, 2300 ml, 15 times, respectively. The fastest hand washing time, the smallest amount of handwashing water consumption, and the rarest total per day for washing hands were 20 s, 700 ml, 5 times, respectively.
Figure 3. The amount of water used for handwashing in junior high school location
Figure 4. The amount of water used for handwashing in senior high school location
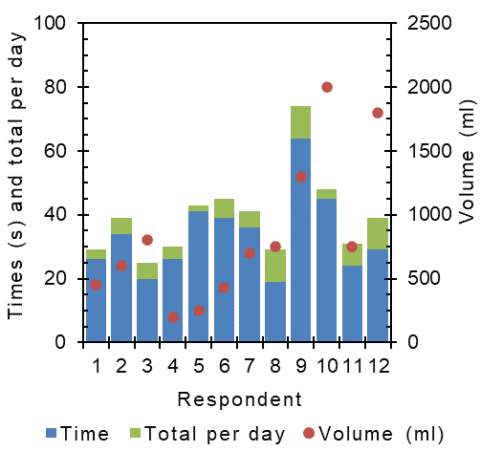
Water consumption for washing hands during the COVID-19 pandemic at the university level is presented in full in Figure 5. The X-axis describes respondents, the Y-axis on the left describes time and total per day, and the Y-axis on the right represents the volume of water used. It can be seen that the average time it takes students to wash is 33.58±12.15 s. The average amount of water used by students was 835.83±551.63 ml. On average, the total per day for students to wash their hands is 5.83±2.73 times. The longest hand washing time, the largest consumption of handwashing water, and the most frequent total per day for washing hands were 64 s, 2000 ml, 10 times, respectively. The fastest hand washing time, the smallest amount of handwashing water consumption, and the rarest total per day for washing hands were 19 s, 200 ml, 2 times, respectively.
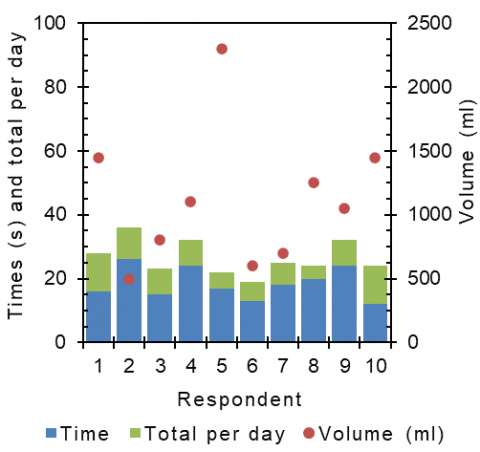
3.2.2 Consumption at the traditional market location
Water consumption for washing hands during the COVID-19 pandemic at the Lampulo traditional market is presented in full in Figure 6. The X-axis describes respondents, the Y-axis on the left describes time and total per day, and the Y-axis on the right represents the volume of water used. It can be seen that the average time it takes respondent to wash is 20.3±5.95 s. The average amount of water used by respondent was 915.0±280.22 ml. On average, the total per day for respondent to wash their hands is 13.2±6.13 times. The longest hand washing time, the largest consumption of handwashing water, and the most frequent total per day for washing hands were 35 s, 1400 ml, 20 times, respectively. The fastest hand washing time, the smallest amount of handwashing water consumption, and the rarest total per day for washing hands were 5 s, 500 ml, 13 times, respectively.
Figure 5. The amount of water used for handwashing in university location
Figure 6. The amount of water used for handwashing in Lampulo traditional market location
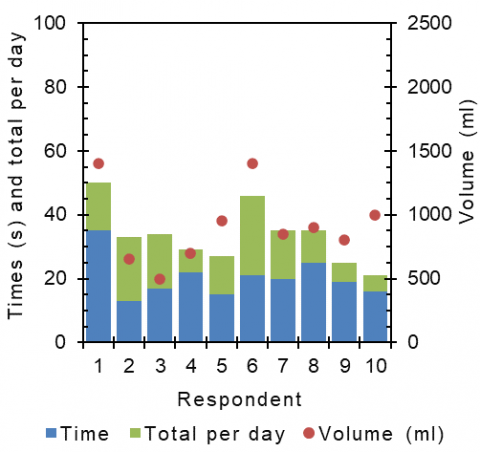
Water consumption for washing hands during the COVID-19 pandemic at the Aceh traditional market is presented in full in Figure 7. The X-axis describes respondents, the Y-axis on the left describes time and total per day, and the Y-axis on the right represents the volume of water used. It can be seen that the average time it takes respondent to wash is 34.6±10.48 s. The average amount of water used by respondent was 820.0±348.71 ml. On average, the total per day for respondent to wash their hands is 8.0±1.84 times. The longest hand washing time, the largest consumption of handwashing water, and the most frequent total per day for washing hands were 56 s, 1450 ml, 12 times, respectively. The fastest hand washing time, the smallest amount of handwashing water consumption, and the rarest total per day for washing hands were 6 s, 450 ml, 20 times, respectively.
Figure 7. The amount of water used for handwashing in Aceh traditional market location
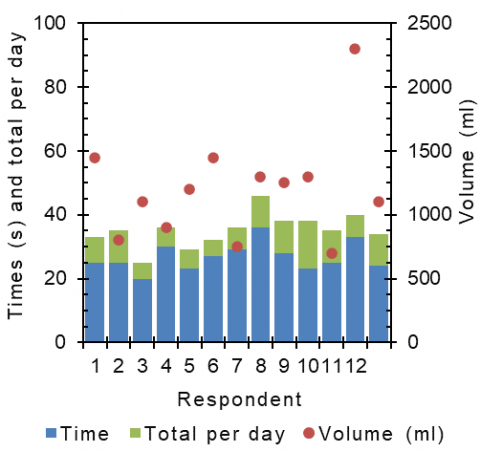
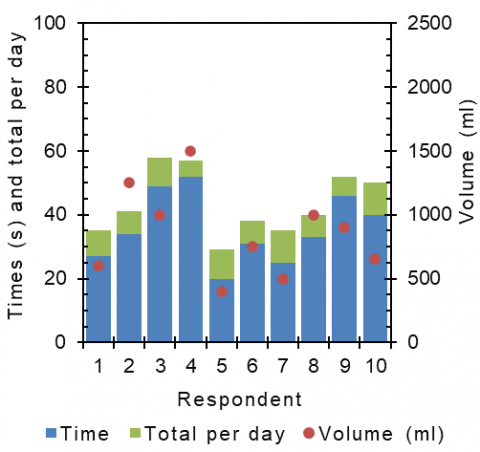
Figure 8. The amount of water used for handwashing in household location
3.2.3 Consumption at the household location
Water consumption for washing hands during the COVID-19 pandemic at the household is presented in full in Figure 8. The X-axis describes respondents, the Y-axis on the left describes time and total per day, and the Y-axis on the right represents the volume of water used. It can be seen that the average time it takes respondent to wash is 35.7±10.18 s. The average amount of water used by respondent was 855.0±326.69 ml. On average, the total per day for respondent to wash their hands is 7.8±1.6 times. The longest hand washing time, the largest consumption of handwashing water, and the most frequent total per day for washing hands were 49 s, 1250 ml, 10 times, respectively. The fastest hand washing time, the smallest amount of handwashing water consumption, and the rarest total per day for washing hands were 20 s, 400 ml, 5 times, respectively.
3.3 Total water needs during the COVID-19 pandemic
During the COVID-19 pandemic, the total water demand that must be supplied to an area will increase in volume. At least the water that must be provided by the water company consists of water supply for household needs, public hydrants, and for handwashing activities during the COVID-19 pandemic. Predictions of water demand for each of these activities between 2021 and 2030 are presented in Table 3. The need for handwashing water has contributed to an increase in the volume of 14.31% of household water needs, or 33.55% greater than water consumption at hydrant stations. The significant difference between water consumption for hand washing and water consumption at hydrant stations is due to the mass use of hydrant stations so that the per capita water consumption level is lower.
Table 3. Prediction of total domestic water demand from 2020 to 2030
|
Year |
Handwashing (m3/year) |
Household (m3/year) |
Hydrant's station (m3/year) |
|
2021 |
822,627 |
5,749,220 |
615,988 |
|
2022 |
838,188 |
5,857,977 |
627,640 |
|
2023 |
853,750 |
5,966,734 |
639,293 |
|
2024 |
869,311 |
6,075,492 |
650,946 |
|
2025 |
884,873 |
6,184,249 |
662,598 |
|
2026 |
900,434 |
6,293,006 |
674,251 |
|
2027 |
915,996 |
6,401,763 |
685,903 |
|
2028 |
931,557 |
6,510,520 |
697,556 |
|
2029 |
947,119 |
6,619,277 |
709,208 |
|
2030 |
962,680 |
6,728,034 |
720,861 |
3.3.1 Estimated water requirement for handwashing
The need for water for hand washing during the COVID-19 pandemic is a citizen need that water supply companies must meet. The standard of the volume of water needed for this activity is not widely known. Based on experimental data in the field, this research can be recommended, especially for Banda Aceh City, that the total water users per day for handwashing is 8.17 times with a volume of 981.15 ml per day.
The standard water requirement for hand washing during the COVID-19 pandemic above can project water needs for this activity until 2030. Considering the number of people living in Banda Aceh City, the total water demand for handwashing increases by 15,562 m3 from year to year. It is projected that in 2030 if the pandemic persists, the water requirement for handwashing will be in the range of 962,680 m3 per year.
3.3.2 Estimated water requirement for household
Household water needs are water consumption used directly by residents in their respective homes. Water supply companies in the city of Banda Aceh claim that they have been able to serve 80% of the water distribution to people's homes. The level of water consumption in the household is also known to be in the range of 70 liters per person per day.
Residents' water needs that water supply companies can directly serve can be predicted until 2030. Total water consumption at the household level will increase by 1.89% from the previous year. It is predicted that in 2030 the water demand at the household level will be in the range of 6,728,034 m3 per year. Water needs at the household level contribute 79.99% of the total water provided by water companies in Banda Aceh city by 2030.
3.3.3 Estimated water requirement for hydrant station
The hydrant station is provided for residents who cannot be served directly by the water supply company. Based on the report of the water supply company, it can be seen that there are only about 20% of residents in Banda Aceh City who use this facility with an average consumption of clean water of 30 liters per person per day.
It is predicted that this hydrant station to serve society will still be available until 2030. The increase in water consumption at this station is estimated to be only 11,653 m3 per year. It is projected that in 2030 the water demand at the hydrant station will be in the range of 720,861 m3 per year. The water consumption of this station is not too significant because it only contributes about 8.57% of the total water demand in 2030.
3.4 Prediction of water availability
The water supply company in the city of Banda Aceh claims that it can supply water of 20,276,749±1,913,332 m3/year. This is already 41.48% greater than the projected total water demand in Banda Aceh City until 2030. The balance of total water demand and availability is presented in Table 4. The ability of clean water supply companies to supply water for residents in Banda Aceh City is estimated to be surplus. However, every year there is an increase in water consumption by 0.67%. In another study, Kim et al. [20] reported that the COVID-19 pandemic increased water demand in the residential sector by 8.08–16.41%. Therefore, water supply companies must be aware of the potential for increasing water demand to avoid water shortages in an area in the future.
Table 4. Water usage balance during the COVID-19 pandemic
|
Year |
Total water requirement (m3/year) |
Usage percentage (%) |
|
2021 |
7,187,835 |
35.45 |
|
2022 |
7,323,806 |
36.12 |
|
2023 |
7,459,777 |
36.79 |
|
2024 |
7,595,748 |
37.46 |
|
2025 |
7,731,720 |
38.13 |
|
2026 |
7,867,691 |
38.80 |
|
2027 |
8,003,662 |
39.47 |
|
2028 |
8,139,633 |
40.14 |
|
2029 |
8,275,604 |
40.81 |
|
2030 |
8,411,576 |
41.48 |
Population growth is one of the factors affecting water demand. The more the population of an area, the greater the need for water needed to meet daily needs such as drinking, cooking, bathing, and so on. In addition, population growth can also lead to an increase in demand for water for industrial and agricultural purposes. However, on the other hand, population growth that is too fast can also cause water shortage problems if an adequate increase does not match in water supply capacity. Therefore, it is important to consider and properly manage the relationship between population growth and water demand in order to achieve a healthy balance.
The demand for water during the COVID-19 pandemic due to the new normal activity in the form of hand washing has been successfully predicted until 2030 to provide more in-depth information for decision-makers. Although the case studies in this research only focus on Banda Aceh city, Indonesia, the application of this approach is very wide open for use in other areas. The water demand in this case study is reported in the surplus category until 2030 even though it is still in a state of the Covid-19 pandemic. It is known that the new normal activity in the form of hand washing contributes to mining water needs by 11.44% of the total water demand each year. In addition, handwashing activities carried out by residents in Banda Aceh city were reported at around 8.17 times with a volume of water of 981.15 ml per day.
On the other hand, household water needs are predicted to contribute 79.99% of the total water provided by water supply companies by the end of 2030. Water supply companies are also still committed to providing water collectively at hydrant stations for residents of Banda Aceh city, with predictions of volume in 2030 is 720,861 m3. Last but not least, the availability of water for the city of Banda Aceh is projected to still have a surplus of more than 50%, even with an increase in water consumption during the COVID-19 pandemic. The water industry should build on these results and use the lessons learned and insights from COVID-19 to prepare its future better.
One of the limitations of this study is that it only predicts the amount of water used for domestic purposes during the COVID-19 pandemic and does not consider the need for water for industrial or agricultural purposes. Further, broader research could include a more in-depth analysis of how the COVID-19 pandemic affects water needs across different sectors and how these needs can be met reasonably and efficiently. It is expected to provide better guidance for future water planning and management.
[1] Sitorus, A., Pramono, E.K., Siregar, Y.H., Rahayuningtyas, A., Susanti, N.D., Cebro, I.S., Bulan, R. (2021). Measurement push and pull forces on automatic liquid dispensers. International Journal of Electrical & Computer Engineering, 11(6): https://doi.org/10.11591/ijece.v11i6.pp4825-4832
[2] Sitorus, A., Cebro, I.S., Devianti, Bulan, R. (2021). Experimental push and pull force data utilizing self-developed automatic liquid dispensers. Data in Brief, 38: 107308. https://doi.org/10.1016/j.dib.2021.107308
[3] Rubio-Romero, J.C., del Carmen Pardo-Ferreira, M., Torrecilla-García, J.A., Calero-Castro, S. (2020). Disposable masks: Disinfection and sterilization for reuse, and non-certified manufacturing, in the face of shortages during the COVID-19 pandemic. Safety Science, 129: 104830. https://doi.org/10.1016/j.ssci.2020.104830
[4] Eikenberry, S.E., Mancuso, M., Iboi, E., Phan, T., Eikenberry, K., Kuang, Y., Kostelich, E., Gumel, A.B. (2020). To mask or not to mask: Modeling the potential for face mask use by the general public to curtail the COVID-19 pandemic. Infectious Disease Modelling, 5: 293-308. https://doi.org/10.1016/j.idm.2020.04.001
[5] Esposito, S., Principi, N. (2020). To mask or not to mask children to overcome COVID-19. European Journal of Pediatrics, 179(8): 1267-1270. https://doi.org/10.1007/s00431-020-03674-9
[6] Amuakwa-Mensah, F., Klege, R.A., Adom, P.K., Köhlin, G. (2021). COVID-19 and handwashing: Implications for water use in Sub-Saharan Africa. Water Resources and Economics, 36: 100189. https://doi.org/10.1016/j.wre.2021.100189
[7] Okoi, O., Bwawa, T. (2020). How health inequality affect responses to the COVID-19 pandemic in Sub-Saharan Africa. World Development, 135: 105067. https://doi.org/10.1016/j.worlddev.2020.105067
[8] Al-Wutayd, O., Mansour, A.E., Aldosary, A.H., Hamdan, H.Z., Al-Batanony, M.A. (2021). Handwashing knowledge, attitudes, and practices during the COVID-19 pandemic in Saudi Arabia: A non-representative cross-sectional study. Scientific Reports, 11(1): 16769. https://doi.org/10.1038/s41598-021-96393-6
[9] Stoler, J., Miller, J.D., Brewis, A., Freeman, M.C. (2021). Household water insecurity will complicate the ongoing COVID-19 response: Evidence from 29 sites in 23 low- and middle-income countries. International Journal of Hygiene and Environmental Health, 234: 113715. https://doi.org/10.1016/j.ijheh.2021.113715
[10] Dzator, J., Acheampong, A.O., Dzator, M., Paolucci, F., Yawe, B.L., Asmah, E.E., Andoh, F.K., Kabagenyi, A., Gillespie, J. (2021). Policy stringency, handwashing and COVID-19 cases: Evidence from global dataset. Health Policy and Technology, 11(2): 100574. https://doi.org/10.1016/j.hlpt.2021.100574
[11] Olupot, P.W., Menya, E., Jjagwe, J., Wakatuntu, J., Kavuma, T., Wabwire, A., Kavuma, S., McMondo, S.O., Nabuuma, B., Kalibbala, H.M. (2021). Development and appraisal of handwash-wastewater treatment system for water recycling as a resilient response to COVID-19. Journal of Environmental Chemical Engineering, 9(5): 106113. https://doi.org/10.1016/j.jece.2021.106113
[12] Sayeed, A., Rahman, M.H., Bundschuh, J., Herath, I., Ahmed, F., Bhattacharya, P., Tariq, M.R., Rahman, F., Joy, M.T.I., Abid, M.T., Saha, N., Hasan, M.T. (2021). Handwashing with soap: A concern for overuse of water amidst the COVID-19 pandemic in Bangladesh. Groundwater for Sustainable Development, 13: 100561. https://doi.org/10.1016/j.gsd.2021.100561
[13] Pesantez, J.E., Alghamdi, F., Sabu, S., Mahinthakumar, G., Berglund, E.Z. (2022). Using a digital twin to explore water infrastructure impacts during the COVID-19 pandemic. Sustainable Cities and Society, 77: 103520. https://doi.org/10.1016/j.scs.2021.103520
[14] Feizizadeh, B., Omarzadeh, D., Ronagh, Z., Sharifi, A., Blaschke, T., Lakes, T. (2021). A scenario-based approach for urban water management in the context of the COVID-19 pandemic and a case study for the Tabriz metropolitan area, Iran. Science of The Total Environment, 790: 148272. https://doi.org/10.1016/j.scitotenv.2021.148272
[15] Giné-Garriga, R., Delepiere, A., Ward, R., Alvarez-Sala, J., Alvarez-Murillo, I., Mariezcurrena, V., Sandberg, H.G., Saikia, P., Avello, P., Thakar, K., Ibrahim, E., Nouvellon, A., El Hattab, O., Hutton, G., Jiménez, A. (2021). COVID-19 water, sanitation, and hygiene response: Review of measures and initiatives adopted by governments, regulators, utilities, and other stakeholders in 84 countries. Science of The Total Environment, 795: 148789. https://doi.org/10.1016/j.scitotenv.2021.148789
[16] Kuniya, T. (2020). Prediction of the epidemic peak of coronavirus disease in Japan, 2020. Journal of Clinical Medicine, 9(3): 789. https://doi.org/10.3390/jcm9030789
[17] Ünal, H.E., Birben, Ü., Bolat, F. (2019). Rural population mobility, deforestation, and urbanization: Case of Turkey. Environmental Monitoring and Assessment, 191(1): 1-12. https://doi.org/10.1007/s10661-018-7149-6
[18] Ozturk, I. (2016). Utilizing biofuels for sustainable development in the panel of 17 developed and developing countries. GCB Bioenergy, 8(4): 826-836. https://doi.org/10.1111/gcbb.12287
[19] Hussien, W.A., Memon, F.A., Savic, D.A. (2016). Assessing and modelling the influence of household characteristics on per capita water consumption. Water Resources Management, 30(9): 2931-2955. https://doi.org/10.1007/s11269-016-1314-x
[20] Kim, D., Yim, T., Lee, J.Y. (2021). Analytical study on changes in domestic hot water use caused by COVID-19 pandemic. Energy, 231: 120915. https://doi.org/10.1016/j.energy.2021.120915