Xiuqun Chen![]() | Shun-Chi Yu*
| Shun-Chi Yu*![]() | Xuemei Sun
| Xuemei Sun![]()
© 2023 IIETA. This article is published by IIETA and is licensed under the CC BY 4.0 license (http://creativecommons.org/licenses/by/4.0/).
OPEN ACCESS
With the rapid development of international education, international schools have become an important part of global education because of their superior education levels, and branding has become the core competitive marker of international schools. Therefore, from the viewpoint of customer perception, this study measured the brand equity of international schools in order to explore the impact of brand equity on customers' willingness to pay premiums for international schools and to provide feasible solutions for international schools regarding brand management and relationship marketing strategy formulation. The results showed that brand trust and brand communication can effectively promote customers' willingness to pay premiums, and customer perception plays an intermediary role.
customer perception, brand equity, sustainable willingness to pay premium, international education industry
The rapid international development of economic integration and information globalization has resulted in the globalization, internationalization, and diversification of education. With the acceleration of the globalization process in the 21st century, the competition between countries, especially the competition between international talents, has become increasingly fierce. The accelerated process of globalization and the public's demand for high-quality and diversified education have promoted the rapid development of international schools in terms of quantity and quality. The numbers of international departments of foreign international schools, private international schools, and public schools have increased, and the competition between schools is also becoming increasingly fierce. Therefore, with the continuous expansion of the scale of international schools and the differentiation of market operation, branding has become the core competitive marker of the development of international schools. Previous studies on the relationship between brand equity and customer behavior mainly focused on customer purchase behavior, such as the influence of brand word of mouth, brand image, or brand association on consumer purchase behavior [1, 2]. The willingness of consumers to pay premiums for brands is mainly reflected in research on luxury brands. However, there has been little research on the branding of international schools.
Due to the differences in the positioning of international schools, their enrollment objects and fees are different. Therefore, brand value is key to the stable development of international schools such that customers are willing to pay tuition fees ten times higher than those of traditional schools. Brand value, i.e., brand equity, ultimately originates from customers' language and behavior [3]. Brand equity refers to consumers' overall perception after collecting brand information. In a buyer's market where goods are increasingly abundant and tend to be homogenized, branding is undoubtedly the most powerful competitive tool in the strategic development of high-quality international schools. The composition of brand equity reflects the dynamic network of various elements in the process of brand strategy. Brand loyalty, brand trust, brand communication, and customer value perception have all become parts of brand equity and the cornerstones of brand management [4]. The brand knowledge structure in the mind of individual customers or organizations is the source or foundation of brand equity [5]. Therefore, consumers are willing to pay premiums for brands due to the perceived brand value of consumers.
Accordingly, this study took Chinese international schools as the research object, built a research model by measuring brand equity, and analyzed the influence mechanism of brand equity on the public’s willingness to pay premiums for international schools. The results of this study can help international schools enhance their brand value, enhance their customer loyalty, and optimize their brand management to promote their healthy and orderly development.
2.1 Brand equity and willingness to pay premiums
A brand is a name, term, logo, drawing, or any combination of these used to identify a company's goods or services and set them apart from competitors' products or services. Companies provide customers with tangible examples of their brand statement through the products and experiences they offer to consumers [6]. Brand equity theory is the core concept of brand management. Since its emergence in the 1980s, it has aroused wide interest in marketing research and practice. The composition of brand equity reflects the dynamic network of various elements in the process of brand communication. A review and summary of the research on brand equity's effect on purchase intention revealed various dimensions of academic research on brand equity's effect on product purchase intention. The dimensions include brand loyalty, brand image, entrepreneur image, brand support, brand resilience, brand innovation, brand extension, brand expansion, brand value, brand publicity, brand awareness, brand loyalty, brand association, and brand trust [7-9]. Although the specific methods used to measure brand equity are different, their essence is the same. Customers' perception of products can be constructed and disseminated by an enterprise through its brand. Brand-related marketing activities constitute consumers' responses to differentiation. These marketing activities result in the key benefits and contribute to the formation of brand equity [10]. Brand value, or brand equity, ultimately derives from customer language and behavior. Customer-based brand equity comes from brand differentiation and brand recognition [11]. Bougenvile and Ruswanti [12] found that brand equity can promote consumers' purchase intention, as brand value plays a key role in the choice of consumers to pay premiums for products. Brand equity and brand identity can influence consumers' behavioral responses and directly affect their decision making, such as their willingness to pay premiums [13]. Therefore, the following research hypotheses were proposed in this study.
H1: Brand trust has a positive effect on willingness to pay premiums.
H2: Brand communication has a positive effect on the willingness to pay premiums.
2.2 Brand equity and customer perception
Brand trust is the core dimension of brand equity. In essence, brand trust is a psychological process used by consumers to evaluate and make decisions about a brand. Some early studies reported that customers' premium payment for products is mainly related to customers' income and age, and younger people with high incomes are more willing to pay premiums [14]. Later, scholars studied luxury goods and proposed that branding is the main reason that customers pay premiums, and consumers' perception of the value of brand equity endowed by consumer self-identity leads to an increased willingness to pay premiums [15]. The richer a company’s brand equity is, the more likely consumers are to prefer the products of that company. Consumers' strong preference for a certain brand can quickly promote their purchase decisions [16]. In relationship marketing, the driving force of the relationship between customers and brands is brand trust. As a high-level emotional driver, brand trust motivates consumers to "go beyond the transaction relationship" because of its stimulation of consumers' emotional goals. It can arouse customers' emotion and sense of belonging, and it can result in a high level of brand loyalty [17].
Brand communication is essentially the embodiment of a brand's status in the minds of consumers. In marketing strategy, brand image, brand cognition, brand personality, and brand experience constitute consumers' overall impression of a brand. The formation of this impression is the result of long-term contact. To some extent, it represents consumers' feelings and attitudes towards a brand, which may also bring potential customers to an enterprise. Different consumers process and extract brand information differently. Adhikari adopted the classification mix method to analyze the influence of food and service experience on consumer behavior in the tourism industry and found that different consumers had different brand experiences. Enterprises can develop different brand experiences for different consumers to strengthen consumers' willingness to pay premiums [18]. Therefore, brand communication can be used to achieve the differentiated needs of consumers, convey the positive attitude of a brand, and makes consumers' evaluation of a product more positive [12]. Ottenbacher et al. [19] also confirmed the view that customers' perception of brand experience can promote customers' continuous purchase behavior. Constant communication between brands and customers results in consumers playing more premiums. Some scholars have also proposed that aspects of brand image, such as entrepreneur image and positive word of mouth, are closely related to customers' willingness to pay premiums [20]. Brand communication is more important for consumers with repeated purchase behaviors. Among other factors, brand image, brand recognition, and brand communication (in particular) affect consumers' purchasing behavior tendency towards products [21]. Therefore, the following research hypotheses were proposed in this study.
H3: Brand trust has a positive impact on customer-perceived value.
H4: Brand communication has a positive impact on customer-perceived value.
H5: Brand trust has a positive impact on customer-perceived quality.
H6: Brand communication has a positive impact on customer-perceived quality.
2.3 Customer perception and willingness to pay premiums
Customers are the basis for the survival of enterprises. The primary purpose of management is to create value for customers, and companies that create value for customers are strong in market competition. The earliest research on customer perception can be traced back to the concept of the "customer value chain" proposed by Drucker [22] in 1954; this concept states that what customers buy and consume is not a simple product but a kind of value and that customer value plays a decisive role in enterprise performance, which lays a solid theoretical foundation for the birth and development of the theoretical system of customer value. Zaithaml et al. [23], Parasuraman, and Berry expanded on this basis and proposed the theory of perceived value. This theory takes customer-perceived value as the determining factor and believes that customer-perceived value is embodied by four aspects: the price perceived by customers, what customers want from a product, the quality customers pay for, and what customers receive.
Since the 1990s, the theory of brand equity has become a hot topic in the field of brand management research, and the academic circle has begun to pay attention to the idea of customers' brand perception. Research perspectives based on customers' brand perception mainly focus on three perspective: the brand psychological perspective, the brand feature perspective, and the brand comprehensive perspective [24, 25]. The common point of these perspectives is the structure of brand knowledge based on customer's mind is diversified and multi-level. Furthermore, these perspectives are increasingly being considered as one integrated perspective. Brand perception is based on customers’ minds and the overall concepts (functional concept, symbolic concept, and experiential concept) of a brand’s emotional attributes (brand image and brand attitude) [26, 27]. The value of a brand to customers is the fundamental reason for the value of a brand to an enterprise. Kasilingam and Krishna [28] reported that for the service industry, customers' perception of the value dimension of a brand strengthens customers' willingness to pay and that personalized demands for services make consumers more willing to pay more money to buy high-value services. Therefore, the following research hypotheses were proposed in this study.
H7: Perceived value has a positive impact on the willingness to pay premiums.
H8: Perceived quality has a positive impact on the willingness to pay premiums.
2.4 The mediating effect of customer perception
Customers' mental reactions to brand perception, trust, and attitude affect customers' behaviors in the product market, thus generating the financial value and capital market value of a brand. When customers are faced with the same products and services, they make decisions according to the perceived value of the brands [29]. In essence, customers' perception of a brand comprises a process that includes the understanding and trust of all relevant brand information elements, as well as loyalty to the process of brand communication.
Kovacs and Keresztes [30] conducted research on the credibility of product value, product health, origin, environment, and ethical issues for sustainable food consumers, and they concluded that consumers' perception affected their sustainable purchase behavior and payment intentions. There was a significant positive correlation between consumers' perceived brand effectiveness and consumers' willingness to pay premiums for sustainable food attributes. Therefore, brand value is primarily reflected in customers-perceived value. Only when customers are satisfied with a brand’s value can the brand be valuable to enterprises, investors, and other partners.
In relationship marketing, brand trust is closely linked with customer psychology. The higher the degree of customer trust in a brand, the higher the customer-perceived value of the brand and the higher the willingness of the customer to pay premiums for the brand. Therefore, customer perception builds a bridge between the influence of brand equity and customers' willingness to pay [31]. Consumers' trust in brands and brand communication promotes consumers' perception of brand value, thus affecting consumers' willingness to pay [32]. Therefore, this study proposed the following research hypotheses.
H9: Perceived value plays a mediating role between brand trust and willingness to pay premiums.
H10: Perceived quality plays a mediating role between brand trust and willingness to pay premiums.
H11: Perceived value plays a mediating role between brand communication and willingness to pay premiums.
H12: Perceived quality plays a mediating role between brand communication and willingness to pay premiums.
3.1 Research sample
The clients or potential clients of international schools in China were studied in this research. Therefore, this study issued questionnaires to students and consulting parents to 4 international schools and 4 overseas study institutions. According to Baumgartner and Homburg's principle of sample size, a sample size should be 5-10 times the size of the item [33]. A total of 400 questionnaires were collected via on-site distribution. Invalid questionnaires (those with inconsistent or incomplete answers) were excluded, and 318 valid questionnaires were collected; the effective recovery rate was 79.5%.
3.2 Research tools
This study formulated the initial structural dimensions of brand equity through literature research, interviews, and expert screening. To confirm to the characteristics of Chinese international school brands, this study organized for the middle and senior management of the interviewed enterprises to hold a symposium to consider the practical situations of their enterprises and to solicit opinions on the initial scale. Finally, the International School Brand Scale was formed; it included 20 items scored with a 5-point Likert scale, with "1 = very inconsistent" and "5 = very consistent".
3.3 Research model
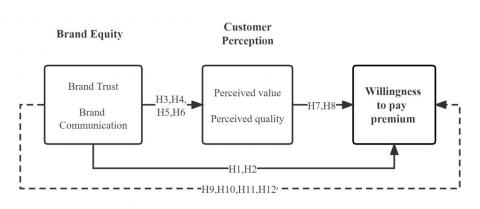
In this study, brand equity was divided into two dimensions of brand trust (BT) and brand communication (BC), and customer perception was divided into two dimensions of perceived value (PV) and perceived quality (PQ). The dependent variable was the willingness to pay premiums (WTPP). The research model contained 12 research hypotheses, including 8 direct research hypotheses and 4 intermediate research hypotheses (see Figure 1).
Figure 1. Theoretical model
4.1 Descriptive statistical analysis
As shown in Table 1, the minimum value was 1, the maximum value was 5, and the mean value was distributed between 3.21 and 3.82, indicating that the score distribution of each question item was reasonable. Skewness and kurtosis were distributed between -1.96 and 1.96, so the scores of each item followed a normal distribution (see Table 1).
Table 1. Descriptive statistical analysis
|
Variable |
N |
Minimum |
Maximum |
Mean |
Standard deviation |
Skewness |
kurtosis |
|
BT1 |
318 |
1 |
5 |
3.59 |
1.188 |
- 0.524 |
- 0.602 |
|
BT2 |
318 |
1 |
5 |
3.52 |
1.062 |
- 0.400 |
- 0.460 |
|
BT3 |
318 |
1 |
5 |
3.47 |
1.105 |
- 0.414 |
-0.603 |
|
BT4 |
318 |
1 |
5 |
3.65 |
1.160 |
- 0.499 |
- 0.663 |
|
BC1 |
318 |
1 |
5 |
3.31 |
1.136 |
- 0.205 |
- 0.740 |
|
BC2 |
318 |
1 |
5 |
3.21 |
1.090 |
0.102 |
- 0.866 |
|
BC3 |
318 |
1 |
5 |
3.22 |
1.055 |
-0.076 |
- 0.561 |
|
BC4 |
318 |
1 |
5 |
3.25 |
1.078 |
- 0.050 |
-0.656 |
|
PV1 |
318 |
1 |
5 |
3.49 |
1.169 |
- 0.277 |
- 0.943 |
|
PV2 |
318 |
1 |
5 |
3.50 |
1.091 |
- 0.366 |
- 0.537 |
|
PV3 |
318 |
1 |
5 |
3.45 |
1.006 |
- 0.264 |
- 0.531 |
|
PV4 |
318 |
1 |
5 |
3.52 |
1.125 |
- 0.134 |
- 0.982 |
|
PQ1 |
318 |
1 |
5 |
3.66 |
932. |
- 0.428 |
-0.143 |
|
PQ2 |
318 |
1 |
5 |
3.82 |
1.017 |
- 0.618 |
- 0.255 |
|
PQ3 |
318 |
1 |
5 |
3.73 |
935. |
- 0.477 |
- 0.085 |
|
PQ4 |
318 |
1 |
5 |
3.72 |
1.008 |
- 0.457 |
- 0.324 |
|
WTP1 |
318 |
1 |
5 |
3.66 |
1.125 |
- 0.572 |
- 0.406 |
|
WTP2 |
318 |
1 |
5 |
3.64 |
1.047 |
- 0.404 |
- 0.523 |
|
WTP3 |
318 |
1 |
5 |
3.64 |
0.955 |
- 0.313 |
- 0.259 |
|
WTP4 |
318 |
1 |
5 |
3.54 |
1.070 |
-0.309 |
- 0.611 |
4.2 Reliability and validity analysis
4.2.1 Reliability analysis
In this study, SPSS was used to conduct reliability analyses and the correction of each item of the scale. The CITC value (> 0.4), Cronbach's alpha value (>0.7), and Cronbach's alpha value after one deletion of all observed variables were compared to modify the scale. According to the data in Table 2, the Cronbach's alpha values of BT, BC, PV, PQ, and WTPP were all greater than 0.7, so there was no need to delete scale items because each dimension showed internal consistency. In addition, most of the CITC values between the observed variables and their latent variables were between 0.4 and 0.7, indicating that the latent variables of each item were well-set and the reliability of the questionnaire was good. Furthermore, after excluding the observed variables, each variable was deleted once. After deletion, the Cronbach's alpha values did not increase, indicating that the variable measurement items had a good reliability.
Table 2. Reliability analysis
|
Variable |
Measurement question item |
CITC |
Item's deleted Cronbach's alpha value |
Cronbach's alpha value |
|
BT |
BT1 |
0.737 |
0.793 |
0.852 |
|
BT2 |
0.627 |
0.838 |
||
|
BT3 |
0.660 |
0.825 |
||
|
BT4 |
0.750 |
0.787 |
||
|
BC |
BC1 |
0.666 |
0.714 |
0.796 |
|
BC2 |
0.570 |
0.762 |
||
|
BC3 |
0.576 |
0.759 |
||
|
BC4 |
0.614 |
0.741 |
||
|
PV |
PV1 |
0.638 |
0.722 |
0.792 |
|
PV2 |
0.581 |
0.751 |
||
|
PV3 |
0.569 |
0.757 |
||
|
PV4 |
0.621 |
0.731 |
||
|
PQ |
PQ1 |
0.734 |
0.835 |
0.873 |
|
PQ2 |
0.700 |
0.849 |
||
|
PQ3 |
0.703 |
0.847 |
||
|
PQ4 |
0.778 |
0.817 |
||
|
WTPP |
WTPP1 |
0.647 |
0.756 |
0.812 |
|
WTPP2 |
0.655 |
0.751 |
||
|
WTPP3 |
0.592 |
0.782 |
||
|
WTPP4 |
0.629 |
0.764 |
4.2.2 Validity analysis
(a) Structural validity analysis
Principal factor analysis was used to explore the principal factor components of the latent variables, and factor rotation was carried out with the maximum orthogonal rotation of variance; factors with an eigenvalue of more than 1 were extracted. According to the data in Table 3, the KMO value was 0.903, indicating that the variable was suitable for factor analysis. Bartlett sphericity test results showed that there were common factors in 20 items (p<0.05, rejecting the null hypothesis).
After factor rotation, the characteristic roots of the 5 factors were all greater than 1, the cumulative variance interpretation rate reached 66.569%, and the factor loading of each item was greater than 0.4, indicating the good structural validity of the scale.
Table 3. Convergent validity analysis
|
Variable |
Item |
Ingredients |
||||
|
1 |
2 |
3 |
4 |
5 |
||
|
BT |
BT1 |
0.777 |
|
|
|
|
|
BT2 |
0.785 |
|
|
|
|
|
|
BT3 |
0.757 |
|
|
|
|
|
|
BT4 |
0.782 |
|
|
|
|
|
|
BC |
BC1 |
|
|
0.756 |
|
|
|
BC2 |
|
|
0.738 |
|
|
|
|
BC3 |
|
|
0.723 |
|
|
|
|
BC4 |
|
|
0.728 |
|
|
|
|
PV |
PV1 |
|
|
|
|
0.439 |
|
PV2 |
|
|
|
|
0.546 |
|
|
PV3 |
|
|
|
|
0.489 |
|
|
PV4 |
|
|
|
|
0.558 |
|
|
PQ |
PQ1 |
|
0.798 |
|
|
|
|
PQ2 |
|
0.757 |
|
|
|
|
|
PQ3 |
|
0.797 |
|
|
|
|
|
PQ4 |
|
0.818 |
|
|
|
|
|
WTPP |
WTP1 |
|
|
|
0.764 |
|
|
WTP2 |
|
|
|
0.797 |
|
|
|
WTP3 |
|
|
|
0.764 |
|
|
|
WTP4 |
|
|
|
0.756 |
|
|
|
KMO |
0.903 |
|||||
|
Bartlett's sphericity test |
2966.253 (sig = 0.000) |
|||||
|
Eigenvalue |
7.387 |
1.937 |
1.696 |
1.411 |
1.083 |
|
|
Variance contribution rate % |
18.920 |
15.519 |
14.569 |
13.147 |
4.413 |
|
|
Cumulative Contribution Rate % |
66.569 |
|||||
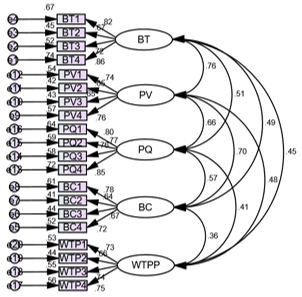
(b) Confirmatory factor analysis
Figure 2. Confirmatory factor analysis
In this study, a confirmatory factor model was constructed with AMOS. Confirmatory factor analysis is a type of statistical analysis of survey data. This method is used to test whether the relationship between a factor and the corresponding observed variable is consistent with the theoretical relationship preset by the researcher. Its purpose is to test the consistency of a theory against data from a theoretical hypothesis (see Figure 2).
1) The fit degree of the model
According to the data analysis in Table 4, $x^2 / d f=1.536$, GFI = 0.928, AGFI = 0.908, NFI = 0.919, IFI = 0.970, and CFI = 0.970. The model fit index was greater than 0.9 and RMSEA = 0.041 (<0.08), indicating that the model fit was good.
2) Convergence validity analysis
It can be seen in Table 5 that the standardized factor loading of each item was greater than 0.5, and the significance was p<0.001, indicating that each item could well-explain the latent variables. Furthermore, the combined reliability (CR) and AVE of each dimension was greater than 0.7, indicating that the convergence validity of the scale was good.
(c) Correlation and discriminant validity analysis
(d) According to the data in Table 6, the correlation coefficients of each dimension were 0.382**, 0.381**, 0.616**, 0.406**, 0.285**, 0.552**, 0.467**, 0.384**, 0.361**, 0.545**, thus indicating that each dimension had a significant positive correlation. The square roots of the AVE were calculated as 0.873, 0.838, 0.834, 0.838, and 0.849, which were all larger than the correlation coefficients among all dimensions, thus indicating that the scale had good discriminative validity.
Table 4. Fitting degree analysis of the model
|
Indicators |
$x^2 / d f$ |
GFI |
AGFI |
IFI |
CFI |
NFI |
RMSEA |
|
Index |
1.536 |
0.928 |
0.906 |
0.970 |
0.970 |
0.919 |
0.041 |
|
Standard |
< 3 |
> 0.8 |
> 0.8 |
> 0.9 |
> 0.9 |
> 0.9 |
< 0.08 |
|
Fitness |
Fit |
Fit |
Fit |
Fit |
Fit |
Fit |
Fit |
Table 5. Confirmatory factor analysis
|
Item |
Estimate |
S.E. |
C.R. |
p |
CR |
AVE |
||
|
BT1 |
<--- |
BT |
0.858 |
- |
- |
- |
0.853 |
0.767 |
|
BT2 |
<--- |
BT |
0.721 |
0.057 |
14.089 |
*** |
||
|
BT3 |
<--- |
BT |
0.674 |
0.056 |
12.896 |
*** |
||
|
BT4 |
<--- |
BT |
0.816 |
0.059 |
16.547 |
*** |
||
|
BC1 |
<--- |
BC |
0.719 |
- |
- |
- |
0.797 |
0.703 |
|
BC2 |
<--- |
BC |
0.667 |
0.087 |
10.483 |
*** |
||
|
BC3 |
<--- |
BC |
0.644 |
0.089 |
10.156 |
*** |
||
|
BC4 |
<--- |
BC |
0.780 |
0.096 |
11.877 |
*** |
||
|
PV1 |
<--- |
PV |
0.756 |
- |
- |
- |
0.792 |
0.697 |
|
PV2 |
<--- |
PV |
0.653 |
0.070 |
11.081 |
*** |
||
|
PV3 |
<--- |
PV |
0.645 |
0.076 |
10.941 |
*** |
||
|
PV4 |
<--- |
PV |
0.735 |
0.081 |
12.510 |
*** |
||
|
PQ1 |
<--- |
PQ |
0.850 |
- |
- |
- |
0.874 |
0.796 |
|
PQ2 |
<--- |
PQ |
0.763 |
0.055 |
15.238 |
*** |
||
|
PQ3 |
<--- |
PQ |
0.769 |
0.059 |
15.388 |
*** |
||
|
PQ4 |
<--- |
PQ |
0.803 |
0.054 |
16.291 |
*** |
||
|
WTP1 |
<--- |
WTPP |
0.750 |
- |
- |
- |
0.813 |
0.721 |
|
WTP2 |
<--- |
WTPP |
0.744 |
0.079 |
11.744 |
*** |
||
|
WPP3 |
<--- |
WTPP |
0.664 |
0.071 |
10.642 |
*** |
||
|
WTP4 |
<--- |
WTPP |
0.725 |
0.080 |
11.507 |
*** |
||
Note: *** p < 0.001; ** p < 0.01; * p < 0.05
Table 6. Discriminant validity analysis
|
Correlation |
BT |
BC |
PV |
PQ |
WTPP |
|
BT |
0.873 |
|
|
|
|
|
BC |
0.382** |
0.838 |
|
|
|
|
PV |
0.381** |
0.285** |
0.834 |
|
|
|
PQ |
0.616** |
0.552** |
0.384** |
0.838 |
|
|
WTPP |
0.406** |
0.467** |
0.361** |
0.545** |
0.849 |
Note: ***p < 0.001; ** p < 0.01; * p < 0.05.
4.2.3 Path Analysis
In this study, AMOS software was used to conduct the factor and path analysis of variables, and the research hypothesis was verified with SEM (see Figure 3).
(a) Model fit analysis
As shown in Table 7, each model fitting degree index of the SEM met the standard and the model fitting degree was good.
Figure 3. Brand equity influences the path of premium payment willingness
Table 7. Model fitting degree
|
Indicators |
$x^2 / d f$ |
GFI |
AGFI |
TLI |
CFI |
RMSEA |
|
Index |
1.604 |
0.925 |
0.902 |
0.960 |
0.966 |
0.044 |
|
Standard |
< 3 |
> 0.8 |
> 0.8 |
> 0.9 |
> 0.9 |
< 0.08 |
|
Fitness |
Fit |
Fit |
Fit |
Fit |
Fit |
Fit |
(b) Direct path analysis
According to Table 8, of the 8 proposed hypotheses, seven were confirmed and one was not supported.
There was a significant positive correlation between BT and PV (β = 0.549, p<0.05), indicating that the higher the BT, the stronger the PV.
There was a significant positive correlation between BT and PQ (β = 0.301, p<0.05), indicating that the higher BT, the stronger the PQ.
BC and PV were significantly positively correlated (β = 0.449, p<0.05), indicating that the higher the BC, the stronger the PV.
BC and PQ were significantly positively correlated (β = 0.452, p<0.05), indicating that the higher BC, the stronger the PQ.
PV was significantly positively correlated with WTPP (β = 0.212, p<0.05), indicating that the stronger PV, the stronger the WTPP.
PQ was significantly positively correlated with WTPP (β = 0.167, p<0.05), indicating that the stronger PQ, the stronger the WTPP.
BT was significantly positively correlated with WTPP (β = 0.196, p<0.05), indicating that the stronger BT, the stronger the WTPP.
BC was not correlated with WTPP (β = 0.017, p>0.05), indicating that BC could not affect WTPP.
(c) Mediation effect analysis
In this study, AMOS was used to run Bootstrap method, with 5000 replicates selected, confidence interval standard was 95%, and deviation correction method was used to test. The grammar of AMOS software was used to assign all the relevant paths, and the specific mediating effects of Non-standardization and standardization were calculated (see Table 9).
Table 9 shows the mediating path coefficients.
The mediating effect of BT→PV→WTPP was 0.094, and the corresponding 95% confidence interval was [0.038, 0.156], which did not contain 0, indicating that PV had a significant mediating effect between BT and WTPP. Therefore, H9 was supported.
The mediating effect of BC→PV→WTPP was 0.156, and the corresponding 95% confidence interval was [0.103, 0.256], which did not contain 0, indicating that PV had a significant mediating effect between BC and WTPP. Therefore, H10 was supported.
The mediating effect of BT→PQ→WTPP was 0.055, and the corresponding 95% confidence interval was [0.013, 0.087], which did not contain 0, indicating that the mediating effect of PQ between BT and WTPP was significant. Therefore, H11 was supported.
The mediating effect of BC→PQ→WTPP was 0.160, and the corresponding 95% confidence interval was [0.85, 0.223], which did not contain 0, indicating that the mediating effect of PQ between BC and WTPP was significant. Therefore, H12 was supported.
Table 8. Hypothesis testing
|
Path |
Estimate |
S.E. |
C.R. |
p |
Hypothesis testing |
||
|
PV |
<--- |
BT |
0.549 |
0.055 |
8.503 |
*** |
Support |
|
PQ |
<--- |
BT |
0.301 |
0.057 |
4.591 |
*** |
Support |
|
PV |
<--- |
BC |
0.449 |
0.073 |
6.721 |
*** |
Support |
|
PQ |
<--- |
BC |
0.452 |
0.080 |
6.227 |
*** |
Support |
|
WTPP |
<--- |
PV |
0.212 |
0.169 |
1.242 |
0.014 |
Support |
|
WTPP |
<--- |
PQ |
0.167 |
0.085 |
1.930 |
0.034 |
Support |
|
WTPP |
<--- |
BT |
0.196 |
0.106 |
1.560 |
0.019 |
Support |
|
WTPP |
<--- |
BC |
0.017 |
0.134 |
0.138 |
0.891 |
No support |
Note: *** p < 0.001; **p < 0.01; *p < 0.05.
Table 9. Mediating effects
|
Mediating Path |
Estimate |
Lower |
Upper |
P |
Research hypothesis |
|
BT–PV–WTPP |
0.094 |
0.038 |
0.156 |
0.000 |
Support |
|
BC–PV–WTPP |
0.156 |
0.103 |
0.256 |
0.000 |
Support |
|
BT–PQ–WTPP |
0.055 |
0.013 |
0.087 |
0.003 |
Support |
|
BC–PQ–WTPP |
0.160 |
0.085 |
0.223 |
0.000 |
Support |
In this study, factor analysis and path analysis were used to verify the hypotheses on the influencing factors of brand equity, customer perception and premium payment willingness. The results showed that brand equity can partially promote customers' willingness to pay premiums and that customer perception plays an intermediary role between brand equity and willingness to pay premiums. These conclusions also support Keller's brand equity model in which brand trust, brand image, brand evaluation and brand performance can promote consumers' brand resonance and thus form brand loyalty. However, the influence of brand communication on customers' willingness to pay premiums was not verified, which contrasts the conclusions of Chinomona [34]. A possible reason for this result is that brand communication cannot directly promote customers' willingness to pay premiums, and companies need to continuously strengthen brand value in their relationship marketing to cultivate a high consumer brand loyalty with brand awareness and brand familiarity. Therefore, this study confirms that customer perception plays a mediating role between brand equity and the willingness to pay premiums.
This study took Chinese international schools as its research object and explored the degree of influence of brand equity on the sustainable development of international schools by constructing a brand equity model of international schools. In this way, the theoretical and practical value of the development of international education branding is proposed. At the same time, it is hoped that the research results can help international schools break through the bottleneck of brand development and promote their healthy and stable development in order to better serve global education needs.
Accordingly, this study recommends that international schools: 1) strengthen their brand equity management, build and maintain a positive brand image, and enhance their brand reputations; 2) strengthen their brand publicity, brand experience, and other brand communication methods so that consumers can quickly recognize and become familiar with their brands; 3) pay attention to customer perception, strengthen customer experiences, and continue to deliver brand value to customers in order to cultivate customer loyalty to their brands.
Due to time limitations, this study had some shortcomings: the sample size was not large enough, the scope of sampling needs to be further expanded, and the research method was relatively simple. In follow-up research, the authors of this study will adopt diversified research methods, further expand the sampling scope and sample size, and carry out a more comprehensive survey of the stakeholders of international school brands in order to obtain more scientific research conclusions and provide valuable reference for the development of international school brands.
[1] Roy, D.P., Cornwell, T.B. (2001). The influence of brand equity on consumer reponses to sports sponsorship. In American Marketing Association. Conference Proceedings, 12: 342-342.
[2] Faircloth, J.B., Capella, L.M., Alford, B.L. (2001). The effect of brand attitude and brand image on brand equity. Journal of Marketing Theory and Practice, 9(3): 61-75. https://doi.org/10.1080/10696679.2001.11501897
[3] Erdem, T., Swait, J. (2004). Brand credibility, brand consideration, and choice. Journal of consumer research, 31(1): 191-198. https://doi.org/10.1086/383434
[4] Aaker, D.A. (1991). Managing brand equity: Capitalizing on the value of a brand name, New York, NY: The Free Press.
[5] Huang, R., Sarigöllü, E. (2012). How brand awareness relates to market outcome, brand equity, and the marketing mix. Journal of Business Research, 65(1): 92-99. https://doi.org/10.1016/j.jbusres.2011.02.003
[6] Runyan, R.C., Droge, C. (2008). A categorization of small retailer research streams: what does it portend for future research. Journal of Retailing, 84(1): 77-94. https://doi.org/10.1016/j.jretai.2008.01.003
[7] Keller, K.L. (2001). Building customer-based brand equity: A blueprint for creating strong brands. Cambridge, MA: Marketing Science Institute.
[8] Esmaeilpour, M., Sayadi, A., Mirzaei, M. (2017). Investigating the impact of service quality dimensions on reputation and brand trust. International Journal of Business & Economic Sciences Applied Research, 10(3): 7-17.
[9] Japutra, A., Molinillo, S. (2019). Responsible and active brand personality: On the relationships with brand experience and key relationship constructs. Journal of Business Research, 99: 464-471. https://doi.org/10.1016/j.jbusres.2017.08.027
[10] Godey, B., Manthiou, A., Pederzoli, D., Rokka, J., Aiello, G., Donvito, R., Singh, R. (2016). Social media marketing efforts of luxury brands: Influence on brand equity and consumer behavior. Journal of Business Research, 69(12): 5833-5841. https://doi.org/10.1016/j.jbusres.2016.04.181
[11] Mahmood, A., Bashir, J. (2020). How does corporate social responsibility transform brand reputation into brand equity? Economic and noneconomic perspectives of CSR. International Journal of Engineering Business Management, 12: 1-13. https://doi.org/10.1177/1847979020927547
[12] Bougenvile, A., Ruswanti, E. (2017). Brand equity on purchase intention consumers’ willingness to pay premium price juice. IOSR Journal of Economics and Finance, 8(1): 12-18. 10.9790/5933-0801031218
[13] Farzin, M., Sadeghi, M., Fattahi, M., Eghbal, M.R. (2022). Effect of social media marketing and eWOM on willingness to pay in the etailing: Mediating role of brand equity and brand identity. Business Perspectives and Research, 10(3): 327-343. https://doi.org/10.1177/22785337211024926
[14] Govindasamy, R., Italia, J. (1999). Predicting willingness-to-pay a premium for organically grown fresh produce. Journal of Food Distribution Research, 30: 44-53.
[15] Diallo, M.F., Ben Dahmane Mouelhi, N., Gadekar, M., Schill, M. (2021). CSR actions, brand value, and willingness to pay a premium price for luxury brands: Does long-term orientation matter. Journal of Business Ethics, 169: 241-260. https://doi.org/10.1007/s10551-020-04486-5
[16] Dwivedi, A., Merrilees, B. (2013). Brand-extension feedback effects: an Asian branding perspective. Asia Pacific Journal of Marketing and Logistics, 25(2): 321-340. https://doi.org/10.1108/13555851311314086
[17] Dwivedi, A., Nayeem, T., Murshed, F. (2018). Brand experience and consumers’ willingness-to-pay (WTP) a price premium: Mediating role of brand credibility and perceived uniqueness. Journal of Retailing and Consumer Services, 44: 100-107. https://doi.org/10.1016/j.jretconser.2018.06.009
[18] Adhikari, A. (2015). Differentiating subjective and objective attributes of experience products to estimate willingness to pay price premium. Journal of Travel Research, 54(5): 634-644. https://doi.org/10.1177/0047287514532366
[19] Ottenbacher, M.C., Kuechle, G., Harrington, R.J., Kim, W.H. (2019). QSR customer sustainable behaviors and brand practice perceptions on willingness to pay a premium. International Hospitality Review, 33(2): 106-125. https://doi.org/10.1108/IHR-03-2019-0006
[20] Anselmsson, J., Vestman Bondesson, N., Johansson, U. (2014). Brand image and customers' willingness to pay a price premium for food brands. Journal of Product & Brand Management, 23(2), 90-102. https://doi.org/10.1108/JPBM-10-2013-0414
[21] Ha-Brookshire, J.E., Norum, P.S. (2011). Willingness to pay for socially responsible products: Case of cotton apparel. Journal of Consumer Marketing., 28(5): 344-353. https://doi.org/10.1108/07363761111149992
[22] Drucker, P.F. (1954). The Practice of Management. Burlington, MA: Elsevier Ltd., pp. 265-67.
[23] Zeithaml, V.A., Parasuraman, A., Berry, L.L., Berry, L.L. (1990). Delivering quality service: Balancing customer perceptions and expectations. Simon and Schuster.
[24] Blackston, M. (2000). Observations: Building brand equity by managing the brand's relationships. Journal of Advertising Research, 40(6): 101-105. 10.2501/JAR-40-6-101-105
[25] Hoeffler, S., Keller, K.L. (2013). Ama journals - building brand equity through corporate societal marketing. Journal of Public Policy & Marketing, 20(1): 78-89.
[26] Yoo, B., Donthu, N. (2001). Developing a scale to measure the perceived quality of an Internet shopping site (SITEQUAL). Quarterly Journal of Electronic Commerce, 2(1): 31-45.
[27] Netemeyer, R.G., Krishnan, B., Pullig, C., Wang, G., Yagci, M., Dean, D., Wirth, F. (2004). Developing and validating measures of facets of customer-based brand equity. Journal of Business Research, 57(2): 209-224. https://doi.org/10.1016/S0148-2963(01)00303-4
[28] Kasilingam, D., Krishna, R. (2022). Understanding the adoption and willingness to pay for internet of things services. International Journal of Consumer Studies, 46(1): 102-131. https://doi.org/10.1111/ijcs.12648
[29] Ngo, H.M., Liu, R., Moritaka, M., Fukuda, S. (2020). Effects of industry-level factors, brand credibility and brand reputation on brand trust in safe food: evidence from the safe vegetable sector in Vietnam. British Food Journal, 122(9): 2993-3007. https://doi.org/10.1108/BFJ-03-2020-0167
[30] Kovacs, I., Keresztes, E.R. (2022). Perceived consumer effectiveness and willingness to pay for credence product attributes of sustainable foods. Sustainability, 14(7): 4338. https://doi.org/10.3390/su14074338
[31] Gundlach, G.T., Phillips, J.M. (2015). Brands, Competition Law and IP: Brands and brand management. Insights from Marketing, 62(4): 1-15.
[32] Tyagi, P.K., Tyagi, P. (2022). Customer perception and brand image through sensory marketing. In Disruptive Innovation and Emerging Technologies for Business Excellence in the Service Sector, 41-68. https://doi.org/10.4018/978-1-7998-9194-9.ch003
[33] Baumgartner, H., & Homburg, C. (1996). Applications of structural equation modeling in marketing and consumer research: A review. International journal of Research in Marketing, 13(2): 139-161. https://doi.org/10.1016/0167-8116(95)00038-0
[34] Chinomona, R. (2016). Brand communication, brand image and brand trust as antecedents of brand loyalty in Gauteng Province of South Africa. African Journal of Economic and Management Studies, 7(1): 124-139. https://doi.org/10.1108/AJEMS-03-2013-0031