Paúl Carrión-Mero![]() | Peter Olaya
| Peter Olaya![]() | Luis Sanango-Ochoa
| Luis Sanango-Ochoa![]() | Favio Cano-Alvarado
| Favio Cano-Alvarado![]() | Lady Bravo-Montero*
| Lady Bravo-Montero*![]() | Joselyne Solórzano
| Joselyne Solórzano![]() | Fernando Morante-Carballo
| Fernando Morante-Carballo![]()
© 2023 IIETA. This article is published by IIETA and is licensed under the CC BY 4.0 license (http://creativecommons.org/licenses/by/4.0/).
OPEN ACCESS
The north-central sector of the Santa Elena province has coastal aquifers that their communities have exploited due to water scarcity. The study area comprises the lower part of the Hondo River micro-watershed in the 'La Aguadita' commune. The sector's inhabitants do not have access to drinking water or sewage; the supply is given by cistern tanks and artisanal water wells, with livestock farming as the main economic activity. This work aims to characterize the lower part of the Hondo River micro-watershed by hydrological, lithological, and geophysical analysis to identify areas of groundwater exploitation and proposal for sustainable development. The methodology included: i) analysis of hydrogeological parameters, ii) lithological-geophysical survey, iii) correlation of lithological and geophysical results, and iv) determination of groundwater exploitation zones. The saturated groundwater layer is between 3 and 30 m deep, consisting of gravel and sand. This study demonstrated that the community-academic interaction and the correlation of innovative theoretical methods allowed the establishment of the proposal of sustainable guidelines contributing to the decision-making authorities in integrated water management. Additionally, using walls (albarradas) as part of the ancestral techniques of Water Sowing and Harvesting (WS&H) contributes to the recovery of groundwater quality. The walls are keys to the supply and development of the community. The water quality in the rainy season meets the quality standards for irrigation, while in the dry season, it requires pre-treatment. In the regional context there is limited hydrogeological and geophysical information to a better understanding of the availability and sectorization of groundwater. Methodological trends for future studies are the environmental impact analysis and the correlation of Vertical Electrical Soundings (VES's) with electrical and electromagnetic tomography.
aquifer, vertical electrical sounding, hydrogeology, groundwater catchment, hydric balance, La Aguadita-Santa Elena
Water is a fundamental resource for the socioeconomic development of a country, which is why its use has increased since 1980 [1, 2]. By 2050 it is expected that the global water demand will increase between 20 and 30% of its current use, considering the progressive population growth and the industrial and agricultural sectors [3-5].
Geophysical, hydrogeological and geological studies represent a fundamental role in sustainable strategies' management of water resources [6]. A hydrogeological characterisation is a tool in the investigation of aquifers. In groundwater exploration, water resources in watersheds need to be quantified and evaluated [7, 8]. These studies require an inventory of water wells, measurements of physical-chemical parameters and geoelectric prospecting [9-11]. The artificial recharge of aquifers through water planting and harvesting techniques (e.g., dams on rivers) has been used for decades in China for sustainable water management [12]. Likewise, in the framework of groundwater sustainability, it is essential to establish strategies as management tools in coastal aquifers, for example, the case of the aquifer of the coast of Hermosillo, Mexico, including community participation to guarantee the resource's supply [13].
South America has abundant renewable resources of water, and Ecuador ranks 25th globally [14, 15]. Ecuador is the most megadiverse country with four climatic regions [16]. The Amazon region of this country has the highest water potential (81%) in the country, where only 4% of the national population lives. While in the coastal region, only 19% of the water potential exists [17-20]. It shows that even though this country has a large amount of fresh water, some areas do not have drinking water services and have a deficit of this resource [21, 22]. The Santa Elena province has been affected by deforestation and indiscriminate exploitation of forests. Exit high erosion, low precipitation, and high evapotranspiration values [23-25]. In the north-central sector of this coastal province, the water supply of its rural communities is mainly from aquifers through water wells [26, 27]. There are areas where communities have implemented some ancestry techniques based on Water Sowing and Harvesting (WS&H) to build dykes (tapes) that store water from rainfall, which promotes artificial aquifer recharge and subsequent use by pumping [28].
The study area comprises the lower part of the Hondo River micro-watershed in the 'La Aguadita' commune. The water supply comes from two primary sources: i) water tanker truck for human consumption and ii) water wells for livestock [29]. This commune has been affected mainly by potable water scarcity, indiscriminate felling of trees, high salinity in the water wells, low humidity, intermittent rivers, lack of sewerage and education of the population [30-32]. Around 205 people live in the commune who are supplied with water through cistern tanks for human consumption and artisanal underground water wells for livestock. The rivers only have water in the rainy season (January-April), but the residents do not have access to the cistern tanks due to the road's poor condition [33]. Additionally, the scarcity of previous technical hydrogeological studies, maintenance of water wells, monitoring of the quality of groundwater and surface water, and establishing a community water management structure impairs the development of productive activities. Therefore, it affects the development of livestock and the main socio-economic activity in the sector [34]. It caused the migration of a large part of the population to nearby places to raise their livestock and maintain their crops [35].
Due to the water scarcity problem, the following research question arises: Does configuring a comprehensive base of geoelectric and field information through a hydrogeological characterisation in the study area guarantee the recognition of zones of groundwater supply?
This study aims to characterise the micro-watershed's lower part of the Hondo River through the analysis of hydrological parameters and correlation between lithology-geophysics data recognising zones to the construction of new water wells as a guideline for a sustainable sourcing plan.
This proposed solution consisted of determining the water quality in the five wells and identifying areas for groundwater exploitation. In addition, the link between the community and the academy generated environmental awareness in the residents about the use and sustainable management of water resources.
The study area comprises the lower part of the Hondo River micro-watershed in the 'La Aguadita' commune. This sector belongs to the rural Colonche parish, Santa Elena province [36]. This micro-watershed has an area of 164.22 km2, representing 34.67% of the Javita River watershed and an axial length of 21.59 km, as shown in Figure 1.
Figure 1. The study area map. a) General location in Ecuador, b) Santa Elena province, c) Representation of La Aguadita commune.
Source: Adapted from [37]
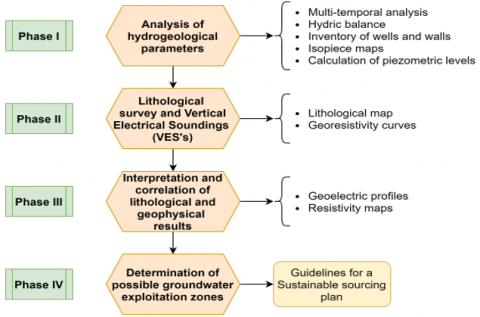
The methodology applied in this study consisted of four phases: i) analysis of hydrogeological parameters, ii) lithological-geophysical survey, iii) interpretation and correlation of lithological-geophysical results, and iv) determination of possible groundwater exploitation areas (Figure 2). In developing these phases, the community collaborated in the field campaigns for data collection.
Figure 2. Methodology scheme
3.1 Analysis of hydrogeological parameters
This phase consists of four sections: i) multi-temporal analysis of hydrological parameters, ii) water balance of the Hondo River micro-watershed, iii) inventory of wells, flow network scheme and isopieces map, and iv) measurement of physicochemical parameters.
3.1.1 Multi-temporal analysis of hydrological parameters
Temperature and precipitation data between 1990 and 2014 were obtained from the meteorological station called 'Colonche', with code M0780 and located approximately 10 km from the study area (see Figure 1). The Prediction of Worldwide Energy Resources (POWER) [38] allowed this database to be complete with satellite data downloads between 2015 and 2021.
The multi-temporal analysis from 1990 to 2021 considered mean annual temperature and precipitation parameters while using Turc's formula [39, 40], which permitted the calculation of the actual evapotranspiration as shown in Eq. (2).
$\mathrm{L}=300+25 \mathrm{~T}+0.05 \mathrm{~T}^3$ (1)
RET $=\frac{\mathrm{P}}{\sqrt{0.9+\left(\frac{\mathrm{P} \, ^2}{\mathrm{~L} \,^2}\right)}}$ (2)
where, L: thermal indicator, RET: annual real evapotranspiration [mm], P: annual precipitation [mm], T: mean annual temperature [℃].
3.1.2 Water balance of the Hondo River micro- watershed
The water balance in the the lower part of the Hondo River micro-watershed in the ́ La Aguadita ́ commune was calculated between 1990 and 2021, using monthly information on temperature and precipitation. Additionally, the maximum absorption capacity in mm allowed for determining through the apparent density of the predominant soil in the area. Potential evapotranspiration was also calculated through the Thornthwaite equation [41, 42], following the procedure detailed below:
The monthly heat index (i) was calculated using the monthly mean temperature (T), as shown in Eq. (4).
$\mathrm{I}=\sum_{n=1}^{\mathrm{n}=12} \, \mathrm{i}_{\mathrm{n}}=\sum_{n=1}^{\mathrm{n}=12}\left(\frac{T}{5}\right)^{1.514}$ (3)
i is given by:
$i=\left(\frac{T}{5}\right)^{1.514}$ (4)
The 12-month heat index (I) was added, and this value was used to find the uncorrected monthly evapotranspiration (ETP) Eq. (5) and Eq. (6).
$\mathrm{a}=675 \times 10^{-9} \times \mathrm{I}^3-771 \times 10^{-7} \times \mathrm{I}^2+1792 \times 10^{-5} \times \mathrm{I}+0.49239$ (5)
$\mathrm{ET}_{\mathrm{P}}=16\left(\frac{10 \times \mathrm{T}}{\mathrm{I}}\right)^{\mathrm{a}}$ (6)
Finally, to calculate the Corrected Potential Evapotranspiration (PET), Eq. (7) was used, using the day's number of each month (d) and the maximum number of sunshine hours (N), which in Ecuador has a value of 12.01.
$\mathrm{PET}=\mathrm{ET}_{\mathrm{P}} \times \frac{\mathrm{N}}{12} \times \frac{\mathrm{d}}{30}$ (7)
3.1.3 Well inventory, flow network scheme and isopiece map
An inventory of wells in the sector was carried out, measuring static levels to calculate the piezometric level and represent it through a flow network scheme.
Also, an isopiece map was generated using ArcGIS Pro and Surfer software [43, 44], including data from the piezometric levels of wells (1-4) and wall (albarrada) #1 in the rainy season (December 2021). In ArcMap, a shapefile of points of the piezometric level of the wells and walls (albarradas) was created with the 'Spline' interpolation tool to obtain isolines. Subsequently, the isoline grid was created with the Surfer program to generate the first derivative of the curves and identify the direction of the underground flow network.
3.1.4 Measurement of physicochemical parameters
The parameters were measured: salinity, pH, Temperature, Total Dissolved Solids (TDS), Electrical Conductivity (EC) and resistivity, for a representative month of each seasonal period. That is, the month of September 2021 (dry season) and December 2021 (rainy season), due to the difficult access in the sector and that it is a pioneering study in the registration and monitoring of the quality of groundwater (wells) and shallow water (walls/albarradas).
3.2 Lithological-geophysical survey
The lithological survey included the recognition of six representative outcrops of the sector and the photo interpretation from the analysis of Landsat 8 satellite images provided by the free access portal of the Earth Observing System [45]. Also, the Digital Elevation Model (DEM), provided by the Phantom 4 Pro drone with a resolution of 3 meters, was used. This information allowed identifying contacts and geological formations in the sector.
Subsequently, based on the geology of this micro-watershed, the strategic places were selected to carry out six Vertical Electrical Soundings (VES's) using the Schlumberger configuration [46]. This configuration consists of placing the electrodes separated by distances established by the method, where the distance between the external or current electrodes (A-B) is five times greater than the distance between the internal or power drop electrodes (M-N) [47, 48]. As a result, six VES's were achieved during the dry season, reaching an AB/2 opening of 31, 46 and 68 m. Subsequently, the free software IPI2win (version 3.1) allowed for the field curves of resistivity with a maximum error of 5% [49].
3.3 Correlation of lithological and geophysical results
In this phase, the lithological and geoelectric surveys (VES's) data were correlated, obtaining an iso-resistivity map using the Surfer software [43]. This map allowed the identification of the areas with the possible presence of saline intrusion, correlating the geological information and the iso-resistivity map, identifying the boundary between sand-clay and sand-clay with gypsum intrusions, which indicate saline environments. In addition, geoelectric profiles generated with the GEO5 software [50] evaluated the feasible strata to store groundwater (gravel and sand) due to their excellent porosity and permeability conditions.
3.4 Determination of groundwater exploitation areas
The identification of potential areas for groundwater exploitation included the interpretation of the VES's.
Consequently, the map generated represents the groundwater reclamation zones that include the proposed new wells.
4.1 Analysis of hydrological parameters
4.1.1 Multi-temporal analysis
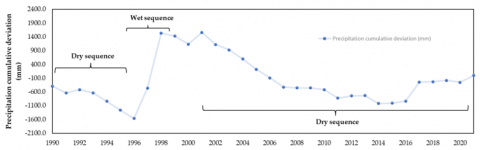
The generation of the multi-temporal analysis included some hydrological parameters, such as Precipitation (P), Temperature (T) and Real Evapotranspiration (RET) for the period between 1990 and 2021, as shown in Figure 3.
As a result, there is no significant variation between P and RET without considering extreme events such as the El Niño phenomenon in 1997-1998, where these values exceeded 2000 mm. Therefore, it indicates that there may not be enough water inlets to recharge aquifers in the sector.
Figure 3. Multi-temporal analysis of hydrological parameters for the period 1990-2021.
Source: Adapted from [51]
The dry and wet periods of the area were identified, where the predominant sequences are the dry ones with a series of almost 20 years, while the wet sequence does not exceed five years, as shown in Figure 4.
Figure 4. Dry and wet sequence diagram, during 1990-2021
Source: Adapted from [51]
4.1.2 Hydric balance
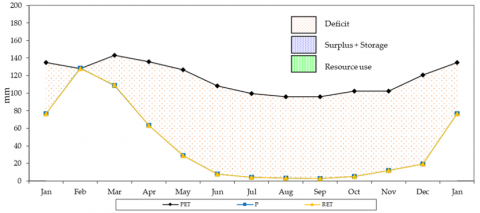
The generation of a hydric balance at the level of the Hondo River micro-watershed between 1990 and 2021 allowed us to recognise the annual potential evapotranspiration of 1394.7 mm and mean annual precipitation of 460.8 mm. However, it indicates that the amount of precipitated water is insufficient to cover the evapotranspiration needs, as indicated in Table 1.
The area is in constant deficit; there are no monthly reserves or surpluses (see Figure 5).
Table 1. Hydric balance of the Hondo river micro-watershed
|
Month |
P |
PET |
RET |
DEF |
RES |
SUR |
|
Jan |
76.8 |
135.1 |
76.8 |
58.3 |
0.0 |
0.0 |
|
Feb |
128.3 |
127.9 |
127.9 |
0.0 |
0.5 |
0.0 |
|
Mar |
108.7 |
143.3 |
109.2 |
34.1 |
0.0 |
0.0 |
|
Apr |
63.3 |
135.8 |
63.3 |
72.5 |
0.0 |
0.0 |
|
May |
29.0 |
126.9 |
29.0 |
97.9 |
0.0 |
0.0 |
|
Jun |
7.9 |
108.3 |
7.9 |
100.4 |
0.0 |
0.0 |
|
Jul |
4.3 |
99.7 |
4.3 |
95.4 |
0.0 |
0.0 |
|
Aug |
3.2 |
96.2 |
3.2 |
92.9 |
0.0 |
0.0 |
|
Sep |
3.0 |
96.0 |
3.0 |
92.9 |
0.0 |
0.0 |
|
Oct |
4.9 |
102.4 |
4.9 |
97.5 |
0.0 |
0.0 |
|
Nov |
12.1 |
102.5 |
12.0 |
90.4 |
0.0 |
0.0 |
|
Dec |
19.2 |
120.8 |
19.2 |
101.6 |
0.0 |
0.0 |
|
Total |
460.8 |
1394.7 |
460.8 |
933.9 |
0.0 |
0.0 |
|
Max. reserve |
344.79 |
|||||
Note: P: Precipitation, PET: Potential Evapotranspiration, RET: Real Evapotranspiration, DEF: Deficit, RES: Resource and SUR: Surplus.
Figure 5. Hydric balance diagram during 1990 – 2021
4.1.3 Well inventory and static level measurement
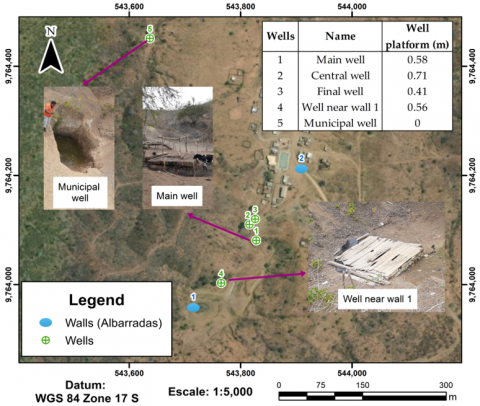
Five wells and two walls (albarradas) were recorded in the “La Aguadita” commune, as shown in Figure 6. In addition, information on their origin and platform was added, providing a complete database for the study.
Figure 6. Location of the wells and walls of the La Aguadita commune
Source: Adapted from [37]
Table 2. Values of the static level and water table
|
Well |
Static water level (m) |
Piezometric level (m.a.s.l) |
||
|
29/09/2021 (dry season) |
2/12/2021 (rainy season) |
29/09/2021 (dry season) |
2/12/2021 (rainy season) |
|
|
1 |
0.82 |
1.00 |
102.72 |
102.54 |
|
2 |
0.25 |
0.60 |
102.63 |
102.28 |
|
3 |
0.57 |
0.72 |
101.99 |
101.84 |
|
4 |
1.18 |
1.27 |
105.10 |
105.01 |
|
5 |
- |
2.00 |
- |
100.12 |
The community members built the wells (well #1, #2, #3 and #4) and did not have a pumping system, for which the community finds it necessary to extract the resource with water extraction buckets. The competent municipality in the sector built well #5. Currently, the wells supply livestock activities, where the primary source is well #1. On the other hand, walls (albarradas #1 and #2) fill up in the rainy season, and an intermittent river crosses the main wall (albarrada #1) and the wall without an outlet (albarrada #2). During the dry season (May-November), the water from the walls is used directly for livestock.
Table 2 shows the measurements of the static level and the calculation of the piezometric level of each well in September 2021 (dry season) and December 2021 (rainy season). It is observed that the static levels increased as they went from the dry to the rainy season while the piezometric level decreased.
4.1.4 Flow network scheme and map of isopieces
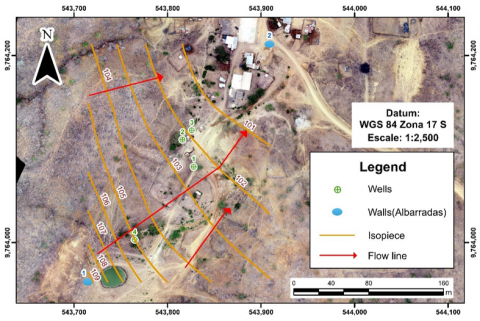
A topographic cut was made that crosses wells #1 to #4 and wall (albarrada) #1 (SW-NE) to generate the flow network scheme, using the data from the piezometric level of the wells from the rainy season (December 2021), as shown in Figure 7. Additionally, the elevation of the wall (albarrada) #1 was considered a water point due to the proximity of the free aquifer to the earth's surface.
Since it is a free aquifer, the water table representation considered the land's topography three meters from the surface. Therefore, the interpretations made in the VES's indicated that the saturated layer is at this depth. Furthermore, an undifferentiated layer was also shown at an average depth of 33 m since it is the maximum depth reached with the VES's.
Figure 7. a) Diagram of the flow network of wells 1 – 4 and wall (albarrada #1) during rainy season, b) location of the profile (plan view)
Source: Adapted from [37]
Figure 8 represents the isopieces generated from the values of the piezometric level of wells 1 to 4 in the rainy season (December 2021), excluding well #5 due to its location. It is unknown if it belongs to the same aquifer. The water table was also established through isolines, separated by one meter, and the flow direction goes from the largest piezometric level to the smallest, concerning the flow network scheme. This map also included the height values of the walls (albarradas) because they are springs, and due to their topography, they are considered piezometric level measurements.
Figure 8. Map of isopieces of the commune La Aguadita
Source: Adapted from [37]
The flow network scheme showed that the region delimited between isolines 105 to 109 belongs to an area of maximum gradient, while the region delimited between isolines 105 to 101 represents an area of the minimum gradient. According to the flow directions, the area that includes the wells and walls (albarradas) is a discharge area. Another factor to consider is the salinity content of the well water and the shallow groundwater level, which are characteristic of a discharge zone.
4.1.5 Measurement of physicochemical parameters
Table 3 shows the results of measuring the physicochemical parameters of the water from the wells and the wall (albarrada #1), measured in a representative month of each season: September 2021 (dry season) and December 2021 (rainy season). This selection was due to the difficult access to the La Aguadita commune, a sector far from the urban area, a gravel road and the lack of previous studies on the registration and monitoring of the quality of surface and underground water.
Subsequently, the national regulation of the Unified Text of the Secondary Legislation of the Ministry of the Environment (TULSMA acronym in Spanish) allowed the analysis of water quality standards for human consumption and use in agriculture [52].
Table 3. Physicochemical parameters of groundwater (wells) and surface water (wall/albarrada)
|
Date |
Source |
pH |
S (PSU) |
EC (mS/cm) |
R (Ω cm) |
TDS (mg/l) |
T (°C) |
|
Dry season |
Well #1 |
7.53 |
6.00 |
10.46 |
95.60 |
10,470.0 |
28.0 |
|
Well #2 |
7.40 |
3.70 |
6.82 |
146.00 |
6820.0 |
28.0 |
|
|
Well #3 |
7.39 |
3.60 |
6.58 |
152.10 |
6570.0 |
27.4 |
|
|
Well #4 |
7.42 |
1.20 |
2.72 |
367.00 |
2720.0 |
26.7 |
|
|
Wall #1 |
9.53 |
0.10 |
0.42 |
2.33 |
422.0 |
33.1 |
|
|
Rainy season |
Well #1 |
7.53 |
5.50 |
9.76 |
102.40 |
9760.0 |
26.6 |
|
Well #2 |
7.40 |
2.90 |
5.31 |
180.30 |
5310.0 |
26.0 |
|
|
Well #3 |
7.39 |
3.00 |
5.53 |
180.30 |
5530.0 |
26.5 |
|
|
Well #4 |
7.42 |
1.60 |
3.08 |
324.00 |
3080.0 |
25.4 |
|
|
Well #5 |
7.25 |
2.50 |
4.58 |
218.00 |
4590.0 |
25.4 |
|
|
Wall #1 |
9.51 |
0.40 |
0.91 |
1.10 |
913.0 |
25.7 |
Note: S: Salinity; EC: Electric Conductivity, R: Resistivity, TDS: Total Dissolved Solids and T: Temperature, PSU: Practical Salinity Units.
4.2 Lithological survey and VES's
4.2.1 Lithological map
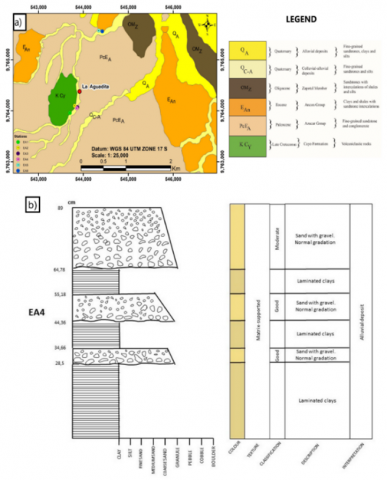
Figure 9. Sector lithology. a) Lithological map of the La Aguadita commune, b) stratigraphic column of the EA4 station
Source: Adapted from [37]
Figure 9 shows the lithology generated by observations and descriptions of six stations from six outcrops. Additionally, in areas of difficult access, they were interpreted using photo interpretation and the DEM. The changes in contrast and shape of the relief indicated changes in the geomorphology and, therefore, a lithological change. This interpretation included bibliographic information from the Military Geographic Institute (IGM, acronym in Spanish) and the National Information System (SIN, acronym in Spanish) [53, 54].
4.2.2 Vertical electrical soundings (VES's)
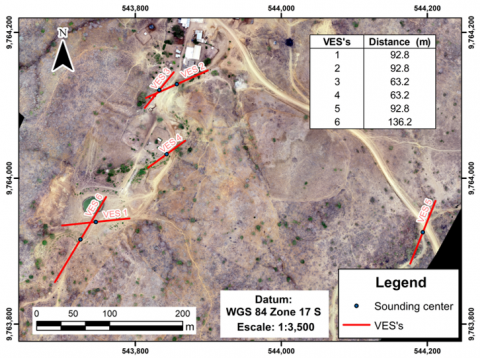
The location of the VES's considering field observations and the proximity of rivers, walls and wells is shown in Figure 10.
Figure 10. Location map of the VES's
Source: Adapted from [37]
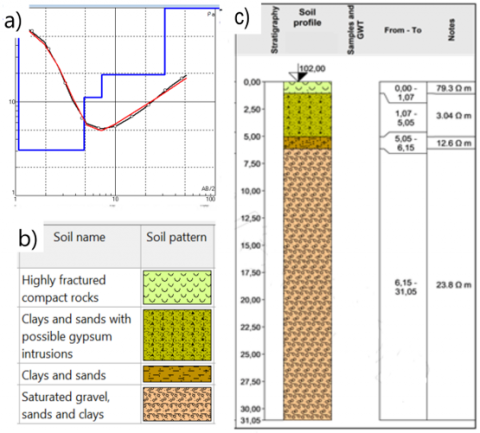
The field resistivity curve of VES #1, shown in Figure 11a, obtained an error of 4.90%. Therefore, the geoelectric profile used the lithology, thickness, depth, and resistivity data obtained from VES #1 (Figure 11 b).
Figure 11. VES #1 interpretation. a) VES #1 resistivity curve fit, b) Lithology of the geoelectric profile, c) geoelectrical profile of VES #1
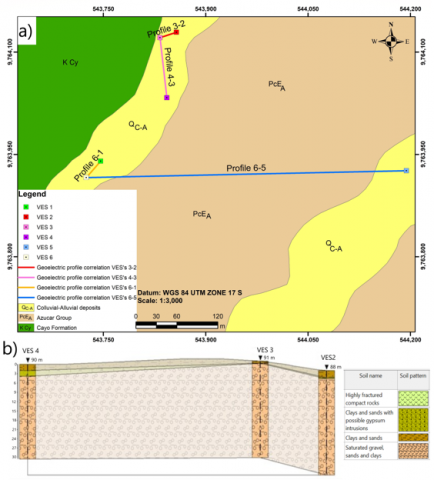
Table 4 shows the interpretation of the layers with their respective depths. From ceiling to floor, down to a depth of 1.07 m, highly fractured compact rocks were identified, underlain by a layer of clay and sand with possible gypsum intrusions up to 5.05 m deep; below it is a layer of clay and sand up to 6.15 m. m, followed by saturated sand, clay, and gravel down to 31.1 m depth. Finally, there is a compact rock with little fracture.
Table 4. Interpretation of the layers of VES #1
|
L |
Description |
Thickness (m) |
Depth (m) |
R (Ω-m) |
|
1 |
Highly fractured compact rocks |
1.07 |
1.07 |
79.3 |
|
2 |
Clays and sands with possible gypsum intrusions |
3.98 |
5.05 |
3.04 |
|
3 |
Clays and sands |
1.1 |
6.15 |
12.6 |
|
4 |
Sands, clays, and/or saturated gravels |
24.9 |
31.1 |
23.8 |
|
5 |
Highly fractured compact rock |
- |
- |
80.3 |
Note: L: Layer; R: Resistivity
4.3 Geophysical prospecting analysis
4.3.1 Correlation of geoelectric profiles
The correlation consisted in prolonging the lithological layers with the geoelectric profiles to know the stratigraphic disposition between the VES's zones. Figure 12 shows the map of the correlation between the geoelectric profiles. In addition, the general correlation of VES's 2, 3 and 4 showed that the saturated layer is throughout the area of influence of these boreholes with approximate thicknesses between 20 and 23 m and an average depth of 3 m.
Figure 12. a) Correlation map of geoelectric profiles, b) general correlation of VES 2, 3 and 4
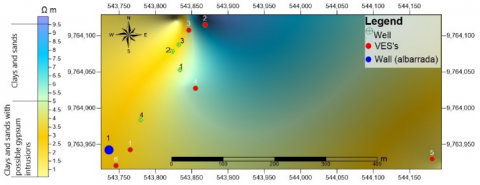
4.3.2 Map of isoresistivities
Figure 13 shows the map of isoresistivities at a depth of two meters; it allowed us to differentiate in which places of the commune at a depth of two meters possible gypsum intrusions can be found. This average value corresponds to the limit between the layer of clay and sand with possible gypsum intrusions. The layer with possible gypsum intrusions has resistivities of less than 5 Ω-m, and most of the VES's are approximately between 1.5 and 3.0 m deep.
Figure 13. Representation of the isoresistivities at a depth of two meters
4.4 Determination of potential area for groundwater extraction
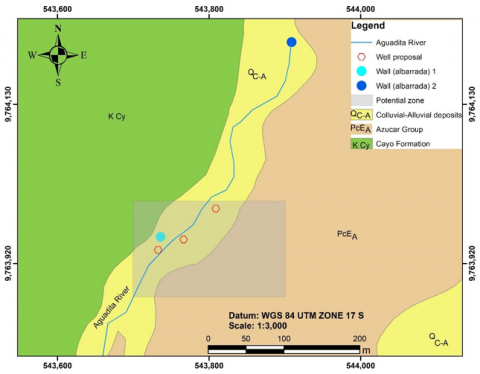
4.4.1 Potential groundwater zone
Figure 14 shows the potential area for groundwater exploitation obtained from the interpretation of the VES's carried out in the sector, which allowed for estimating the depth at which the groundwater is located and, in turn, knowing the quality of groundwater (wells) in the sites near to the VES's with the physicochemical parameters. This study established the recognition of a pilot zone for constructing three new water wells oriented to a sustainability plan, with strategic places that allow groundwater recovery. It is due to the growing demand for groundwater to meet the sector's needs, predominantly water for livestock activities.
Figure 14. Representation of a pilot area for a groundwater recovery sustainability plan and proposal for new wells
Source: Adapted from [37]
4.4.2 Guidelines for a sustainable sourcing plan
Perform monthly monitoring of the water quality of the inventoried wells and walls by measuring the physicochemical parameters.
Measure the static level of the wells monthly for a year to obtain data from the dry and rainy seasons and to know the sector's movement and depth of the groundwater flow.
Build cement covers for existing wells, avoiding groundwater contamination due to waste from their economic activities (livestock).
Preserve hydraulic works such as walls since they contribute to surface recharge, infiltration, and improvements in groundwater quality. For example, well #4, located near wall #1, had better water quality, as evidenced by the reduction in TDS and salinity.
In future studies, the generation of a geometric model of the aquifer and a Flow and Transport Numerical Model would allow better management and understanding of groundwater flow dynamics is a priority.
The contribution of this study lies in the geological survey, geophysical prospecting and correlation of theoretical-practical methods to obtain the hydrogeological characterization. These techniques allowed determining the strategic areas for constructing new groundwater extraction wells, considering the hydraulic structures (walls). These walls rescue ancestral knowledge and allow surface water to be captured for longer, contributing to the aquifer's recharge in the sector [55]. This work also provided preliminary information on the water quality in the wells and walls (albarradas) in operation for sustainable groundwater use. This comprehensive analysis based on technical-hydrological studies represents a community water management tool that contributes to decision-making in the sector. However, working with the community to achieve sustainable community management is essential, as some neighbouring sectors show [56-58]. For example, it is the case of Manglaralto in the province of Santa Elena, which, with the management of the sector's community water board, supplies more than six communes by extracting groundwater from the coastal aquifer [57]. This case, as well as that of the La Aguadita commune, presents semi-arid conditions that affect the aquifer's recharge, evidenced by the physicochemical parameters such as TDS and salinity. However, thanks to dikes (tapes) construction, the water in the river can be retained and used for more months of the year, recharging the aquifer with fresh water.
The recording of the piezometric level in the walls and water wells during the two seasonal periods allowed identifying a decrease over time (from September (dry season) to December 2021 (rainy season)). There is an inverse behaviour in the static levels related to the climate of the commune. It attributes the high evapotranspiration in the rainy season and inaccessibility to cisterns tanks.
The generated flow network scheme showed that the flow directions between the water points are descending, which indicates that the flow filters over the topographic cut area, demonstrating that it is a groundwater recharge zone. Also, the water flows from wall #1 impact well #4, improving their physicochemical properties. Furthermore, it explains the low salinity content of well #4 compared to the other wells. The topography indicates a piezometric surface belonging to a free aquifer (Figure 8).
The physicochemical parameters of the water from the wells indicated a high salinity content of Well #1 (6.0 PSU) due to its proximity to an outcrop with gypsum veinlets. On the other hand, well #4 presented better salinity conditions (between 1.0 and 1.4 PSU) due to the proximity of a wall (albarrada) that favours the artificial recharge of water and increases infiltration. In surface water (wall #1), salinity values do not exceed 0.4 PSU, indicating the presence of fresh water [52]. TDS values exceed 450 mg/l related to high salinity values, evidenced by an increase in the dry season. These values in the two seasonal periods do not meet the permissible limits for human consumption [52, 59].
The wells presented a basic pH, and wall #1 had an alkaline pH due to the contamination of shallow water by livestock activity, and the wells lacked maintenance. Additionally, according to the organisation Mary River Catchment Coordinating Committee (MRCCC) [60], the EC values accepted for water for livestock consumption must be less than 10mS/cm. As a result, the water from wells 2, 3, 4 and 5 has EC values between 3.0 and 5.5 mS/m, complying with the permissible limits, except for well #1, which has an EC value of 10.46 mS/cm. In surface water, EC values do not exceed the unit in mS/cm.
The Vertical Electric Soundings and underground flow profile indicated that the water from the wall (albarrada #1) is infiltrating, reducing the salinity in the closest wells. In addition, the influence of the 'La Aguadita' river in winter helps to recharge the wall (albarrada). Moreover, the geoelectric profiles showed that the saturated layer is at an average depth of 3 meters, indicating that the population in this commune is located on a shallow aquifer, influenced by the recharge of intermittent rivers and walls (albarradas).
Figure 12 shows that the areas with apparent resistivity of more than 5 Ωm do not present gypsum intrusions. It is related to the location of the wells since the highest salinity values are observed in wells 1, 2 and 3, which have the highest gypsum intrusions. Therefore, well #4, far from the areas with the most significant presence of these intrusions, has a lower salinity. Additionally, the increase in infiltration due to the wall's presence contributes to improving the water quality in this well. Finally, the potential groundwater zone was chosen due to its accessibility, its proximity to wall #1 and because it is located on an alluvial deposit with permeable materials (gravel and sand), as shown in Figure 14.
The potential area for groundwater use is established by correlating geological surveys and geoelectric profiles. These studies determined that the water-saturated layer is about three meters deep, belonging to the Azúcar Group, made up of materials (gravel, sand and clay) that have good hydraulic properties for underground water storage. Consequently, this study established strategic areas for the construction of groundwater exploratory wells near the wall (albarrada #1), which stores seasonal water and acts as a water filter, improving the physicochemical properties of water from wells in areas near it, and observing the reduction of salinity and TDS values. In this way, the Water Sowing and Harvesting (WS&H) process is carried out based on a technique of rescuing ancestral knowledge (albarradas) for planting water and harvesting with the extraction of water from wells. It guarantees the socioeconomic development of the sector, which mainly depends on proper water management for agricultural activities.
In the rainy season, the TDS values in wells vary between 3080 and 9760 mg/l. In surface water (wall #1), salinity values do not exceed 0.4 PSU, indicating the presence of fresh water. This hydraulic structure favours the artificial recharge of the coastal aquifer. However, in the dry season, the TDS values increase from 2720 to 10,470 mg/l, and the salinity exceeds the value of 0.5 PSU, which classifies the water as brackish and not recommended for human consumption.
The flow network diagram and the isopieces map were made with data from the piezometric level for December from wells 1 to 4 and the wall (albarrada #1), allowing the estimation of the water table of the free aquifer and the identification of recharge zones. In addition, this underground flow's direction demonstrates the water's influence from wall #1 towards well #4.
This study provided the community with a database on hydrogeological parameters. The community-institution nexus and pragmatic education on the natural resource water allowed the establishment of guidelines that facilitate integrated water management for decision-makers. This research has an orientation towards compliance with the Sustainable Development Goals (SDGs), with particular emphasis on SDG#6 and SDG#8. SDG #6 since this study focuses on groundwater exploration for the proposal of guidelines for sustainable resource management. Likewise, SDG #8 because with groundwater supply, community members can boost livestock and resume agriculture, improving their income and life quality.
One of the methodological limitations of the work is due to the lack of previous research studies in this commune; there is minimal base information on the hydrogeology and geochemistry of the sector. Additionally, a greater number of VES's in the sector is required for a better understanding of the availability and sectorization of groundwater. However, the difficult access to the sector due to the poor conditions of the road does not allow the development of more VES's.
The new lines of research recognized in this work are i) geochemical studies, ii) environmental impact analysis, and iii) correlation of VES's with other geophysical methods, such as electrical and electromagnetic tomography, to obtain a complete view of the dynamics of the place.
The APC was funded by ESPOL. The following projects support this work: (i) Registro del Patrimonio Geológico y Minero y su incidencia en la defensa y preservación de la geodiversidad en Ecuador (Registry of Geological and Mining Heritage and its impact on the defense and preservation of geodiversity in Ecuador), with code No. CI-PAT-01-2018, and (ii) Siembra y Cosecha de Agua ante el COVID-19, Manglaralto 2022 (Sowing and 463 Harvesting of Water before COVID-19, Manglaralto 2022), with code No. PG03-PY22-03. Finally, the authors thank Ximena Quiñonez for her support in this study. The authors also thank the network "Water Sowing and Harvesting in Protected Natural Areas of Iberoamerica (CYTED, acronym in Spanish).
[1] AQUASTAT. (2010). AQUASTAT-FAO’s global information system on water and agriculture.
[2] FAO. (2021). El estado de los recursos de tierras y aguas del mundo para la alimentación y la agricultura. https://doi.org/https://doi.org/10.4060/cb7654es
[3] Burek, P., Satoh, Y., Fischer, G., Taher Kahil, M., Scherzer, A., Tramberend, S., Fabiola Nava, L., Wada, Y., Eisner Martina Flörke Naota Hanasaki Piotr Magnuszewski, S., Wiberg, D., Cosgrove, B. (2016). Water futures and solution fast track initiative-final report.
[4] UNESCO. (2020). Agua y Cambio Climático.
[5] Skorupka, M., Nosalewicz, A. (2021). Ammonia volatilization from fertilizer urea. A new challenge for agriculture and industry in view of growing global demand for food and energy crops. Agriculture, 11(9): 822. https://doi.org/10.3390/agriculture11090822
[6] Gobashy, M.M., Metwally, A.M., Abdelazeem, M., Soliman, K.S., Abdelhalim, A. (2021). Geophysical exploration of shallow groundwater aquifers in arid regions: a case study of siwa oasis, Egypt. Natural Resources Research, 30(5): 3355-3384. https://doi.org/10.1007/s11053-021-09897-3
[7] Akter, A., Uddin, A.M.H., Wahid, K.B., Ahmed, S. (2020). Predicting groundwater recharge potential zones using geospatial technique. Sustainable Water Resources Management, 6: 1-13. https://doi.org/10.1007/s40899-020-00384-w
[8] Peñuela-Arévalo, L.A., Carrillo-Rivera, J.J. (2013). Discharge areas as a useful tool for understanding recharge areas, study case: Mexico Catchment. Environmental Earth Sciences, 68(4): 999-1013. https://doi.org/10.1007/s12665-012-1803-z
[9] Aldana González, G. (2021). Caracterización hidrogeológica en el área urbana de Santo Domingo, Chontales, Nicaragua. Revista Tierra, 1(1).
[10] Abdalla, F. (2012). Mapping of groundwater prospective zones using remote sensing and GIS techniques: A case study from the Central Eastern Desert, Egypt. Journal of African Earth Sciences, 70: 8-17. https://doi.org/10.1016/j.jafrearsci.2012.05.003
[11] Famiglietti, J.S. (2014). The global groundwater crisis. Nature Climate Change, 4(11): 945-948. https://doi.org/10.1038/nclimate2425
[12] Foster, S., Garduno, H., Evans, R., Olson, D., Tian, Y., Zhang, W., Han, Z. (2004). Quaternary aquifer of the north china plain assessing and achieving groundwater resource sustainability. Hydrogeology Journal, 12(1): 81-93. https://doi.org/10.1007/s10040-003-0300-6
[13] Zepeda Quintana, D.S., Loeza Rentería, C.M., Munguía Vega, N.E., Peralta, J.E., Velazquez Contreras, L.E. (2018). Sustainability strategies for coastal aquifers: A case study of the Hermosillo Coast aquifer. Journal of Cleaner Production, 195: 1170-1182. https://doi.org/10.1016/j.jclepro.2018.05.191
[14] Boggiano, M. (2019). Los 10 Países con Mayores Reservas de Agua Dulce.
[15] FAO. (2020). ¡Hoy es el día mundial del agua! FAO Regional Office for Latin America and the Caribbean.
[16] Carrión-Mero, P., Morante-Carballo, F. (2020). The context of Ecuador’s world heritage, for sustainable development strategies. International Journal of Design & Nature and Ecodynamics, 15: 39-46. https://doi.org/10.18280/ijdne.150106
[17] Ramírez-Coronel, R., Ramón-Poma, G. (2022). Estudio preliminar para la implementación de un sistema de microgeneración hidroeléctrico, para autoconsumo, en la Hostería El Reventador. Revista Científica FIPCAEC (Fomento de la Investigación y Publicación en Ciencias Administrativas, Económicas y Contables), 7(1): 275-311.
[18] Campos, A., Banda, R., Sinichenko, E., Gritsuk, I. (2016). Distribución per cápita del agua en el Ecuador. Revista Científica de Ciencias Naturales y Ambientales, 10(1): 29-36.
[19] FAO. (2015). Perfil de País-Ecuador.
[20] Carrión-Mero, P., Curz, M.L., Herrera-Franco, G. (2019). Ecuador. In J. M. F. Azcoit (Ed.), Las Aguas Subterráneas en la Legislación Iberoamericana: Retos y Oportunidades Publicaciones del Instituto Geológico y Minero de España Serie: Hidrogeología y Aguas Subterráneas, No 37 Las Aguas Subterráneas en la Legislación Iberoamericana, pp. 79-94.
[21] Rosales, J.M.D. (2021). Análisis de la situación de Ecuador en el cumplimiento del Objetivo de Desarrollo Sostenible 6: Agua Limpia y Saneamiento, año 2019. Pontificia Universidad Católica del Ecuador.
[22] Cabrera, H., Garcés, M., Paredes, P. (2012). Proyecto de desarrollo de Capacidades para el uso seguro de aguas servidas en agricultura. Producción de Aguas Servidas, Tratamiento y Uso En El Ecuador, 45-49.
[23] Salvatierra, B., Ortega, J., Amador, L. (2010). Evaluación ecológica rápida de la Herpetofauna en la cordillera Chongón Colonche, Ecuador. Investigación Tecnología e Innovación, Universidad de Guayaquil.
[24] Sierra, R. (2013). Patrones y factores de deforestación en el Ecuador continental, 1990-2010. Y un acercamiento a los próximos 10 años.
[25] Sánchez Pincay, M. (2021). Análisis de la articulación de actores en el proceso de territorialización de la implementación de la política agrícola en Santa Elena. Facultad Latinoamericana de Ciencias Sociales.
[26] Burbano, N., Becerra, S., Pasquel, E. (2015). Introducción a la hidrogeología del Ecuador.
[27] Morante, F., Montalván, F.J., Carrión, P., Herrera, G., Heredia, J., Elorza, F.J., Pilco, D., Solórzano, J. (2019). Hydrochemical and geological correlation to establish the groundwater salinity of the coastal aquifer of the Mangla alto river basin, Ecuador. WIT Transactions on Ecology and the Environment, 139-149. https://doi.org/10.2495/WRM190141
[28] Herrera-Franco, G., Carrión-Mero, P., Briones-Bitar, J. (2020). Aplicación del conocimiento ancestral mediante albarradas y tapes en la gestión del agua en la provincia de Santa Elena, Ecuador. Boletín Geológico y Minero, 131(1): 75-88. https://doi.org/10.21701/bolgeomin.131.1.005
[29] Pin, M., Coque, J., Palacios, C. (2019). Planificación del comercio colectivo en la comuna La Aguadita, Parroquia colonche, Ecuador. Universidad y Sociedad, 5(11): 90-107.
[30] Tomalá, C. (2017). Estudio de Factibilidad para la Instalación de una Planta Purificadora de Agua Aprovechando las Fuentes Naturales Existentes y Abastecer la Demanda del Líquido Vital a la Comuna La Aguadita, de la Parroquia Colonche, Cantón Santa Elena, Provincia de Santa. Universidad Estatal Península de Santa Elena.
[31] CONGOPE. (2021). Cambio Climático, Desarrollo Territorial y Gobiernos Locales: Lecciones de la Crisis Sanitaria: Vol. XIV (A. Carrión (ed.); Editorial). Incidencia Pública Ecuador.
[32] Pozo, K. (2021). Composición, Estructura y Diversidad Florística del bosque seco en la comuna La Aguadita – San Marcos, de la provincia de Santa Elena. Universidad Estatal Península de Santa Elena.
[33] Pin, M., Coque, J., Palacios, C. (2019). Planificación del comercio colectivo en la comuna La Aguadita, Parroquia colonche, Ecuador. Universidad y Sociedad, 5(11): 90–107.
[34] GAD Parroquial Colonche. (2015). Plan de Desarrollo y Ordenamiento Territorial 2015 - 2019. Colonche, Santa Elena, pp. 1-231.
[35] Serrano, V. (2016). Caracterización Agro-socioeconómica de la Comuna La Aguadita, Parroquia Colonche, Cantón Santa Elena, Provincia de Santa Elena. Universidad Estatal Península de Santa Elena.
[36] Guerrero Jácome, A. (2020). Propuesta de un prototipo de vivienda incremental para la comunidad La Aguadita mediante la utilización de métodos participativos. Universidad de Especialidades Espíritu Santo.
[37] Cipat-Espol, Senagua, Aecid, D. (2014). Proceso: Re-Senagua-026-2012. Proyecto: Elaboración del mapa hidrogeológico a escala 1:250.000. Informe final.
[38] NASA. (2020). NASA POWER-Prediction of Worldwide Energy Resources. The POWER Project.
[39] Trajkovic, S., Kolakovic, S. (2009). Evaluation of reference evapotranspiration equations under humid conditions. Water Resour Manage, 23: 3057. https://doi.org/10.1007/s11269-009-9423-4
[40] Ruggieri, G., Allocca, V., Borfecchia, F., Cusano, D., Marsiglia, P., De Vita, P. (2021). Testing evapotranspiration estimates based on MODIS satellite data in the assessment of the groundwater recharge of karst aquifers in southern Italy. Water (Switzerland), 13(2): 118. https://doi.org/10.3390/w13020118
[41] Trajkovic, S., Gocic, M., Pongracz, R., Bartholy, J. (2019). Adjustment of Thornthwaite equation for estimating evapotranspiration in Vojvodina. Theoretical and Applied Climatology, 138: 1231-1240. https://doi.org/10.1007/s00704-019-02873-1
[42] Ahmadi, S.H., Fooladmand, H.R. (2008). Spatially distributed monthly reference evapotranspiration derived from the calibration of Thornthwaite equation: a case study, South of Iran. Irrigation Science, 26: 303-312. https://doi.org/10.1007/s00271-007-0094-8
[43] Golden Software. (2022). Surfer 2D & 3D mapping, modeling & analysis software for scientists and engineers. Surfer Explore the depths of your data. https://www.goldensoftware.com/products/surfer, accessed on May. 16, 2022.
[44] ESRI. (2021). ArcGIS Desktop. Environmental Systems Research Institute; ESRI. https://www.esri.com/en-us/arcgis/products/arcgis-pro/overview, accessed on Jan. 6, 2022.
[45] EOS. (2022). NASA´s Earth Observing System. NASA’s Earth Observing System Project Science Office. https://eospso.nasa.gov/content/nasas-earth-observing-system-project-science-office, accessed on Jun. 18, 2022.
[46] Benson, R., Glaccum, R., Noel, M. (1982). Geophysical techniques for sensing buried wastes and waste migration. National G, Issue 1931862869.
[47] Davydov, V.A., Fedorova, O.I., Gorshkov, V.Y., Baydikov, S.V. (2021). Assessment of state of earth dam of Elchovka settling pond by combination of electromagnetic soundings and polarization methods. Studia Geophysica et Geodaetica, 65(2): 206–218. https://doi.org/10.1007/s11200-020-0114-1
[48] Martínez, E. (2019). Modelación hidrodinámica de la relación acuífero granular y presa ubicada en San Pablo Huitzo, Oaxaca. Instituto Politécnico Nacional.
[49] IRIS Instruments. (2022). Download x2ipi data processing for 2D resistivity imaging. IPI2win Software. http://x2ipi.ru/downloads, accessed on May. 17, 2022.
[50] Fine Spol. (2022). Fine. GEO5 Software Geotécnico. https://www.finesoftware.eu/geotechnical-software/, accessed on June. 26, 2022.
[51] INAMHI. (2021). Anuarios Meteorológicos 1990 - 2021.
[52] MAE. (2015). Norma de Calidad Ambiental y de Descarga De Efluentes: Recurso Agua. Libro Vi Anexo 1.
[53] SNI. (2014). Sistema Nacional de Información. IEDG Geoportal. https://sni.gob.ec/inicio, accessed on Dec. 1, 2022.
[54] IGM. (2013). Capas de Información Geográfica Básica del IGM de Libre Acceso. Cartas Topográficas Escala 1:50.000, Formato Shp. http://www.geoportaligm.gob.ec/portal/index.php/cartografia-de-libre-acceso-escala-50k/, accessed on June. 5, 2022.
[55] Herrera-Franco, G., Carrión Mero, P., Alvarado, N. (2018). Participatory process for local development: sustainability of water resources in rural communities: case manglaralto-santa elena, ecuador. Handbook of Sustainability Science and Research, pp. 663-676. https://doi.org/10.1007/978-3-319-63007-6_41
[56] Herrera-Franco, G., Alvarado-Macancela, N., Gavín-Quinchuela, T., Carrión-Mero, P. (2018). Participatory socio-ecological system: Manglaralto-Santa Elena, Ecuador. Geology, Ecology, and Landscapes, 2(4): 303-310. https://doi.org/10.1080/24749508.2018.1481632
[57] Carrión-Mero, P., Morante-Carballo, F., Herrera-Franco, G., Jaya-Montalvo, M., Rodríguez, D., Loor-Flores de Valgas, C., Berrezueta, E. (2021). Community-university partnership in water education and linkage process. Study case: Manglaralto, Santa Elena, Ecuador. Water, 13(15): 1998. https://doi.org/10.3390/w13151998
[58] Carrión-Mero, P., Montalván, F.J., Morante-Carballo, F., Heredia, J., Elorza, F.J., Solórzano, J., Aguilera, H. (2021). Hydrochemical and isotopic characterization of the waters of the Manglaralto river basin (Ecuador) to contribute to the management of the coastal aquifer. Water, 13: 537. https://doi.org/10.3390/w13040537
[59] WHO. (2017). Guidelines for drinking-water quality. 4th edition, incorporating the 1st addendum (W. H. Organization (ed.)).
[60] MRCCC. (2022). Mary river catchment coordinating committee. water quality salinity standards. https://mrccc.org.au/, accessed on Apr. 13, 2022.