Achmad Hasan Hafidzi*![]() | Eko Budi Satoto
| Eko Budi Satoto![]() | Retno Endah Supeni
| Retno Endah Supeni![]()
© 2023 IIETA. This article is published by IIETA and is licensed under the CC BY 4.0 license (http://creativecommons.org/licenses/by/4.0/).
OPEN ACCESS
The COVID-19 pandemic has had a huge impact on all aspects of the company's life cycle. Some companies are even unable to maintain optimal performance like before during the pandemic. Corporate social responsibility activities that are considered to provide good faith to the good name of the company that contribute to increasing stock returns. However, corporate social responsibility activities are maximized because the costs are chosen for activities around the environment carried out by large-scale companies on the Compass Index 100. This study aims to determine the effect of corporate social responsibility and company size on stock returns through Return on Equity in companies listed on Kompas 100 Index after the COVID-19 Pandemic. The population in this study covers all companies that are members of the Kompas 100 Index and are registered with Indonesia Stock Exchange (IDX). The sample method used is purposive sampling. The data analysis technique used is Structural Equation Modeling (SEM) analysis. The results showed that corporate social responsibility and company size affect Return on Equity and stock returns, and Return on Equity affects stock returns. The demand for shares of companies listed on the Kompas 100 Index is classified as the most consistent because it takes into account the company's sustainability in the future by allocating corporate social responsibility costs to build the company's good name. Corporate social responsibility activities are the example of the company's concern for the surrounding environment which aims to be able to increase the company's Return on Equity. In line with the higher level of Return on Equity, the size of the company as measured by total assets has also increased.
corporate social responsibility, firm size, return on equity, stock return
The COVID-19 Pandemic is one of the most dangerous phenomena in the world in the last century. The COVID-19 Pandemic has not only caused health problems, but has also caused social impacts such as public panic, confidence crisis, and the most severe impact is a slowdown in national economic growth. The COVID-19 Pandemic will cause economic losses which will be reflected in stock price movements. Since the beginning of 2022, stock trading conditions on the Indonesian Stock Exchange have experienced significant pressure as indicated by the decline in the Jakarta Composite Index (IHSG). The Financial Services Authority (OJK) revealed that the Composite Stock Price Index (IHSG) fell significantly to its lowest level in history due to the spread of the COVID-19, especially in March 2022 [1].
Stock return is one measure of the assessment or perspective of investors about the quality of the company associated with stock prices and profitability. If the stock returns are high, the value of Return on Equity will increase every year, because investors are interested in putting their shares into the company. However, the sustainability of a company with its financial condition alone is not sufficiently guaranteed because it must focus on social and environmental measurements [2-5].
Corporate Social Responsibility (CSR) is an idea that makes companies no longer faced with responsibilities that are based on a single bottom line, namely corporate value which is classified in terms of its financial condition only. However, corporate responsibility must be based on the triple bottom lines, namely financial, social and environmental. This is because the financial condition alone is not enough to guarantee the company's value to grow sustainably. The company's sustainability will only be guaranteed if the company pays attention to the social and environmental dimensions. CSR, which was originally voluntary, needs to be upgraded to become a mandatory CSR [6-8].
This research will be conducted at the Indonesia Stock Exchange (IDX), especially for stocks listed on the Kompas 100 Index in 2021. The reason for choosing the object of this research is because the stocks are on the Kompas 100 Index. This index contains 100 stocks that have the category of having good liquidity, high market capitalization, strong fundamentals, and good company performance. The stocks included in the Kompas 100 Index are the main stocks driving the Jakarta Composite Index (IHSG). The movement of the Kompas 100 Index is only influenced by 100 selected stocks which are always selected, while the JCI movement is influenced by all stocks listed on the IDX, including stocks that have never had any transactions.
Empirically, the problem of the influence of corporate social responsibility and company size on stock returns through Return On Equity is still controversial in the existing literature [9-17] states that corporate social responsibility and company size affect Return On Equity and Stock Return. However, there is a research gap in research from [5, 18-20] showing that corporate social responsibility and Return on Equity do not affect stock returns. Research contribution to stakeholders in making decisions regarding stock transactions traded with the Kompas 100 Index Issuer after the COVID-19 Pandemic. The buy-sell turmoil of Kompas 100 Index Issuers shares after the COVID-19 Pandemic subsided resulted in operational activities recovering so that the company could maximize its company's performance. Improving company performance is one of the stakeholder considerations in obtaining high stock returns. The latest in this research is the use of Return on Equity as an intervening variable because Return on Equity is one of the benchmarks for a company's ability to earn profits in relation to its capital. In addition, based on signal theory, the relationship between Return on Equity and stock returns is positive, meaning that if Return on Equity increases, then stock returns also increase. Based on the problems above, this study aims to determine the effect of corporate social responsibility and company size on stock returns through Return on Equity in companies listed on Kompas 100 Index after the COVID-19 Pandemic.
2.1 Sample selection and description
The population in this study is all companies that are members of Kompas 100 Index and are listed on the Indonesia Stock Exchange. The sample in this study was selected by using purposive sampling where the sample was selected with certain criteria. The criteria used are companies that are listed in 2022 and have disclosed financial reports for research needs [21, 22]. The 2022 period is a strategic step in rebuilding the economy, one of which is the company's stock performance. Indonesian Government Regulation No. 23 of 2020 concerning the National Economic Recovery Program as a concrete manifestation of the Government of Indonesia in reviving the economy and restoring investor confidence in investing in companies in Indonesia. The reason for choosing the Kompas 100 Index companies is that the Kompas 100 Index is the most important after the IHSG during the post-COVID-19 pandemic, because it has a larger number of companies, reflecting the market direction after the COVID-19 pandemic compared to the JCI and other stock indices in Indonesia such as LQ45, JII and Business Index 27.
Data analysis techniques are used to answer the formulation of the problem or test the hypotheses that have been formulated. Data management in this study will use smart PLS software. Structural Equation Modeling (SEM) is a method used to cover the weaknesses in the regression method.
The reason for choosing the Structural Equation Modeling (SEM) method is due to the use of ROE (Return on Equity) intervening variables in intervening CSR (Corporate Social Responsibility) and Size in influencing stock returns accurately. The researches [11, 13, 15, 16] uses the multiple linear regression analysis methods, but there is a weakness, namely, this method only looks at the direct effect between independent variables and dependent ones without looking at the previous average variable. Researches of [9, 10, 14, 17] uses the path analysis method which has the disadvantage of not being able to detect the role of mediation automatically or must involve manual calculations which slows down the process research result. Researches of [23-25] uses a qualitative descriptive method where there are weaknesses in this method, namely only one company object is used so that the results of the research cannot be generalized later.
The Structural Equation Modeling (SEM) research method is grouped into two approaches, namely the Covariance Based SEM (CBSEM) and Variance Based SEM or Partial Least Square (PLS) approaches. Partial Least Square is a powerful analysis method which is not based on many assumptions. PLS (Partial Least Square) approach is distribution free (does not assume certain data, can be in the form of nominal, category, ordinal, interval and ratio). PLS uses the bootstrapping method or random multiplication where the assumption of normality will not be a problem for PLS. Besides, PLS does not require a minimum number of samples to be used in research. In other words, studies that have small samples can still use PLS. Partial Least Square is classified as a non-parametric type, therefore, in PLS modeling, data with normal distribution is not required [26-28].
2.2 Dependent variable
Stock return is one of the factors that reason for capital owners to invest. Stock return is a reward for the courage of investors to bear the risk of the investment they make. The return component consists of two types, namely current income, and capital gain. Current profit (current income) is profit obtained through periodic payments, such as payment of interest on deposits, interest on bonds, dividends, and so on. While the profit difference in price (capital gain) is the profit received due to the difference between the selling price and the purchase price of an investment instrument. Income in this case is related to capital gains along with transactions on the stock exchange so that it makes a positive contribution to the value of stock returns. Dependent variable in this study can be seen in table 1.
Table 1. Definition of research variables
|
Variable |
Definition |
Formula |
|
Rit [12] |
Stock Return |
$\mathrm{R}_{\mathrm{it}}=\frac{P_{i t}-P_{i t-1}}{P_{i t-1}}$ |
|
CSR [2] |
Corporate Social Responsibilty |
CSRDIj = $\frac{\sum X i j}{n j}$ |
|
ROE [8] |
Return on Equity |
$R O E=\frac{\text { EAT }}{\text { Total } \cdot \text { Quity }} \cdot x \cdot 100 \%$ |
|
SIZE [29] |
Firm Size |
SIZE = Ln (Total Assets) |
2.3 Independent variable
Corporate Social Responsibility is a form of corporate responsibility to fix social and environmental problems that occur as a result of the company's operational activities. Corporate Social Responsibility plays a very important role in increasing the value of the company. Implementation of Corporate Social Responsibility (CSR), it is expected that the level of company profitability will also increase. Therefore, Corporate Social Responsibility (CSR) plays an important role in increasing company value as a result of increasing company sales by carrying out various social activities in the surrounding environment. Return on Equity describes the company's ability to generate net income based on certain capital it has. Companies tend to make broader disclosures in their annual reports if they are in a profitable position. Company size is the level of a company that shows the wealth of the company through the capacity of the workforce, production capacity, and capital capacity it uses. Independent variable in this study can be seen in table 1.
3.1 General description
The Kompas 100 Index is a stock index of 100 shares of public companies traded on the IDX. The Kompas 100 Index is officially published by the IDX in collaboration with the Kompas newspaper. In the index period used in this study, there were several companies that had to be excluded from the sample because they did not meet the predetermined criteria. So that the sample of companies used in the study totaled 83 companies where 83 of these companies were listed in one period in 2022 and had disclosed the data needed in the research. Therefore, the sample taken in this study is 83 data from 83 companies which are listed on the Indonesia Stock Exchange consecutively.
3.2 Descriptive statistics
After analyzing the 83 research data, the next step is to process the descriptive statistical data of the research variables. The results of processing the descriptive statistical data of the research variables are shown in Table 2 below:
Table 2. Results of descriptive statistics
|
Note |
Corporate Social Responsibilty |
Firm Size |
Return on Equity |
Stock Return |
||||
|
Before COVID-19 |
After COVID-19 |
Before COVID-19 |
After COVID-19 |
Before COVID-19 |
After COVID-19 |
Before COVID-19 |
After COVID-19 |
|
|
Min |
0.128 |
0.087 |
25.112 |
23.216 |
0.081 |
0.005 |
0.138 |
-0.920 |
|
Max |
0.812 |
0.373 |
38.192 |
33.864 |
0.672 |
0.217 |
0.991 |
0.614 |
|
Mean |
0.414 |
0.180 |
33.913 |
29.208 |
0.239 |
0.042 |
0.456 |
0.134 |
|
Std.Dev |
0.131 |
0.057 |
3.149 |
2.696 |
0.132 |
0.042 |
0.298 |
0.211 |
Source: Processed Data. 2022.
The Corporate Social Responsibility variable before COVID-19 showed an average value (mean) of 0.414, meanwhile after COVID-19 shows an average value (mean) of 0.180. This indicates that the area of Corporate Social Responsibility disclosure before the COVID-19 Pandemic was larger when compared to after the COVID-19 Pandemic. The existence of several companies experiencing financial difficulties will tend to reduce the allocation of Corporate Social Responsibility because it is considered to have an impact on increasing company costs in operational activities. The lowest value of the Corporate Social Responsibility variable before COVID-19 is 0.128 and the highest value is 0.812, meanwhile after COVID-19 The lowest value is 0.087 and the highest value is 0.373. The standard deviation before COVID-19 is 0.131 and after COVID-19 is 0.057.
The Firm Size variable before COVID-19 showed an average value (mean) of 33.913, meanwhile after COVID-19 shows an average value (mean) of 29.208. This means that several companies in the Kompas 100 index that sell some of their assets in the decision to face uncertain economic conditions. The value of selling company assets has an impact on decreasing company size so that it is one of the triggers for a decline in share value. The lowest value of the Firm Size variable before COVID-19 is 25.112 and after COVID-19 is 23.216. The highest value before COVID-19 is 38.192, meanwhile after COVID-19 is 33.864. The standard deviation before COVID-19 is 3.149 and after COVID-19 is 2.696
The Return on Equity variable before COVID-19 showed an average value (mean) of 0.456 and after COVID-19 is 0.042. Return On Equity is an indicator of the success of a company's performance in generating profits so there is a sharp decrease in the average Return On Equity value for companies listed on the Kompas 100 index experiencing losses. The lowest value of the Return on Equity variable before COVID-19 is 0.081 and after COVID-19 is 0.005. The highest value before COVID-19 is 0.672 and after COVID-19 is 0.217. The standard deviation before COVID-19 is 0.132, meanwhile after COVID-19 is 0.298.
The Stock Return variable before COVID-19 shows an average value (mean) of 0.456 and after COVID-19 is 0.134. In stock trading before the Covid 19 Pandemic, the value of shares as a whole experienced an increase but conditions reversed when the global threat hit so Stock Return experienced a decrease in the value of returns to all investors. The lowest value of the Stock Return variable before COVID-19 is 0.138 and after COVID-19 is -0.920. The highest value before COVID-19 is 0.991 and after COVID is 0.614. The standard deviation before COVID-19 is 0.298, meanwhile after COVID-19 is 0.211.
Based on the results of processing the descriptive statistical data of the research variables, it shows that there are differences in real conditions where companies before COVID-19 had a wider allocation of Corporate Social Responsibility disclosures, high Return on Equity from operational activities, investment, and funding activities. Larger company size as a positive impact increasing the number of actives so that these things are considered as a trigger for increasing stock returns. However, the COVID-19 incident that occurred throughout the world including in Indonesia gave several problems including stock market uncertainty, sluggish demand for shares, and decreased performance of company funding activities.
3.3 Validity test
The discriminant validity test uses the cross-loading value. An indicator is declared to meet discriminant validity if the indicator's cross-loading value on the variable is the largest compared to other variables. The following is the cross-loading value of each research variable:
Based on the data presented in table 3 above, it can be seen that each indicator in the research variable has a cross-loading value > Rtable. Based on the results obtained, it can be stated that the variables used in this study already have good discriminant validity in compiling their respective variables.
Table 3. Discriminant validity
|
Variable |
Cross Loading Value |
Rtabel |
Description |
|
Corporate Social Responsibility (X1) |
0.706 |
0.266 |
Valid |
|
Firm Size (X2) |
0.646 |
0.266 |
Valid |
|
Return on Equity (Z) |
0.749 |
0.266 |
Valid |
|
Stock Return (Y) |
0.848 |
0.266 |
Valid |
Source: Processed Data. 2022.
3.4 Reliability test
The reliability test with the composite reliability above can be strengthened by using the Cronbach alpha value if it has a Cronbach alpha value > 0.7. The following is the Cronbach alpha value of each variable in this study:
Table 4. Reliability test result
|
Variabel |
Cronbach Alpha |
|
Corporate Social Responsibility (X1) |
0.743 |
|
Firm Size (X2) |
0.786 |
|
Return on Equity (Z) |
0.757 |
|
Stock Return (Y) |
0.773 |
Source: Processed Data. 2022.
Based on the data presented above in table 4, it can be seen that the Cronbach alpha value of each research variable is > 0.7. Thus these results can indicate that each research variable has met the requirements for the Cronbach alpha value. Thus, it can be concluded that all variables have a high level of reliability.
3.5 Multicollinearity test
A multicollinearity test was conducted to determine the relationship between indicators, to find out whether formative indicators experience multicollinearity by knowing the VIF value. VIF values between 5 and 10 means the indicator does not have multicollinearity. The following are the results of the multicollinearity test for each of the variables in this study.
Table 5. Variance inflation factors
|
Variable |
VIF |
|
Corporate Social Responsibility (X1) |
3.730 |
|
Firm Size (X2) |
1.866 |
|
Return on Equity (Z) |
3.874 |
|
Stock Return (Y) |
|
Source: Processed Data. 2022.
Based on Table 5, the results of the multicollinearity test show that the VIF value is below 10 so it can be said that for each of the research variables there is no multicollinearity.
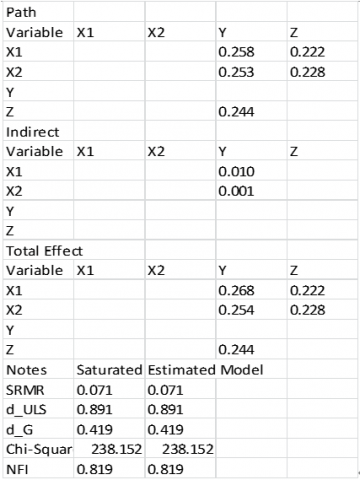
3.6 Goodness of Fit (GOF)
The Goodness of Fit test is used to test the feasibility of the model used in the study. The F test is significant. Therefore, the model is feasible to study. In other words, the model is fit. It is said to be feasible if the data fits (matches) the research model equation. Following are the results of the Goodness of Fit Test in this study:
Table 6. Goodness of fit
|
Notes |
Saturated Model |
Estimated Model |
|
SRMR |
0.071 |
0.071 |
|
d_ULS |
0.891 |
0.891 |
|
d_G |
0.419 |
0.419 |
|
Chi-Square |
238.152 |
238.152 |
|
NFI |
0.819 |
0.819 |
Source: Processed Data. 2022.
Based on table 6, the results of the Goodness of Fit test, the SRMR value is 0.071 <0.1 and the NFI is 0.819 close to 1. This means that the model in this study is fit.
3.7 Partial Least square
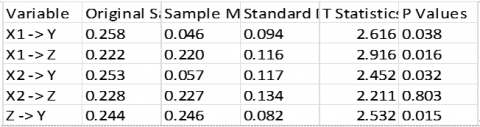
Based on the data processing that has been done, the results can be used to answer the hypothesis in this study. Hypothesis testing in this study was carried out by looking at the T-Statistics values and P-Values. The research hypothesis can be declared accepted if the P-Values <0.05. The following are the results of hypothesis testing obtained in this study through the inner model:
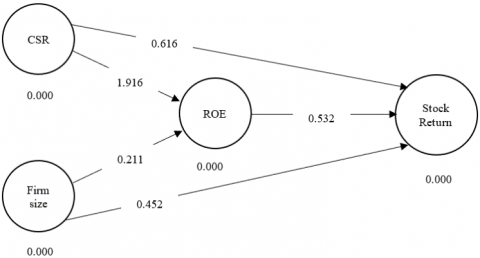
Figure 1. Test result
From Figure 1, the results of the research hypothesis testing model in the picture above, then it can be seen the direct and indirect effects of the relationship between the variables.
3.8 Results of Testing the Effect of Inter-Variables
The results of testing the direct effect of the relationship between variables can be seen in the following table:
Table 7. Influence between variables
|
Variable |
Path Coefficients |
P-value |
Result |
|
Corporate Social Responsibilty – Return on Equity |
1.916 |
0.000 |
Significant |
|
Firm Size – Return on Equity |
0.211 |
0.000 |
Significant |
|
Corporate Social Responsibilty – Stock Return |
0.616 |
0.000 |
Significant |
|
Firm Size – Stock Return |
0.452 |
0.000 |
Significant |
|
Return on Equity – Stock Return |
0.532 |
0.000 |
Significant |
Source: Processed Data. 2022.
Based on the direct influence test from Figure 1 and Table 7 above, it can be seen that the path coefficients of Corporate Social Responsibility on Return on Equity are β = 1.916 which is positive. The p-value is 0.000. This result is significant because the p-value is less than 0.05. So based on the calculated value of path coefficients and p-values on the influence relationship between variables, Corporate Social Responsibility affects on Return on Equity.
The path coefficients of Firm Size to Return on Equity are β = 0.211, which is positive. The p-value is 0.000. This result is significant because the p-value is less than 0.05. Thus, based on the calculated value of path coefficients and p-values on the influence relationship between variables, Firm Size affects on Return on Equity
The path coefficients of Corporate Social Responsibility for Stock Return are β = 0.616, which is positive. The p-value is 0.000. This result is significant because the p-value is less than 0.05. So, based on the calculated value of path coefficients and p-values on the influence relationship between variables, Corporate Social Responsibility affects Stock Return.
The path coefficients of Firm Size to Stock Return are β = 0.452, which is positive. The p-value is 0.000. This result is significant because the p-value is less than 0.05. So, based on the calculated value of path coefficients and p-values on the influence relationship between variables, Firm Size affects Stock Return.
The value of the path coefficients of Return on Equity to Stock Return is β = 0.532, which is positive. The p-value is 0.000. This result is significant because the p-value is less than 0.05. So, based on the calculated value of path coefficients and p-values on the influence relationship between variables, Return on Equity affects Stock Return.
3.9 Discussion
The results of the research hypothesis testing show that CSR affects ROE by looking at the significance level of 0.000. This means that the higher the CSR the higher the ROE. Based on the results of descriptive statistics, the lowest CSR value is 0.0879. The low value of CSR disclosure is because the company is engaged in the construction sector where the real estate and property sectors are greatly affected by the reduction in development priorities. The allocation of construction development during the COVID-19 pandemic tends to be diverted to reduce the spread of the coronavirus, such as vaccination, causing CSR activities to be low. Meanwhile the value of CSR is equal to 0.3736. The online marketing strategy implemented by the company can provide maximum benefits to the company's profits in the era of the COVID-19 Pandemic so that CSR activities are consistently carried out as a form of forming the company's good reputation. Research conducted by the researches of [30-32] state that CSR affects ROA.
The results of the research hypothesis testing show that company size affects ROE by looking at the significance level of 0.000. This means that the higher the size of the company the higher the ROE. Based on the results of descriptive statistics, the value of the lowest company size is 23.215. The low value of the size of the company is because this company is one of the diversifications of mining companies engaged in investment so that they do not have too high several assets. Meanwhile, the highest Company Size value was 33.863. One of the companies listed on the Kompas 100 Index is one of the largest cigarette-producing companies in Indonesia that has a high number of assets. The company can optimally manage its resources so that it supports the company's goal of generating high profits. Research conducted by the researches [20, 33, 34] state that Company Size affects ROE.
The results of the research hypothesis testing show that CSR has an effect on ROE by looking at the significance level of 0.000. This means that the higher the CSR the higher the ROE. Based on the results of descriptive statistics, the value of CSR is -0.92. The low value of stock returns is due to several large-scale social restrictions policies that reduce investor interest in buying company shares as a provider of transportation facilities and result in a decrease in CSR allocation. Meanwhile, the highest CSR value is 0.614. PT. Bank Central Asia, Tbk., one of the companies on the Kompas 100 Index Issuer as the largest banking company in Indonesia was able to show optimal performance throughout 2021 so that stakeholders responded positively and the allocation of CSR became a priority. Research conducted by the references [35-40] state that CSR affects Stock Return.
The results of the research hypothesis testing show that Company Size affects Stock Return by looking at the significance level of 0.000. This means that the higher the size of the company the higher the stock returns. Based on the results of descriptive statistics, the value of the lowest company size is 23.215. The low value of the size of the company causes the low value of stock returns so investors' interest in owning company shares is also relatively declining. Meanwhile, the highest Company Size value was 33.863. One of the companies listed on the Kompas 100 Index, which is the largest corporate giant in Indonesia, can provide a good assessment in the minds of stock investors. Research conducted by [41, 42] state that Company Size has an effect on Stock Return.
The results of the research hypothesis testing show that ROE has an effect on Stock Return by looking at the significance level of 0.000. This means that the higher the ROE the higher the Stock Return. Based on the results of descriptive statistics, the value of the lowest company size is 0.005. The low ROE of the company is due to the limitation of the country's territory due to the pandemic because the company operates in the country's territory. Meanwhile, the highest ROE value is at PT. Ace Hardware Indonesia Tbk which is 0.216. One of the companies listed on the Kompas 100 Index is the largest household appliance company in Indonesia, which is able to innovate so as to increase company profits during the current period. Research conducted by [2, 3, 24] state that ROE has an effect on Stock Return.
Based on the results of the research, the companies listed on the Kompas 100 Index in 2021 are all affected by the COVID-19 pandemic. This can be seen from the decrease in value of the Corporate Social Responsibility, Company Size, Return on Equity, and Stock Return variables. The results of the study indicate that there is a positive influence between Corporate Social Responsibility on Return of Equity and Stock Return. Investors see the company's ability to allocate the costs of disclosing Corporate Social Responsibility from the results of operating income. Furthermore, the results of the study show that company size has an influence on Return on Equity and Stock Return. Then the results of the study also show that there is a positive effect of Return on Equity on stock prices. Companies that remain consistent in generating profits in the COVID-19 Pandemic era are considered to have survived so that investors are more interested in these companies and have an impact on increasing the company's stock returns. Return on Equity is able to mediate the effect of Corporate Social Responsibility on Stock Returns. This means that the higher the Return on Equity the higher the allocation in the disclosure of Corporate Social Responsibility. This signal is captured by investors as a good company activity and has a positive impact on Stock Returns. Corporate Social Responsibility activities have an impact on increasing accountability and positive appreciation of investors for buying shares in the company, because of the level of profit (return) offered in the long term. The impact of larger the size of the company, the higher the probability ratio profitability figures so that it can be used to measure the effectiveness of the company's operations in generating profits to provide a good response in terms of stock returns.
The practical implication of this research is that it can contribute useful information related to the role of Return on Equity in mediating the effect of Corporate Social Responsibility and company size on stock returns of Issuers of the Kompas 100 Index after the COVID-19 Pandemic. The practical implications of this research are that it can be an additional insight and knowledge more broadly and used as a reference for further research. This study has limitations that affect the results of the study, namely the criteria in this study are still limited to Kompas 100 Index Issuer companies and the study period range is only one year. Suggestions for future researchers is that it is best to expand the sample criteria to companies that will be used as research samples, for example other manufacturing companies listed on the Indonesia Stock Exchange (IDX). For future researchers, it is hoped that they will add more samples of the research year in order to be able to describe conditions more concretely, for example by using a span of the research period to several years.
The writers would like to thank University of Muhammadiyah Jember for giving financial support of this research under Rp. 7.5 million. Also, special thanks are given to Dr. Udin, MM., from Yogyakarta Muhammadiyah University, Indonesia, for his help and suggestions during the research.
|
Rit |
Stock Return |
|
Pit |
Stock Price company i in t Period |
|
Pit - 1 |
Stock Price company i in t-1 Period |
|
CSRDIj |
Corporate Social Responsibility Disclosure Index j company |
|
nj |
Total criteria for disclosure of Corporate Social Responsibility (CSR) for company j, nj ≤ 91 |
|
∑Xij |
Dummy variable: 1 = if item i is disclosed; 0 = if item i not disclosed |
|
CSR |
Corporate Social Responsibility |
|
ROE |
Return on Equity |
|
EAT |
Earning After Tax |
|
Ln Total Asset |
Log Total Asset |
Appendix A. Data before COVID-19
|
No |
Company Name |
Kode |
CSR |
Firm Size |
ROE |
Stock Return |
|
1 |
PT. Astra Agro Lestari Tbk. |
AALI |
0.725274 |
40.204 |
0.222081603 |
0.43706 |
|
2 |
PT. Ace Hardware Indonesia Tbk. |
ACES |
1.2329658 |
41.226 |
3.613526545 |
0.46293 |
|
3 |
PT. Adhi Karya (Persero) Tbk. |
ADHI |
0.2901096 |
40.597 |
1.684885764 |
0.17797 |
|
4 |
PT. Adaro Energy Tbk. |
ADRO |
0.725274 |
41.483 |
1.682958481 |
0.10439 |
|
5 |
PT. AKR Corporindo Tbk. |
AKRA |
0.5439555 |
39.903 |
1.12782103 |
0.04251 |
|
6 |
PT. Aneka Tambang Tbk. |
ANTM |
0.6527466 |
40.350 |
0.184942514 |
0.07254 |
|
7 |
PT. Agung Podomoro Land Tbk. |
APLN |
0.5439555 |
40.318 |
0.162827299 |
0.09334 |
|
8 |
PT. Astra International Tbk. |
ASII |
0.5076918 |
31.569 |
0.246592366 |
0.14443 |
|
9 |
PT. Adi Sarana Armada Tbk. |
ASSA |
0.5802192 |
40.966 |
1.120732318 |
0.01677 |
|
10 |
PT. Bank Central Asia Tbk. |
BBCA |
0.4714281 |
41.797 |
0.309338551 |
-0.07969 |
|
11 |
PT. Bank KB Bukopin Tbk. |
BBKP |
0.6164829 |
41.583 |
0.748508159 |
0.58682 |
|
12 |
PT. Bank Negara Indonesia (Persero) Tbk. |
BBNI |
0.6164829 |
41.689 |
0.25442568 |
-0.02444 |
|
13 |
PT. Bank Rakyat Indonesia (Persero). Tbk. |
BBRI |
0.5439555 |
39.367 |
0.327287833 |
0.79924 |
|
14 |
PT. Bank Tabungan Negara (Persero) Tbk. |
BBTN |
0.6890103 |
40.392 |
0.40450431 |
0.07228 |
|
15 |
PT. Bank Danamon Indonesia Tbk. |
BDMN |
0.5076918 |
39.772 |
1.615332688 |
0.12662 |
|
16 |
PT. Bekasi Fajar Industrial Estate Tbk. |
BEST |
0.7615377 |
41.327 |
1.4756757 |
0.26338 |
|
17 |
PT. Bank Pembangunan Daerah Jawa Barat dan Banten Tbk. |
BJBR |
0.362637 |
39.188 |
0.224749194 |
-0.117 |
|
18 |
PT. Bank Pembangunan Daerah Jawa Timur Tbk. |
BJTM |
0.6890103 |
41.562 |
0.260540412 |
0.52 |
|
19 |
PT. Bank Mandiri (Persero) Tbk. |
BMRI |
1.2329658 |
39.273 |
0.2355026 |
0.24882 |
|
20 |
PT. Global Mediacom Tbk. |
BMTR |
0.2901096 |
40.349 |
0.23150745 |
0.10829 |
|
21 |
PT. Bank Permata Tbk. |
BNLI |
0.725274 |
39.536 |
0.107987215 |
0.2262 |
|
22 |
PT. Bank Syariah Indonesia Tbk. |
BRIS |
0.5439555 |
40.814 |
0.230767039 |
0.20319 |
|
23 |
PT. Barito Pacific Tbk. |
BRPT |
0.6527466 |
41.477 |
0.862423965 |
-0.24661 |
|
24 |
PT. Bumi Serpong Damai Tbk. |
BSDE |
0.5076918 |
40.659 |
1.433662998 |
0.23231 |
|
25 |
PT. Bank BTPN Syariah Tbk. |
BTPS |
0.5076918 |
39.474 |
0.448956639 |
0.11076 |
|
26 |
PT. Buana Lintas Lautan Tbk. |
BULL |
0.5076918 |
41.132 |
0.221489116 |
-0.34671 |
|
27 |
PT. Sariguna Primatirta Tbk. |
CLEO |
0.4714281 |
39.199 |
0.290923527 |
0.27664 |
|
28 |
PT. Charoen Pokphand Indonesia Tbk. |
CPIN |
0.6164829 |
39.243 |
0.296827232 |
0.62179 |
|
29 |
PT. Ciputra Development Tbk. |
CTRA |
0.6164829 |
40.586 |
1.255049002 |
0.11791 |
|
30 |
PT. Puradelta Lestari Tbk. |
DMAS |
0.5439555 |
41.528 |
1.61425703 |
0.09919 |
|
31 |
PT. Elektronika Nusantara (Elnusa) Tbk. |
ELSA |
0.6527466 |
38.413 |
1.671740947 |
0.19695 |
|
32 |
PT. Erajaya Swasembada Tbk. |
ERAA |
0.5076918 |
38.880 |
1.131333577 |
0.64779 |
|
33 |
PT. XL Axiata Tbk. |
EXCL |
0.6164829 |
38.307 |
0.656696393 |
0.31408 |
|
34 |
PT. Gudang Garam Tbk. |
GGRM |
0.4351644 |
38.601 |
0.366854474 |
0.16432 |
|
35 |
PT. Garuda Indonesia Tbk. |
GIAA |
0.5802192 |
40.856 |
0.21985257 |
0.13767 |
|
36 |
PT. HK Metals Utama Tbk. |
HKMU |
1.1241747 |
36.732 |
0.891248411 |
-0.13975 |
|
37 |
PT. HM Sampoerna Tbk. |
HMSP |
0.2901096 |
44.023 |
0.665313821 |
0.28418 |
|
38 |
PT. Buyung Poetra Sembada Tbk. |
HOKI |
0.725274 |
38.700 |
0.279691595 |
0.22529 |
|
39 |
PT. Indofood CBP Sukses Makmur Tbk. |
ICBP |
0.5439555 |
40.673 |
0.372092808 |
0.0494 |
|
40 |
PT. Indofarma Tbk. |
INAF |
0.6527466 |
36.343 |
0.283977917 |
0.11323 |
|
41 |
PT. Vale Indonesia Tbk. |
INCO |
0.5076918 |
30.972 |
0.516462592 |
-0.05915 |
|
42 |
PT. Indofood Sukses Makmur Tbk. |
INDF |
0.5076918 |
41.857 |
0.188399491 |
0.29614 |
|
43 |
PT. Indika Energy Tbk. |
INDY |
0.5076918 |
40.585 |
0.825886761 |
-0.34463 |
|
44 |
PT. Indah Kiat Pulp & Paper Tbk. |
INKP |
0.4714281 |
35.709 |
1.175501519 |
0.13884 |
|
45 |
PT. Indocement Tunggal Prakarsa Tbk. |
INTP |
0.6164829 |
34.252 |
1.411679777 |
0.27014 |
|
46 |
PT. Indosat Tbk. |
ISAT |
0.5802192 |
32.322 |
0.205771055 |
0.43017 |
|
47 |
PT. Indo Tambangraya Megah Tbk. |
ITMG |
0.5076918 |
30.180 |
0.251003691 |
0.11167 |
|
48 |
PT. JAPFA Comfeed Indonesia Tbk. |
JPFA |
0.6890103 |
34.128 |
0.284680711 |
0.42744 |
|
49 |
PT. Jaya Real Property Tbk. |
JRPT |
0.4351644 |
39.057 |
0.242000641 |
0.4004 |
|
50 |
PT. Jasa Marga (Persero) Tbk. |
JSMR |
0.5439555 |
32.923 |
1.48961584 |
-1.196 |
|
51 |
PT. Kimia Farma Tbk. |
KAEF |
0.725274 |
30.723 |
1.115624959 |
0.43706 |
|
52 |
PT. KMI Wire and Cable Tbk. |
KBLI |
1.2329658 |
37.570 |
0.278502108 |
0.46293 |
|
53 |
PT. Kino Indonesia Tbk. |
KINO |
0.2901096 |
37.931 |
0.341819108 |
0.17797 |
|
54 |
PT. Kalbe Farma Tbk. |
KLBF |
0.725274 |
39.832 |
0.260266852 |
0.10439 |
|
55 |
PT. Link Net Tbk. |
LINK |
0.5439555 |
32.397 |
0.231104772 |
0.04251 |
|
56 |
PT. Lippo Karawaci Tbk. |
LPKR |
0.6527466 |
35.145 |
1.144798194 |
0.07254 |
|
57 |
PT. Matahari Department Store Tbk. |
LPPF |
0.5439555 |
31.982 |
1.386895571 |
0.09334 |
|
58 |
PT. PP London Sumatra Indonesia Tbk. |
LSIP |
0.5076918 |
32.956 |
0.514267106 |
0.14443 |
|
59 |
PT. Malindo Feedmill Tbk. |
MAIN |
0.5802192 |
34.924 |
1.512405104 |
0.01677 |
|
60 |
PT. Mitra Adiperkasa Tbk. |
MAPI |
0.4714281 |
33.359 |
0.273096102 |
-0.07969 |
|
61 |
PT. Merdeka Copper Gold Tbk. |
MDKA |
0.6164829 |
35.855 |
0.203677212 |
0.58682 |
|
62 |
PT. Medco Energi Internasional Tbk. |
MEDC |
0.6164829 |
38.251 |
0.327576321 |
-0.02444 |
|
63 |
PT. Mitra Keluarga Karyasehat Tbk. |
MIKA |
0.5439555 |
38.154 |
0.285678047 |
0.79924 |
|
64 |
PT. Media Nusantara Citra Tbk. |
MNCN |
0.6890103 |
40.349 |
0.23150745 |
0.07228 |
|
65 |
PT. Metrodata Electronics Tbk. |
MTDL |
0.5076918 |
41.159 |
0.303425076 |
0.12662 |
|
66 |
PT. Mayora Indah Tbk. |
MYOR |
0.7615377 |
39.751 |
0.356382888 |
0.26338 |
|
67 |
PT. Perusahaan Gas Negara Tbk. |
PGAS |
0.362637 |
35.524 |
0.604326791 |
-0.117 |
|
68 |
PT. Bank Pan Indonesia Tbk. |
PNBN |
0.6890103 |
33.899 |
0.136179655 |
0.52 |
|
69 |
PT. Panin Financial Tbk. |
PNLF |
1.2329658 |
31.073 |
1.453662712 |
0.24882 |
|
70 |
PT. J Resources Asia Pasifik Tbk. |
PSAB |
0.2901096 |
35.909 |
0.07797389 |
0.10829 |
|
71 |
PT. Bukit Asam Tbk. |
PTBA |
0.725274 |
34.174 |
0.360909599 |
0.2262 |
|
72 |
PT. Pembangunan Perumahan (Persero) Tbk. |
PTPP |
0.5439555 |
41.225 |
1.241028176 |
0.20319 |
|
73 |
PT. Pakuwon Jati Tbk. |
PWON |
0.6527466 |
31.181 |
0.308934352 |
-0.24661 |
|
74 |
PT. Ramayana Lestari Sentosa Tbk. |
RALS |
0.5076918 |
32.185 |
0.266921613 |
0.23231 |
|
75 |
PT. Surya Citra Media Tbk. |
SCMA |
0.5076918 |
32.410 |
0.328918934 |
0.11076 |
|
76 |
PT. Industri Jamu dan Farmasi Sido Muncul Tbk. |
SIDO |
0.5076918 |
31.576 |
0.452790211 |
-0.34671 |
|
77 |
PT. Siloam International Hospitals Tbk. |
SILO |
0.4714281 |
32.594 |
0.980723606 |
0.62179 |
|
78 |
PT. Salim Ivomas Pratama Tbk. |
SIMP |
0.6164829 |
31.559 |
0.535973083 |
0.62179 |
|
79 |
PT. Semen Baturaja (Persero) Tbk. |
SMBR |
0.6164829 |
32.167 |
1.494066346 |
0.11791 |
|
80 |
PT. Semen Gresik Tbk. |
SMGR |
0.5439555 |
35.627 |
1.157768804 |
0.09919 |
|
81 |
PT. Summarecon Agung Tbk. |
SMRA |
0.6527466 |
37.082 |
1.122087557 |
0.19695 |
|
82 |
PT. Selamat Sempurna Tbk. |
SMSM |
0.5076918 |
37.394 |
0.43784112 |
0.64779 |
|
83 |
PT. Surya Pertiwi Tbk. |
SPTO |
0.6164829 |
37.320 |
0.225694698 |
0.31408 |
|
84 |
PT. Sri Rejeki Isman Tbk. |
SRIL |
0.4351644 |
39.491 |
0.235441335 |
0.16432 |
|
85 |
PT. Surya Semesta Internusa Tbk. |
SSIA |
0.5802192 |
38.639 |
0.351897211 |
0.13767 |
|
86 |
PT. Sawit Sumbermas Sarana Tbk. |
SSMS |
1.1241747 |
39.134 |
1.09496997 |
-0.13975 |
|
87 |
PT. Tower Bersama Infrastructure Tbk. |
TBIG |
0.2901096 |
40.379 |
0.271285947 |
0.28418 |
|
88 |
PT. Timah Tbk. |
TINS |
0.725274 |
39.838 |
0.231604418 |
0.22529 |
|
89 |
PT. Pabrik Kertas Tjiwi Kimia Tbk. |
TKIM |
0.5439555 |
40.369 |
0.201006603 |
0.0494 |
|
90 |
PT. Telkom Indonesia (Persero) Tbk. |
TLKM |
0.6527466 |
42.939 |
3.74771855 |
0.11323 |
|
91 |
PT. Sarana Menara Nusantara Tbk. |
TOWR |
0.5076918 |
40.237 |
0.449157524 |
-0.05915 |
|
92 |
PT. Chandra Asri Petrochemical Tbk. |
TPIA |
0.5076918 |
40.524 |
0.237515048 |
0.29614 |
|
93 |
PT. United Tractors Tbk. |
UNTR |
0.5076918 |
39.058 |
0.247732982 |
-0.34463 |
|
94 |
PT. Unilever Indonesia Tbk. |
UNVR |
0.4714281 |
42.850 |
2.322281728 |
0.13884 |
|
95 |
PT. Wijaya Karya Bangunan Gedung Tbk. |
WEGE |
0.6164829 |
41.285 |
3.206598731 |
0.27014 |
|
96 |
PT. Wijaya Karya (Persero) Tbk. |
WIKA |
0.5802192 |
41.288 |
0.227589527 |
0.43017 |
|
97 |
PT. Integra Indocabinet Tbk. |
WOOD |
0.5076918 |
40.207 |
1.395362077 |
0.11167 |
|
98 |
PT. Waskita Beton Precast Tbk. |
WSBP |
0.6890103 |
39.460 |
2.421887937 |
0.42744 |
|
99 |
PT. Waskita Karya (Persero) Tbk. |
WSKT |
0.4351644 |
39.178 |
0.571997915 |
0.4004 |
|
100 |
PT. Wijaya Karya Beton Tbk. |
WTON |
0.5439555 |
38.957 |
0.251829817 |
0.33995 |
Appendix B. Data after COVID-19
|
No |
Company Name |
Kode |
CSR |
Firm Size |
ROE |
Stock Return |
|
1 |
PT. Astra Agro Lestari Tbk. |
AALI |
0.21978 |
30.926 |
0.013 |
0.3362 |
|
2 |
PT. Ace Hardware Indonesia Tbk. |
ACES |
0.373626 |
31.712 |
0.209 |
0.3561 |
|
3 |
PT. Adhi Karya (Persero) Tbk. |
ADHI |
0.087912 |
31.229 |
0.097 |
0.1369 |
|
4 |
PT. Adaro Energy Tbk. |
ADRO |
0.21978 |
31.910 |
0.097 |
0.0803 |
|
5 |
PT. AKR Corporindo Tbk. |
AKRA |
0.164835 |
30.695 |
0.065 |
0.0327 |
|
6 |
PT. Aneka Tambang Tbk. |
ANTM |
0.197802 |
31.039 |
0.011 |
0.0558 |
|
7 |
PT. Agung Podomoro Land Tbk. |
APLN |
0.164835 |
31.014 |
0.009 |
0.0718 |
|
8 |
PT. Astra International Tbk. |
ASII |
0.153846 |
24.284 |
0.014 |
0.1111 |
|
9 |
PT. Adi Sarana Armada Tbk. |
ASSA |
0.175824 |
31.512 |
0.065 |
0.0129 |
|
10 |
PT. Bank Central Asia Tbk. |
BBCA |
0.142857 |
32.152 |
0.018 |
-0.0613 |
|
11 |
PT. Bank KB Bukopin Tbk. |
BBKP |
0.186813 |
31.987 |
0.043 |
0.4514 |
|
12 |
PT. Bank Negara Indonesia (Persero) Tbk. |
BBNI |
0.186813 |
32.068 |
0.015 |
-0.0188 |
|
13 |
PT. Bank Rakyat Indonesia (Persero). Tbk. |
BBRI |
0.164835 |
30.282 |
0.019 |
0.6148 |
|
14 |
PT. Bank Tabungan Negara (Persero) Tbk. |
BBTN |
0.208791 |
31.071 |
0.023 |
0.0556 |
|
15 |
PT. Bank Danamon Indonesia Tbk. |
BDMN |
0.153846 |
30.594 |
0.093 |
0.0974 |
|
16 |
PT. Bekasi Fajar Industrial Estate Tbk. |
BEST |
0.230769 |
31.790 |
0.085 |
0.2026 |
|
17 |
PT. Bank Pembangunan Daerah Jawa Barat dan Banten Tbk. |
BJBR |
0.10989 |
30.145 |
0.013 |
-0.09 |
|
18 |
PT. Bank Pembangunan Daerah Jawa Timur Tbk. |
BJTM |
0.208791 |
31.971 |
0.015 |
0.4 |
|
19 |
PT. Bank Mandiri (Persero) Tbk. |
BMRI |
0.373626 |
30.210 |
0.014 |
0.1914 |
|
20 |
PT. Global Mediacom Tbk. |
BMTR |
0.087912 |
31.037 |
0.013 |
0.0833 |
|
21 |
PT. Bank Permata Tbk. |
BNLI |
0.21978 |
30.413 |
0.006 |
0.174 |
|
22 |
PT. Bank Syariah Indonesia Tbk. |
BRIS |
0.164835 |
31.395 |
0.013 |
0.1563 |
|
23 |
PT. Barito Pacific Tbk. |
BRPT |
0.197802 |
31.905 |
0.050 |
-0.1897 |
|
24 |
PT. Bumi Serpong Damai Tbk. |
BSDE |
0.153846 |
31.276 |
0.083 |
0.1787 |
|
25 |
PT. Bank BTPN Syariah Tbk. |
BTPS |
0.153846 |
30.364 |
0.026 |
0.0852 |
|
26 |
PT. Buana Lintas Lautan Tbk. |
BULL |
0.153846 |
31.640 |
0.013 |
-0.2667 |
|
27 |
PT. Sariguna Primatirta Tbk. |
CLEO |
0.142857 |
30.153 |
0.017 |
0.2128 |
|
28 |
PT. Charoen Pokphand Indonesia Tbk. |
CPIN |
0.186813 |
30.187 |
0.017 |
0.4783 |
|
29 |
PT. Ciputra Development Tbk. |
CTRA |
0.186813 |
31.220 |
0.073 |
0.0907 |
|
30 |
PT. Puradelta Lestari Tbk. |
DMAS |
0.164835 |
31.945 |
0.093 |
0.0763 |
|
31 |
PT. Elektronika Nusantara (Elnusa) Tbk. |
ELSA |
0.197802 |
29.549 |
0.097 |
0.1515 |
|
32 |
PT. Erajaya Swasembada Tbk. |
ERAA |
0.153846 |
29.908 |
0.065 |
0.4983 |
|
33 |
PT. XL Axiata Tbk. |
EXCL |
0.186813 |
29.467 |
0.038 |
0.2416 |
|
34 |
PT. Gudang Garam Tbk. |
GGRM |
0.131868 |
29.693 |
0.021 |
0.1264 |
|
35 |
PT. Garuda Indonesia Tbk. |
GIAA |
0.175824 |
31.428 |
0.013 |
0.1059 |
|
36 |
PT. HK Metals Utama Tbk. |
HKMU |
0.340659 |
28.256 |
0.052 |
-0.1075 |
|
37 |
PT. HM Sampoerna Tbk. |
HMSP |
0.087912 |
33.864 |
0.038 |
0.2186 |
|
38 |
PT. Buyung Poetra Sembada Tbk. |
HOKI |
0.21978 |
29.770 |
0.016 |
0.1733 |
|
39 |
PT. Indofood CBP Sukses Makmur Tbk. |
ICBP |
0.164835 |
31.287 |
0.022 |
0.038 |
|
40 |
PT. Indofarma Tbk. |
INAF |
0.197802 |
27.956 |
0.016 |
0.0871 |
|
41 |
PT. Vale Indonesia Tbk. |
INCO |
0.153846 |
23.825 |
0.030 |
-0.0455 |
|
42 |
PT. Indofood Sukses Makmur Tbk. |
INDF |
0.153846 |
32.197 |
0.011 |
0.2278 |
|
43 |
PT. Indika Energy Tbk. |
INDY |
0.153846 |
31.219 |
0.048 |
-0.2651 |
|
44 |
PT. Indah Kiat Pulp & Paper Tbk. |
INKP |
0.142857 |
27.469 |
0.068 |
0.1068 |
|
45 |
PT. Indocement Tunggal Prakarsa Tbk. |
INTP |
0.186813 |
26.348 |
0.082 |
0.2078 |
|
46 |
PT. Indosat Tbk. |
ISAT |
0.175824 |
24.863 |
0.012 |
0.3309 |
|
47 |
PT. Indo Tambangraya Megah Tbk. |
ITMG |
0.153846 |
23.216 |
0.015 |
0.0859 |
|
48 |
PT. JAPFA Comfeed Indonesia Tbk. |
JPFA |
0.208791 |
26.252 |
0.016 |
0.3288 |
|
49 |
PT. Jaya Real Property Tbk. |
JRPT |
0.131868 |
30.044 |
0.014 |
0.308 |
|
50 |
PT. Jasa Marga (Persero) Tbk. |
JSMR |
0.164835 |
25.325 |
0.086 |
-0.92 |
|
51 |
PT. Kimia Farma Tbk. |
KAEF |
0.21978 |
23.633 |
0.064 |
0.3362 |
|
52 |
PT. KMI Wire and Cable Tbk. |
KBLI |
0.373626 |
28.900 |
0.016 |
0.3561 |
|
53 |
PT. Kino Indonesia Tbk. |
KINO |
0.087912 |
29.178 |
0.020 |
0.1369 |
|
54 |
PT. Kalbe Farma Tbk. |
KLBF |
0.21978 |
30.640 |
0.015 |
0.0803 |
|
55 |
PT. Link Net Tbk. |
LINK |
0.164835 |
24.921 |
0.013 |
0.0327 |
|
56 |
PT. Lippo Karawaci Tbk. |
LPKR |
0.197802 |
27.035 |
0.066 |
0.0558 |
|
57 |
PT. Matahari Department Store Tbk. |
LPPF |
0.164835 |
24.601 |
0.080 |
0.0718 |
|
58 |
PT. PP London Sumatra Indonesia Tbk. |
LSIP |
0.153846 |
25.351 |
0.030 |
0.1111 |
|
59 |
PT. Malindo Feedmill Tbk. |
MAIN |
0.175824 |
26.865 |
0.087 |
0.0129 |
|
60 |
PT. Mitra Adiperkasa Tbk. |
MAPI |
0.142857 |
25.660 |
0.016 |
-0.0613 |
|
61 |
PT. Merdeka Copper Gold Tbk. |
MDKA |
0.186813 |
27.581 |
0.012 |
0.4514 |
|
62 |
PT. Medco Energi Internasional Tbk. |
MEDC |
0.186813 |
29.424 |
0.019 |
-0.0188 |
|
63 |
PT. Mitra Keluarga Karyasehat Tbk. |
MIKA |
0.164835 |
29.350 |
0.017 |
0.6148 |
|
64 |
PT. Media Nusantara Citra Tbk. |
MNCN |
0.208791 |
31.037 |
0.013 |
0.0556 |
|
65 |
PT. Metrodata Electronics Tbk. |
MTDL |
0.153846 |
31.661 |
0.018 |
0.0974 |
|
66 |
PT. Mayora Indah Tbk. |
MYOR |
0.230769 |
30.577 |
0.021 |
0.2026 |
|
67 |
PT. Perusahaan Gas Negara Tbk. |
PGAS |
0.10989 |
27.326 |
0.035 |
-0.09 |
|
68 |
PT. Bank Pan Indonesia Tbk. |
PNBN |
0.208791 |
26.076 |
0.008 |
0.4 |
|
69 |
PT. Panin Financial Tbk. |
PNLF |
0.373626 |
23.902 |
0.084 |
0.1914 |
|
70 |
PT. J Resources Asia Pasifik Tbk. |
PSAB |
0.087912 |
27.622 |
0.005 |
0.0833 |
|
71 |
PT. Bukit Asam Tbk. |
PTBA |
0.21978 |
26.288 |
0.021 |
0.174 |
|
72 |
PT. Pembangunan Perumahan (Persero) Tbk. |
PTPP |
0.164835 |
31.711 |
0.072 |
0.1563 |
|
73 |
PT. Pakuwon Jati Tbk. |
PWON |
0.197802 |
23.985 |
0.018 |
-0.1897 |
|
74 |
PT. Ramayana Lestari Sentosa Tbk. |
RALS |
0.153846 |
24.757 |
0.015 |
0.1787 |
|
75 |
PT. Surya Citra Media Tbk. |
SCMA |
0.153846 |
24.930 |
0.019 |
0.0852 |
|
76 |
PT. Industri Jamu dan Farmasi Sido Muncul Tbk. |
SIDO |
0.153846 |
24.289 |
0.026 |
-0.2667 |
|
77 |
PT. Siloam International Hospitals Tbk. |
SILO |
0.142857 |
25.072 |
0.057 |
0.4783 |
|
78 |
PT. Salim Ivomas Pratama Tbk. |
SIMP |
0.186813 |
24.276 |
0.031 |
0.4783 |
|
79 |
PT. Semen Baturaja (Persero) Tbk. |
SMBR |
0.186813 |
24.743 |
0.086 |
0.0907 |
|
80 |
PT. Semen Gresik Tbk. |
SMGR |
0.164835 |
27.405 |
0.067 |
0.0763 |
|
81 |
PT. Summarecon Agung Tbk. |
SMRA |
0.197802 |
28.525 |
0.065 |
0.1515 |
|
82 |
PT. Selamat Sempurna Tbk. |
SMSM |
0.153846 |
28.765 |
0.025 |
0.4983 |
|
83 |
PT. Surya Pertiwi Tbk. |
SPTO |
0.186813 |
28.708 |
0.013 |
0.2416 |
|
84 |
PT. Sri Rejeki Isman Tbk. |
SRIL |
0.131868 |
30.378 |
0.014 |
0.1264 |
|
85 |
PT. Surya Semesta Internusa Tbk. |
SSIA |
0.175824 |
29.722 |
0.020 |
0.1059 |
|
86 |
PT. Sawit Sumbermas Sarana Tbk. |
SSMS |
0.340659 |
30.103 |
0.063 |
-0.1075 |
|
87 |
PT. Tower Bersama Infrastructure Tbk. |
TBIG |
0.087912 |
31.061 |
0.016 |
0.2186 |
|
88 |
PT. Timah Tbk. |
TINS |
0.21978 |
30.645 |
0.013 |
0.1733 |
|
89 |
PT. Pabrik Kertas Tjiwi Kimia Tbk. |
TKIM |
0.164835 |
31.053 |
0.012 |
0.038 |
|
90 |
PT. Telkom Indonesia (Persero) Tbk. |
TLKM |
0.197802 |
33.030 |
0.217 |
0.0871 |
|
91 |
PT. Sarana Menara Nusantara Tbk. |
TOWR |
0.153846 |
30.951 |
0.026 |
-0.0455 |
|
92 |
PT. Chandra Asri Petrochemical Tbk. |
TPIA |
0.153846 |
31.172 |
0.014 |
0.2278 |
|
93 |
PT. United Tractors Tbk. |
UNTR |
0.153846 |
30.044 |
0.014 |
-0.2651 |
|
94 |
PT. Unilever Indonesia Tbk. |
UNVR |
0.142857 |
32.961 |
0.134 |
0.1068 |
|
95 |
PT. Wijaya Karya Bangunan Gedung Tbk. |
WEGE |
0.186813 |
31.758 |
0.185 |
0.2078 |
|
96 |
PT. Wijaya Karya (Persero) Tbk. |
WIKA |
0.175824 |
31.760 |
0.013 |
0.3309 |
|
97 |
PT. Integra Indocabinet Tbk. |
WOOD |
0.153846 |
30.928 |
0.081 |
0.0859 |
|
98 |
PT. Waskita Beton Precast Tbk. |
WSBP |
0.208791 |
30.354 |
0.140 |
0.3288 |
|
99 |
PT. Waskita Karya (Persero) Tbk. |
WSKT |
0.131868 |
30.137 |
0.033 |
0.308 |
|
100 |
PT. Wijaya Karya Beton Tbk. |
WTON |
0.164835 |
29.967 |
0.015 |
0.2615 |
Appendix C
[1] Huang, Y., Yang, S., Zhu, Q. (2021). Brand equity and the COVID-19 stock market crash: evidence from U.S. listed firms. Finance Research Letters, 43: 101941. https://doi.org/10.1016/j.frl.2021.101941
[2] Fathony, M., Khaq, A., Endri, E. (2020). The Effect of Corporate Social Responsibility and Financial Performance on Stock Returns. International Journal of Innovation, Creativity and Change, 13(1): 240-252. https://www.ijicc.net/images/vol_13/13120_Fathony_2020_E_R.pdf.
[3] Kristi, N.M., Yanto, H. (2020). The effect of financial and non-financial factors on firm value. Accounting Analysis Journal, 9(2): 131-137. https://doi.org/10.15294/aaj.v9i2.37518
[4] Hassouna, D., Salem, R. (2021). Corporate social responsibility and firm risk: Egypt’s case. Journal of Governance and Regulation, 10(2): 74-83. https://doi.org/10.22495/jgrv10i2art7
[5] Li, Z., Wei, S.Y., Chunyan, L., Aldoseri, M.M.N., Qadus, A., Hishan, S.S. (2021). The impact of CSR and green investment on stock return of chinese export industry. Economic Research-Ekonomska Istrazivanja, 35(1): 4971-4987. https://doi.org/10.1080/1331677X.2021.2019599
[6] Rulyanti Susi Wardhani, M.A.R. (2020). Financial performance and corporate social responsibility on return of shares. Jurnal Akuntansi, 23(3): 409-432. https://doi.org/10.24912/ja.v23i3.611
[7] Humaira, Z.A. (2021). Analysis of the influence of return on equity on sharia stock price moderated by corporate social responsibility. EKONOMIKA SYARIAH : Journal of Economic Studies, 5(1): 72-82. https://doi.org/10.30983/es.v5i1.2578
[8] Anggraini, D.R., Dura, J. (2021). The effect of tax aggressiveness, firm size, and profitability on corporate social responsibility disclosure in mining companies. International Journal of Educational Research and Social Sciences (IJERSC), 2(6): 1337-1347. https://doi.org/10.51601/ijersc.v2i6.232
[9] Oware, K.M., Mallikarjunappa, T. (2022). CSR expenditure, mandatory CSR reporting and financial performance of listed firms in India: An institutional theory perspective. Meditari Accountancy Research, 30(1): 1-21. https://doi.org/10.1108/MEDAR-05-2020-0896
[10] Shirasu, Y., Kawakita, H. (2021). Long-term financial performance of corporate social responsibility. Global Finance Journal, 50: 100532. https://doi.org/10.1016/j.gfj.2020.100532
[11] Mohammadi, S., Saeidi, H. (2022). Corporate social responsibility and financial accounting concepts: Evidence from an emerging market. Sustainability Accounting, Management and Policy Journal, 13(3): 740-764. https://doi.org/10.1108/SAMPJ-10-2019-0364
[12] Harjoto, M., Jo, H., Kim, Y. (2017). Is institutional ownership related to corporate social responsibility? The nonlinear relation and its implication for stock return volatility. Journal of Business Ethics, 146: 77-109. https://doi.org/10.1007/s10551-015-2883-y
[13] Ender, M., Brinckmann, F. (2019). Impact of CSR-relevant news on stock prices of companies listed in the austrian traded index (ATX). International Journal of Financial Studies, 7(3): 36. https://doi.org/10.3390/ijfs7030036
[14] Mutuc, E.B., Lee, J.S. (2019). Corporate social responsibility and market-adjusted stock returns: An Asian perspective. Asia-Pacific Social Science Review, 19(3): 88-107.
[15] Kamaliah. (2020). Disclosure of corporate social responsibility (CSR) and its implications on company value as a result of the impact of corporate governance and profitability. International Journal of Law and Management, 62(4): 339-354. https://doi.org/10.1108/IJLMA-08-2017-0197
[16] Javeed, S.A., Lefen, L. (2019). An analysis of corporate social responsibility and firm performance with moderating effects of CEO power and ownership structure: A case study of the manufacturing sector of Pakistan. Sustainability, 11(1): 248. https://doi.org/10.3390/su11010248
[17] Wei, A.P., Peng, C.L., Huang, H.C., Yeh, S.P. (2020). Effects of corporate Social Responsibility on firm performance: Does customer satisfaction matter? Sustainability, 12(18): 7545. https://doi.org/10.3390/su12187545
[18] Dornean, A., Oanea, D.C. (2017). CSR and company’s stock price. A comparative evidence from bucharest stock exchange. EuroEconomica, 26(1). http://journals.univ-danubius.ro/index.php/euroeconomica/article/view/4143/4057, accessed on Jan. 17, 2023.
[19] Hashemijoo, M., Mahdavi Ardekani, A., Younesi, N. (2012). The impact of dividend policy on share price volatility in the malaysian stock market. Journal of Business Studies Quarterly, 4(38): 111-129. http://ezproxy.lib.monash.edu.au/login?url=http://search.ebscohost.com/login.aspx?direct=true&db=bth&AN=91711854&site=ehost-live&scope=site, accessed on Dec. 17, 2022.
[20] Khan, N., Malik, Q.A., Saghir, A. (2020). Corporate social responsibility and firm performance: Evidence from Pakistan. International Review of Management and Business Research, 9(4): 381-389. https://doi.org/10.30543/9-4(2020)-32
[21] Kumar, R. (2019). Research Methodology: A Step-By-Step Guide For Beginners (5th Editio). Singapore: Sage Publications Ltd.
[22] Singh, Y.K. (2006). Fundamental of Research Methodology and Statistics. New Delhi: New Age International (P), Ltd.
[23] Mai, M.U. (2017). Mediation of CSR and profitability on the influences of GCG mechanisms to the firm value. Jurnal Keuangan Dan Perbankan, 21(2): 253-264. https://doi.org/10.26905/jkdp.v21i2.393
[24] Auliya, N., Abdullah, M.W., Suhartono. (2020). Green accounting : Refleksi hak asasi manusia dalam upaya pencegahan limbah. Islamic Accounting and Finance Review, 1(2): 97-110. http://dx.doi.org/10.24252/isafir.v1i2.17800
[25] Bae, J., Choi, W., Lim, J. (2020). Corporate social responsibility: An umbrella or a puddle on a rainy day? Evidence surrounding corporate financial misconduct. European Financial Management, 26(1): 77-117. https://doi.org/10.1111/eufm.12235
[26] Johnson, R.A., Dean, W.W. (1982). Applied Multivariate Statistical Analysis. New Jersey: Prentice Hall.
[27] Sharma, S. (1996). Applied Multivariate Techniques. New York: John Willey & Sons, Inc.
[28] Yang, K., Jayant, T. (2003). Multivariate Statistical Method in Quality Management. Amerika: McGraw-Hill.
[29] Saragih, F.D., Nugroho, B.Y., Eko, U. (2012). Corporate governance characteristics and company performance. Journal of Administrative Science & Organization, 19(1): 45-54. https://scholarhub.ui.ac.id/jbb/vol19/iss1/6, accessed on Jan. 17, 2015.
[30] Thottoli, M.M., Thomas, K.V. (2021). The impact of Web marketing on corporate social responsibility (CSR) and firms’ performance. Rajagiri Management Journal. https://doi.org/10.1108/RAMJ-03-2021-0022
[31] UTZ, S. (2018). Over-investment or risk mitigation? corporate social responsibility in Asia-Pacific, Europe, Japan, and the United States. Review of Financial Economics, 36(2): 167-193. https://doi.org/10.1016/j.rfe.2017.10.001
[32] Zolotoy, L., O’Sullivan, D., Chen, Y. (2019). Local religious norms, corporate social responsibility, and firm value. Journal of Banking & Finance, 100: 218-233. https://doi.org/10.1016/j.jbankfin.2019.01.015
[33] Landi, G., Sciarelli, M. (2019). Towards a more ethical market: the impact of ESG rating on corporate financial performance. Social Responsibility Journal, 15(1): 11-27. https://doi.org/10.1108/SRJ-11-2017-0254
[34] Suryani, A., Sari, A.P., Atikah. (2019). DisCLOSURE OF SOCIAL RESPONSIBILITY, PROfiTABILITY TO IMPROVE THE COMPANY VALUe. KnE Social Sciences, 3(26): 1008-1016. https://doi.org/10.18502/kss.v3i26.5427
[35] Devie, D., Liman, L.P., Tarigan, J., Jie, F. (2020). Corporate social responsibility, financial performance and risk in Indonesian natural resources industry. Social Responsibility Journal, 16(1): 73-90. https://doi.org/10.1108/SRJ-06-2018-0155
[36] Nurfadila, N. (2020). Does CSRD and GCG moderate the effect of financial performance on stock return? ATESTASI: Jurnal Ilmiah Akuntansi, 3(2): 133-141. https://doi.org/10.33096/atestasi.v3i2.570
[37] Oware, K.M., Mallikarjunappa, T. (2021). Financial performance and gender diversity: The moderating and mediating effect of CSR disclosure and expenditure of listed firms in India. Vision. https://doi.org/10.1177/09722629211001985
[38] Mahmood, F., Qadeer, F., Sattar, U., Ariza-Montes, A., Saleem, M., Aman, J. (2020). Corporate social responsibility and firms’ financial performance: A new insight. Sustainability, 12(10): 4211. https://doi.org/10.3390/su12104211
[39] Nurdiono, N., Warganegara, D.S., Aripin, A., Zahron, A., Mirfazli, E., Jose, L.S., Georgieva, D.V. (2019). CSR disclosure impact on corporate market performance of indonesia listed companies (IDX) in trade sectors. Academy of Accounting and Financial Studies Journal, 23(1): 1-9.
[40] Oware, K.M., Mallikarjunappa, T. (2019). Corporate social responsibility investment, third-party assurance and firm performance in India. South Asian Journal of Business Studies, 8(3): 303-324. https://doi.org/10.1108/SAJBS-08-2018-0091
[41] Ge, Q., Li, T. (2022). Corporate social responsibility and shareholder wealth: New insights from information spillovers. Financial Review, 57(1): 179-203. https://doi.org/10.1111/fire.12281
[42] Guping, C., Sial, M.S., Wan, P., Badulescu, A., Badulescu, D., Brugni, T.V. (2020). Do board gender diversity and non-executive directors affect CSR reporting? Insight from agency theory perspective. Sustainability, 12(20): 8597. https://doi.org/10.3390/su12208597