Rochmat Martanto*![]() | Sri Ngabekti
| Sri Ngabekti![]() | Juhadi
| Juhadi![]() | Nur Hamid
| Nur Hamid![]() | Hanifah Mahat
| Hanifah Mahat![]() | Nayan Natsir | Elvara Norma Aroyandini
| Nayan Natsir | Elvara Norma Aroyandini![]()
© 2023 IIETA. This article is published by IIETA and is licensed under the CC BY 4.0 license (http://creativecommons.org/licenses/by/4.0/).
OPEN ACCESS
Bantul Regency was originally a food-rich area with a rice surplus. However, in the last decade, land conversion has been converted to non-agricultural land, significantly reducing rice production and disrupting food security. Based on this background, this study was conducted to analyze processes, patterns, and spatial trends of land use conversion and their effects on food security conditions, both of which are the basis for recommending sustainable land use directions in Bantul Regency. The study was conducted using a mixed approach with the research population of all sub-districts in Bantul Regency, and the survey method was used to validate land conversion data. The variables in this study consist of (1) land conversion, including processes, patterns, and spatial trends, and (2) food security. Data collection techniques used are observation, interviews, and field checks. Land conversion analysis uses the Average Nearest Neighbor (ANN=z-score), with data on the distribution of conversions from agricultural to non-agricultural land use made from LANDSAT Satellite Imagery data. The research results on the nearest neighbor distribution index from the ANN analysis show that the pattern of land use conversion at the district level is clustered. In contrast, they are clustered, random, and dispersed at the sub-district level. While at the sub-district level, the food security level is a high surplus in six sub-districts, a low surplus in eight sub-districts, and minus in three sub-districts. Directions for sustainable land use are as follows: areas that can be converted for development are three sub-districts; as a granary area are two sub-districts; and as a buffer zone are six sub-districts. Land conversion not only affects the existence of productive land, but also affects various other factors such as economic, social, and environmental factors which in turn have an impact on decreasing food production and income per capita of farming families. Buffer areas should be converted with such strict provisions that sustainable food security can be realized.
food security, land conversion, sustainability
The very high population development in urban and suburban areas encourages the phenomenon of urban sprawl. This phenomenon has resulted in land clearing for houses, hotels, malls, and other non-agricultural purposes [1, 2]. Urban sprawl is a phenomenon that can be controlled because humans are the key instrument in regulating ecosystems and land use. At the same time, the land is also the main factor in regional development. Humans can choose to develop components that are considered to support land development and eliminate components that are considered useless. However, this phenomenon is increasing significantly in reality, mainly to manipulate the conditions and ecological processes in several areas [3, 4].
Indonesia is an agricultural country where most people's economic life is based on the land sector. On the other hand, high population growth, followed by economic activity and increasing food demand, will complicate the road to national food security. In addition, there are still many areas that have not been able to provide local food or have not been able to meet local food. It is caused by several factors, such as land use conversion, population density, and land productivity [5, 6].
Human activities are closely related to land [7]. Humans need land for various purposes, such as for shelter by making settlements; to meet food needs through agriculture, fisheries, and animal husbandry; as well as to meet various needs such as clothing, transportation equipment, to various household needs through the industry [8, 9]. The human need for land to meet their needs significantly impacts agricultural land. For example, agricultural land in Bantul Regency must be converted to meet the needs and demands of the development. Agricultural land is the primary need to meet food needs, but land conversion is increasing.
Land conversion is indicated by the reduction of agricultural land from year to year. Based on data released by the Central Statistics Agency from 2015 to 2017, it is known that agricultural land used for rice fields in Bantul Regency has decreased by 41 hectares, and agricultural land that is not rice fields has decreased by 947 hectares. In contrast, non-agricultural land use increased by 503 hectares [10]. The data shows that non-agricultural land use in Bantul Regency has increased drastically, while agricultural use has fallen sharply. The total land area in Bantul Regency remains the same. It means that for new land uses that are not for agriculture, people end up using agricultural land.
Agricultural output from year to year also decreased. As shown in Table 1, it is known that the average field's total area that produces various agricultural products from year to year continuously decreases. When viewed from the agricultural products, only rice paddy experienced an increase, while all other products experienced a decrease. One of the reasons for the decline in agricultural output is the decrease in land used for agricultural functions, considering that these lands have been converted into non-agricultural land: the more conversions, the lower the food security [11, 12].
Table 1. The average of Bantul regency agricultural products
|
Agricultural Products |
Year (Hectares) |
||
|
2015 |
2016 |
2017 |
|
|
Rice Paddy |
1736,588 |
1761,353 |
1763,588 |
|
Rice Field |
7,059 |
3,824 |
2,647 |
|
Corn |
253,647 |
214,529 |
193,118 |
|
Cassava |
94,471 |
80,235 |
61,471 |
|
Sweet potato |
6,235 |
1,353 |
5,235 |
|
Peanuts |
199,412 |
147,118 |
129,294 |
|
Soya bean |
97,647 |
57,706 |
57,000 |
|
Total |
2395,059 |
2266,118 |
2212,353 |
(Processing data from Bantul Regency BPS, 2017)
Various things drive land conversion. First, some farmers choose to sell agricultural land for their daily needs because ownership of agricultural land cannot guarantee that farmers can support their families. At the same time, buyers tend to convert the land. Second, there is a "follow-up" conversion pattern, where if there is a land use conversion in a location, it will be followed by the next land. Third, there is an increase in population from year to year where the higher the population, the higher the need for land, food, and increased development for housing and industry.
Based on this background, this research was conducted to analyze spatial patterns and trends of agricultural land use conversion and their effect on the level of food security in the Bantul Regency. These two things then become the basis for determining the direction of land use in the Bantul Regency.
Land conversion is a common phenomenon in various regions, which occurs not only because of food needs but also because of the need for land for housing or non-agricultural uses [13-15]. For humans to carry out all of their tasks, they require land as a place to live on earth. For sustainable development, land is a biological (biotic) and physical (abiotic) necessity for human survival [16, 17]. Food and shelter demands compete with one another since the need for housing constantly compromises the sustainability of food production [18].
In order to feed Indonesia's 258.7 million inhabitants, agricultural land—particularly rice fields—is essential [19]. Around 3.4 million more people live in Indonesia yearly, impacting the number of paddy fields converted to non-agricultural land (around 96500 ha) each year [20]. Tremendous population pressure and increasing economic and industrial growth have led to uncontrolled land use competition in various sectors, including the agricultural sector [21, 22]. It emphasizes the need for rational and sustainable planning and management of land resources by their carrying capacity [23].
Agricultural land can provide many benefits, such as in terms of economic, social, and environmental. However, due to land conversion, agricultural land becomes increasingly narrow, affecting economic, social, and environmental aspects. If the conversion of agricultural land to non-agriculture continues and is uncontrolled, this will become a problem for farmers in the region and a national problem for the Indonesian nation. Conversion of agricultural land will be closely related to the welfare of farmers because the land is a source of livelihood for farmers [24]. Agricultural land resources, if utilized optimally, actually provide a very comprehensive socio-economy. However, the current globalization has brought about the effect of sector shifts, especially in rural areas, where people working in the agricultural sector initially switched to the non-agricultural sector. From these changes, some problems arise, namely the decline in rural workers working in the agricultural sector [25].
Conversely, when more and more agricultural land is converted, various development problems in the village, such as increasing unemployment, increasing school dropout rates, and failure of development in general, will emerge. Therefore, development must be carried out, but it does not necessarily sacrifice natural sustainability, whose impact will, in the end, make it difficult for humans. The safest effort that rural communities can make is by cultivating agriculture through land productivity that can, at the same time, maintain a sustainable environmental ecosystem [26-28].
In addition to rural areas, rapid development and the increasing population growth rate in cities also negatively impact land. Agricultural land in cities in Indonesia is dwindling, resulting in less and less agricultural yields. Meanwhile, the demand for food continues to increase due to the growing population. In the end, humans are the ones who suffer the most. If food availability decreases, food security will also decrease so that humans cannot meet their daily needs. It is not impossible if, in the future, food becomes a contested scarce ingredient [29, 30]. In addition to development, several other factors affecting food security decline are population density, land area, and accessibility.
Development is very dependent on agricultural land. Most developments require land conversion. Agricultural land that has been converted tends to experience a decline in productivity. Less productive land will make the product produced less than optimal, so the yield will also decrease. As a result, food security will also experience a decline. Development in Bantul Regency also shows a similar condition. For example, development in Bantul Regency, traversed by the Southern Cross Road, has expanded residential and tourism areas. The results of Sakarov & Kaharap's research [31] show that the development has a significant impact on land, both wet and dry agricultural land.
Food security is also influenced by land use conversion patterns [32]. Land use conversion with random and regular patterns tends to have little effect on food security. On the other hand, the clustered pattern tends to have a very significant impact on food security. Worse, land use conversions in Indonesia have mostly clustered, in which most land use conversions are contagious or follow-up. It means that if a land is converted, the surrounding land or other lands also tend to become the object of conversion. As mentioned by Irawan [11], the clustered pattern is the pattern that has the most influence on food security.
The amount of land available in both urban and rural locations is generally decreasing due to development. It causes issues with urban and rural land, such as rising land prices, an uncontrollable loss of food security, and conflicts of interest [32, 33]. A loss in food security results from the competition between the need for land for habitation and the need for land for industry and other economic activities, both of which are growing [33]. The conversion of agricultural land to non-agriculture severely impacts the ability of farm households to feed themselves [34].
Up-to-date land cover information is needed for policymakers or relevant stakeholders for sustainable land resource management. Remote sensing data is the latest efficient method to obtain land cover information. Remote sensing technology provides up-to-date, quality, efficient, and relatively inexpensive land cover data and comprehensive area coverage for an adequate inventory and monitoring of land cover changes [27]. The Food and Agriculture Organization (FAO) has adopted remote sensing technology in conducting Forest Resources Assessments since the 1990s [35, 36].
Monitoring changes in land cover can be done very effectively with remote sensing equipment [36, 37]. Using a specialized change detection method, remote sensing technology may detect changes by comparing multi-temporal images taken over time. Repeated data collection is necessary for this analysis of land cover change. In recent decades, the Enhanced Thematic Mapper/Thematic Mapper (ETM/TM), Satellite Probatoire d'Observatoire de la Terre (SPOT), radar, and Advanced Very High-Resolution Radiometer (AVHRR) have been the primary sources of data [37].
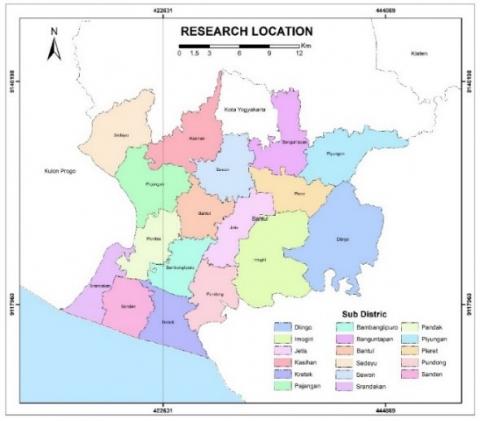
The administrative region of the Bantul regency serves as the study site. In terms of latitude and longitude, Bantul Regency is between 07000'28" and 07000'46" South and 110000'40 to 110000'70" East. As depicted in Figure 1, the administrative boundaries of the Bantul Regency include Sragen Regency in the north, Boyolali Regency, Surakarta City, and Sukoharjo Regency in the east, Wonogiri Regency in the south, and East Java Province in the west.
The population in this study is all sub-districts in Bantul Regency that have experienced a conversion of agricultural land use to non-agricultural for the period 2009 to 2019. The population and research samples were determined using LANDSAT 8 Satellite Imagery with a spatial resolution of 15 to 30 meters. A census data sampling was carried out so that all research populations were taken as samples. Analysis of the data uses analysis of land conversion patterns and analysis of food security.
Figure 1. Research location map
3.1 Analysis of land conversion patterns
By calculating the distance at each location of land use conversion using land-use conversion maps, it employs (1) interpretation of LANDSAT satellite imagery to determine the pattern of conversion of agricultural land use in Bantul Regency; and (2) analysis of average nearest neighbor (ANN). By looking at the value of the Average Nearest Neighbor, this analysis is used to assess if the distribution pattern of land use change follows a clustered, random, or dispersed pattern [38]. The analysis's findings provide a general idea of how land use conversion patterns are likely to affect ANN value. The formula used to create the ANN is as follows:
The following is the average nearest neighbor (ANN=z-score) ratio:
$A N N=\frac{D_0}{D_E}$ (1)
where, the observed mean distance between each feature and the nearest neighbor: $D 0=\frac{\sum_{i=1}^n d_i}{n}$.
Moreover, DE is the expected mean distance for the feature given a random pattern: $D_E=\frac{0,5}{\sqrt{n / A}}$.
In the previous equations, A represents the entire research area, n represents the total number of features, and di represents the distance between feature I and its nearest feature.
The following crucial steps must be taken into account when performing the nearest neighbor analysis:
(a) Establishing the parameters of the research field;
(b) converting the observed units' distribution pattern on the topographic map into a point distribution pattern;
(c) giving each point a unique serial number to aid in analysis;
(d) calculating the shortest distance between a point and the point that is nearest to it in a straight line;
(e) Using ArcGIS Software, the ANN (z-score) is interpreted as in Table 2 [38].
Table 2. Conversion spread grouping
|
No |
Pattern |
z-score |
|
1 |
Clustered |
<-1.65 |
|
2 |
Random |
-1.65≥ - <1.65 |
|
3 |
Dispersed |
≥1.65 |
3.2 Food security
Based on statistics from Bantul Regency for 2019, including the population of each subdistrict and the average paddy (rice) productivity per hectare per year, food security is calculated for 2020. In the meantime, information about agricultural land (rice fields) usage in 2019 is collected from LANDSAT satellite imagery. The availability of land, population, and land productivity for lowland rice are critical factors in food security because of population food intake [39]:
$P=\frac{\text { Lnd Production }\left(\frac{\mathrm{kg}}{\mathrm{yr}}\right)}{\text { The average consumption of rice per population }\left(\frac{\frac{\mathrm{kg}}{\mathrm{peple}}}{\mathrm{yr}}\right)}$
or $P=\frac{(L \times \operatorname{Pr} \times \operatorname{Pl} \times R)}{K}$ (2)
where, P=total population (people); L=land area (ha); Pr=land productivity (kg/ha); Pl=number of rice plantings in a year; R=rice yield (in 1/100); K=average consumption of rice per person in a year (kg/person/year).
The amount of food security for each subdistrict, including surplus areas and minus areas, will be determined using formula (2). The hostile areas are subdistricts that lack land suitable for agriculture, but it is also essential to consider their population density. The surplus region is split into two (two), high surplus and low surplus, according to the following formula:
$I=\frac{t \mathrm{maks}-t \min }{\mathrm{c}}$ (3)
where, I=class interval; tmax=maximum food security; tmin = minimum food security; c=total class=2 (high and low).
The sub-district level is the analytical unit for trends in land use conversion and food security. These are further divided into three categories: (1) agricultural land that can produce sustainable food, (2) buffer land, and (3) convertible land. As shown in Table 3, the grouping method involves superimposing a scoring mechanism (weighting) between the maps of the food security level and the land use conversion pattern.
Two maps are created, one for the food security level and the other for the land use conversion pattern for each variable in Table 3. It is possible to get the total score for each sub-district using the analysis in Table 3. The path of sustainable agricultural land use is based on the overall score. In order to obtain a grouping of sustainable land use directions in Bantul Regency [39], directions for sustainable food land are determined based on the outcomes of class interval calculations by formula (3), as shown in Table 4.
The underlying presumption is that areas or sub-districts with a dispersed conversion pattern and strong excess food security are designated sustainable food land and cannot be converted. Agricultural land that lacks food security and has a clustered conversion pattern is an area or sub-district that can be converted. Between the two is a buffer area or district that, depending on regional needs, may or may not be transferred from agricultural land use to non-agricultural use. Policymakers, therefore, play a crucial role in deciding whether or not the area is converted.
Table 3. Scoring and source of data
|
Variable |
Calculation assumptions |
Grouping of research results (attributes) |
Score |
Source of data |
|
Land use conversion pattern |
From the results of calculations with the help of LANDSAT Satellite Imagery and ArcGIS software |
Clustered |
1 |
LANSAT Satellite Image Overlay 2009 and 2019 |
|
Random |
5 |
|||
|
Dispersed |
9 |
|||
|
Food security level |
From the calculation using formula (2) and the level of food security in formula (3) |
Minus |
1 |
LANDSAT Satellite Image in 2019 and Bantul Regency in Figures for 2020 |
|
Low surplus |
5 |
|||
|
High surplus |
9 |
Note: Scoring with AHP from Saaty (1994).
Table 4. Grouping of sustainable land use directions in Bantul Regency
|
No. |
Sustainable food land directions |
Total score grouping |
|
1 |
Land for sustainable food security (must not be converted) |
≥( $t_{\min }$+2I) |
|
2 |
Buffer land (conditionally converted) |
≥( $t_{\min }$+I)-<( $t_{\min }$+2I) |
|
3 |
Convertible Land (Land for regional development) |
<( $t_{\min }$+I) |
4.1 Distribution pattern of land use conversion
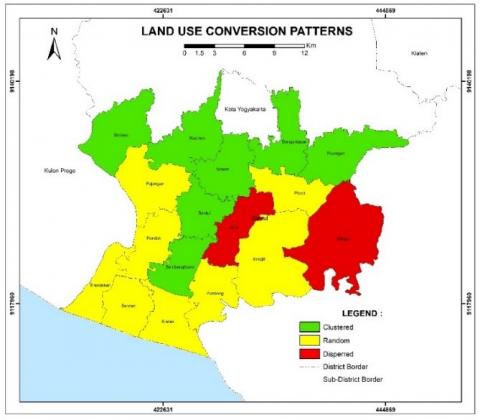
Figure 2 depicts a map of the land use conversion from agriculture to non-agriculture for each sub-district in Bantul Regency as a result of the analysis of data and information on land use conversion from each research unit using the 2009 and 2019 Land Use Maps (for ten years).
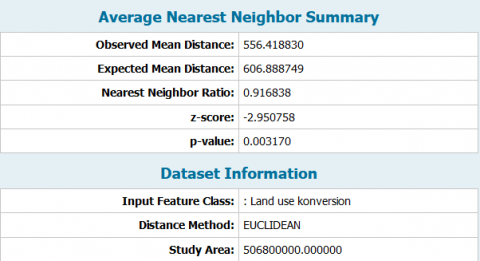
Figure 3 depicts the outcomes of ANN and the trend of land use conversion in Bantul Regency from agricultural to non-agriculture. According to Figure 3, Bantul Regency's ANN (z-score) = -2.553, or -165, indicating a clustered pattern of land use conversion. A sub-district-by-sub-district analysis is required to ascertain the direction of the level of food security in the Bantul Regency. Seventeen sub-districts make up Bantul Regency (Figure 1). Table 5 lists the sub-district level agricultural to non-agricultural land use conversion patterns from 2009 to 2019. Table 5 shows that land use conversion in Bantul Regency was 4041.00 ha or 404.10 ha/year for the ten years between 2010 and 2019. (Figure 2). Table 5 lists two subdistricts with clustered land use conversion patterns, eight subdistricts with random land use conversion patterns, and seven subdistricts with dispersed land use conversion patterns.
Figure 2. Map of land use conversion for 2009-2019 in Bantul regency
Figure 3. Conversion pattern and ANN for district level in Bantul
Because land use conversion tends to increase, clustered patterns must be considered [11]. The factors that need to be considered in the phenomenon of land conversion are urban growth factors, economic factors, social factors, technological factors, accessibility factors, risk and uncertainty, and land tenure. In addition, it is also necessary to pay attention to the influence of the development of standard of living demands, fluctuations in agricultural prices, the cost structure of agricultural production, technology, accessibility, risk and uncertainty in agriculture [24]. Dispersed patterns are generally safe for changing land usage [21]. Analyzing the Land Use Conversion Pattern Map is crucial for Sustainable Food Land Use Directions in Bantul Regency, as is determining the "degree of food security." for each sub-district displayed in the Food Security Level Map.
Table 5. Conversion area and ANN land use at sub-district level 2009 and 2019 in Bantul regency
|
No. |
District |
Conversion area |
ANN (z-score) |
|||
|
Ha/10 yr |
% |
z-score |
Pattern |
Score (Table 3) |
||
|
1 |
Srandakan |
30.313 |
0.75 |
-0.278 |
Random |
5 |
|
2 |
Sanden |
58.094 |
1.44 |
0.04 |
Random |
5 |
|
3 |
Kretek |
107.352 |
2.66 |
-1.044 |
Random |
5 |
|
4 |
Pundong |
202.726 |
5.02 |
-0.572 |
Random |
5 |
|
5 |
Bambanglipuro |
264.185 |
6.54 |
2.289 |
Dispersed |
9 |
|
6 |
Pandak |
157.185 |
3.89 |
0.771 |
Random |
5 |
|
7 |
Bantul |
287.574 |
7.12 |
3.392 |
Dispersed |
9 |
|
8 |
Jetis |
321.834 |
7.96 |
-2.137 |
Clustered |
1 |
|
9 |
Imogiri |
144.687 |
3.58 |
-0.388 |
Random |
5 |
|
10 |
Dlingo |
125.183 |
3.10 |
-1.785 |
Clustered |
1 |
|
11 |
Pleret |
231.439 |
5.73 |
-0.493 |
Random |
5 |
|
12 |
Piyungan |
377.161 |
9.33 |
1.806 |
Dispersed |
9 |
|
13 |
Banguntapan |
748.071 |
18.51 |
3.755 |
Dispersed |
9 |
|
14 |
Sewon |
507.884 |
12.57 |
3.094 |
Dispersed |
9 |
|
15 |
Kasihan |
274.718 |
6.80 |
3.038 |
Dispersed |
9 |
|
16 |
Pajangan |
53.193 |
1.32 |
-0.917 |
Random |
5 |
|
17 |
Sedayu |
149.401 |
3.70 |
1.92 |
Dispersed |
9 |
|
Total |
4041.000 |
100.00 |
||||
Source: Researcher’s analysis.
The pattern of land conversion in the study area occurs because of two opposing forces affecting the formation and change of land use [38, 40], namely, centrifugal force and centripetal force. Centrifugal force pushes activities to move from an area (city center) to the outskirts. Five forces work in this case: spatial, site, situational, social evolution, status, and social organization. The centripetal force works to hold certain functions in an area (city center) and attract other functions into it. This force occurs because of several attractive qualities of the area (city center), namely the physical footprint and functional comfort. In addition to these two forces, other factors are a human right to choose, namely the human equation factor. This factor can act as a centripetal or centrifugal force. For example, high taxes on land and buildings in the city center can make someone move from the city center to outside the city or suburbs (centrifugal force).
Factors of origin of migrants can provide incentives to leave or keep them from staying and not moving. Likewise, the destination factor of migrants can attract people to come or refuse or not be interested in coming. Infertile land and low income in the area of origin are the impetus for moving. However, an immediate sense of kinship and a compact social environment is a factor that keeps a person from moving. High wages and attractive job opportunities in migrant destination areas are factors to coming to a new place. Meanwhile, uncertainty, risks that may be faced, and uncertain land ownership are inhibiting factors for moving to their destination [41].
4.3 Food security level
Data on the population in 2019 and the average productivity in 2010 (the start of the conversion) through 2019 are used to calculate the food security of each sub-district in the research region (BPS Bantul Regency). Formula (2) is used for the calculation under the following restrictions:
(1) The total population of the Bantul Regency in 2019 (according to data from the Bantul Regency 2020 Central Bureau of Statistics (BPS)).………………................................. (P).
(2) The average amount of rice consumed annually is 97.6 kg [32]...........(K).
(3) Indonesia's dry milled grain yield is 64.02 percent [10]. (R).
(4) Paddy fields in Bantul Regency produced 6000 kg/ha on average in 2019. [42] (Pr) (Pr).
(5) Rice cropping pattern in Bantul Regency: twice a year ……………................ (Pl).
After using formula (3) and Table 3, the results are in Table 6.
Table 6. Food security at the sub-districts of Bantul regency
|
No. |
Sub-district |
Population yr 2019 (people) |
Agriculture yr 2019 (ha) |
Consumption ability (people) |
Food Security |
Conversion pattern score (Table 4) |
Total score |
Land use directions |
||
|
Rest (people) |
Level |
Score |
||||||||
|
1 |
2 |
3 |
4 |
5 |
6 |
7 |
8 |
9 |
10 |
11 |
|
1 |
Srandakan |
31218 |
476 |
112121 |
83117 |
LS |
5 |
9 |
14 |
LS |
|
2 |
Sanden |
31972 |
970.4 |
86292 |
49203 |
LS |
5 |
5 |
10 |
BL |
|
3 |
Kretek |
30863 |
914.1 |
164257 |
127906 |
HS |
9 |
9 |
18 |
LS |
|
4 |
Pundong |
35908 |
838.8 |
190724 |
147785 |
HS |
9 |
9 |
18 |
LS |
|
5 |
Bambanglipuro |
41880 |
1046.1 |
202835 |
161841 |
HS |
9 |
9 |
18 |
LS |
|
6 |
Pandak |
52013 |
868.5 |
24763 |
-20835 |
Minus |
1 |
1 |
2 |
CL |
|
7 |
Bantul |
64365 |
940 |
60277 |
27064 |
LS |
5 |
1 |
6 |
CL |
|
8 |
Jetis |
58549 |
1184.1 |
21921 |
-18488 |
Minus |
1 |
9 |
10 |
BL |
|
9 |
Imogiri |
63542 |
1429.7 |
149466 |
67837 |
LS |
5 |
5 |
10 |
BL |
|
10 |
Dlingo |
39537 |
730 |
138923 |
77462 |
LS |
5 |
9 |
14 |
LS |
|
11 |
Pleret |
48170 |
724 |
93590 |
8007 |
LS |
5 |
9 |
14 |
LS |
|
12 |
Piyungan |
52333 |
1084 |
49348 |
-32851 |
Minus |
1 |
9 |
10 |
BL |
|
13 |
Banguntapan |
111955 |
873.1 |
280937 |
199825 |
HS |
9 |
9 |
18 |
LS |
|
14 |
Sewon |
99807 |
1150 |
178310 |
114235 |
HS |
9 |
9 |
18 |
LS |
|
15 |
Kasihan |
103527 |
543.1 |
200110 |
136893 |
HS |
9 |
9 |
18 |
LS |
|
16 |
Pajangan |
36040 |
301.9 |
103737 |
68774 |
LS |
5 |
5 |
10 |
BL |
|
17 |
Sedayu |
47646 |
843.3 |
109984 |
83301 |
LS |
5 |
1 |
6 |
CL |
|
|
Jumlah |
949325 |
|
939795 |
|
|
|
|
|
|
Note:
HS: High surplus
LS: Low Surplus
LS: Land for sustainable food security
BL: Buffer land
CL: Convertible Land
4.4 Land use directions
Table 6's information on food security in the Bantul Regency reveals that places with low levels of food security are distributed throughout three subdistricts. In comparison, areas with low surpluses (LS) and high surpluses (HS) are located in six and eleven subdistricts, respectively. Subdistricts with a large surplus are anticipated to become Bantul Regency's rice barn. Nine hundred forty persons could consume rice in all the subdistricts in 2019, out of a total population of 886,519 (Table 6). Overall, Bantul Regency has a food (rice) surplus of (939,795 people - 886,519)=53,276 people, meaning that food security can be satisfied there.
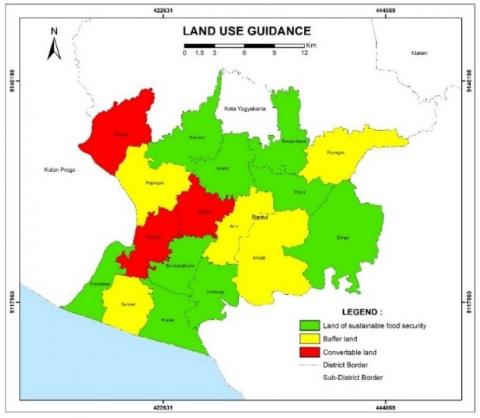
These areas will be more vulnerable to a deterioration in food security because of the clustered conversion pattern in multiple sub-districts. Information regarding Land Use Directions to Support Sustainable Food Security in Bantul Regency can be obtained via a GIS analysis (overlay) between the Land Use Conversion Pattern Map and the Food Security Level Map (Gardi et al., 2015; Jiang & Zhang, 2016). Overlay two maps, specifically the Food Security Level Map from Table 6 (column 7), Figure 5, and the Land Use Conversion Pattern Map (Figure 4). Figure 6 illustrates the Land Use Direction Maps that arise from the overlay of the two maps.
Based on the Map of Land Use Direction analysis, as shown in Figure 6, it is known that land for sustainable food security is located in eight sub-districts, land conversion patterns in three sub-districts, and buffer land patterns in the remaining six sub-districts. The buffer zone must be used to implement sustainable food security policies [13, 20]. The process and mechanism for permitting land use conversion by local government authorities should be well-considered. There is a need for consistency in the application and enforcement of the applicable rules. Conversion permission can be granted if it is a national strategic project. Other than it, should not be permitted the conversion of land use from agricultural land to non-agricultural land (Government Regulation Number 42 of 2021) [43, 44].
Figure 4. Map of land use conversion
Figure 5. Patterns of food security levels
Figure 6. Map of land use directions in Bantul Regency
5.1. Conclusion
(1) The process of land use change in Bantul Regency tends to be grouped into three sub-districts at the sub-district level, a random pattern of three sub-districts, and a scattered pattern of 11 sub-districts. Meanwhile, at the district level, the pattern of land use conversion tends to form a clustered pattern.
(2) Bantul Regency has 11 sub-districts with a high food surplus, six sub-districts with a low surplus, and three sub-districts with zero surpluses, but overall they are food storage areas.
(3) The direction of sustainable food land can be done by looking at the pattern of land conversion and food security at the sub-district level in Bantul Regency. The pattern includes land patterns for sustainable food security in eight sub-districts, land conversion patterns in three sub-districts, and buffer land patterns in the remaining six sub-districts.
(4) The impact of the loss of productive agricultural land is the permanent loss of agricultural products. If this condition is not controlled, it will affect the sustainability and increase in production, which will continue to decrease and ultimately threaten the instability of food security in Bantul Regency in particular and the Province of the Special Region of Yogyakarta.
(5) As a result of land conversion in the research area, the narrowing of agricultural land will affect the economic, social, and environmental aspects. If the conversion of agricultural land to non-agriculture continues to be carried out and is not controlled, this will become not only a problem for farmers in rural areas but also a national problem for Indonesia. The conversion of agricultural land can reduce production capacity and labor absorption, which in turn has an impact on decreasing food production and the per capita income of farming families. The conversion of agricultural land also accelerates the marginalization of farming, thereby reducing the competitiveness of domestic agricultural products.
5.2 Recommendation
(1) The tension between social goals and food demands arises from land use modification. In order to keep Bantul Regency functioning as a food barn, it is anticipated that the direction of sustainable food land will be adopted.
(2) Strict rules on buffer zones are required (and maybe conditionally converted) for Bantul Regency to achieve long-term food security.
[1] Giyarsih, S.R. (2010). Urban sprawl of the city of yogyakarta, special reference to the stageof spatial transformation (Case study at Maguwoharjo Village, Sleman District). Indonesian Journal of Geography, 42(1): 49-60. https://doi.org/10.22146/ijg.1576
[2] Juhadi, J., Tjahyono, H., Arifudin, R. (2014). Spatial analysis of land damage typology based on geographic information system. Jurnal Tata Loka, 16(4): 209-219. https://doi.org/10.14710/tataloka.16.4.209-219
[3] Juhadi, J., Banowati, E., Sanjoto, T.B., Nugraha, S.B. (2020). Rapid appraisal for agricultural land utilization in the erosion and landslide vulnerable mountainous areas of Kulonprogo Regency, Indonesia. Management of Environmental Quality: An International Journal, 31(1): 1-17. https://doi.org/10.1108/MEQ-01-2019-0023
[4] Juhadi, J., Sanjoto, T.B., Pratiwi, E.S., Trihatmoko, E., Istiqomah, I., Findayani, A. (2021). Rural–Urban transformation and landuse dynamics in gunungpati on the northern flank of Mt. Ungaran, Semarang, Indonesia. Indonesian Journal of Geography, 53(2): 170-178. https://doi.org/10.22146/ijg.52385
[5] Karjoko, L., Winarno, D.W., Rosidah, Z.N., Handayani, I. (2020). Spatial planning dysfunction in East Kalimantan to support green economy. International Journal of Innovation, Creativity and Change, 11(8): 259-269. https://www.ijicc.net/images/vol11iss8/11819_Karjoko_2020_E_R.pdf
[6] Aly, M.N., Hamid, N., Suharno, N.E., Kholis, N., Aroyandini, E.N. (2021). Community involvement and sustainable cave tourism development in Tulungagung Region. Journal of Environmental Management and Tourism, 12(2): 588–597. https://doi.org/10.14505//jemt.v12.2(50).28
[7] Hamid, N., Setyowati, D.L., Juhadi, Priyanto, A.S., Hardati, P., Soleh, M., Wijayanti, N.R., Aroyandini, E.N. (2021). The effect of human activities towards coastal dynamics and sustainable coastal management. International Journal of Sustainable Development and Planning, 16(8): 1479–1493. https://doi.org/10.18280/ijsdp.160809
[8] Ritohardoyo, S. (2009). Penggunaan dan Tata Guna Lahan (Land Use). Fakultas Geografi Universitas Gadjah Mada Yogyakarta. https://scholar.google.co.id/citations?view_op=view_citation&hl=id&user=X-BR4bsAAAAJ&citation_for_view=X-BR4bsAAAAJ:u5HHmVD_uO8C
[9] Juhadi. (2010). Spatial analysis of agricultural land typology based on geographic information systems (GIS) in Serang Watershed Upstream Kulonprogo, Yogyakarta. Jurnal Geografi, 7(1): 11-29. DOI: https://doi.org/10.15294/jg.v7i1
[10] Bantul Regency BPS. (2017). Harvested area of foodstuffs by district and area of land use by district. Bantul: Bantul Regency BPS.
[11] Irawan, B. (2005). Rice field conversion: Potential impact of utilization patterns and determinant factors. Jurnal Forum Penelitian Agro Ekonomi, 23(1). http://dx.doi.org/10.21082/fae.v23n1.2005.1-18
[12] Astuti, D.I. (2011). The correlation of land prices to agricultural land conversion rates in the upper ciliwung river. Bogor: Department of Resource and Environmental Economics, Faculty of Economics and Management. Institut Pertanian Bogor.
[13] Millar, J., Roots, J. (2012). Changes in Australian agriculture and land use: Implications for future food security. International Journal of Agricultural Sustainability, 10(1): 25–39. https://doi.org/10.1080/14735903.2012.646731
[14] Yasar, M., Siwar, C. (2016). Paddy field conversion in Malaysia: Issues and challenges. Rona Teknik Pertanian, 9(2): 168–177. https://doi.org/10.17969/rtp.v9i2.5653
[15] Satria, J., Falatehan, A.F., Beik, I.S. (2018). Strategy to protect agricultural land for sustainable food security in Bogor Regency. Jurnal Manajemen Pembangunan Daerah, 10(2). http://repository.ipb.ac.id/handle/123456789/95395
[16] Soemarwoto, O. (1995). Environmental ecology and development. Jakarta: Penerbit Djambatan Jakarta.
[17] Jauhari, A. Ritohardoyo, S. (2013). The impact of housing development on changes in land use and socio-economic conditions of land sellers in Mlati Sub-District. Jurnal Bumi Indonesia, 2(2): 192-201. http://etd.repository.ugm.ac.id/penelitian/detail/60084
[18] Jiang, L., Zhang, Y. (2016). Modeling urban expansion and agricultural land conversion in Henan Province, China: An integration of land use and socioeconomic data. Sustainability, 8(9): 920. https://doi.org/10.3390 /su8090920
[19] Bantul Regency BPS. (2020). Bantul Regency in Figures 2020. Bantul: Bantul Regency BPS.
[20] Mulyani, A., Nursyamsi, D., Syakir, M. (2017). Strategy for utilizing land resources to achieve sustainable rice self-sufficiency. Jurnal Sumberdaya Lahan, 11(1): 11-22. http://dx.doi.org/10.21082/jsdl.v11n1.2017.11-22
[21] Mahmood, Z., Iftikhar, S., Saboor, A., Khan, A.U., Khan, M. (2016). Agriculture land resources and food security nexus in Punjab, Pakistan: An eempirical ascertainment. Food and Agricultural Immunology, 27(1): 52–71. ttps://doi.org/10.1080/09540105.2015.1079593
[22] Prasada, I., Rosa, T. (2018). The impact of wetland conversion on food security in Daerah Istimewa Yogyakarta. Jurnal Sosial Ekonomi Pertanian, 14(3): 210-224. https://doi.org/10.20956/jsep.v14i3.4805
[23] Swaminathan, M.S., Bhavani, R.V. (2013). Food production & availability - Essential prerequisites for sustainable food security. Indian Journal of Medical Research, 138: 383–391. https://www.ncbi.nlm.nih.gov/pmc/articles/PMC3818607/
[24] Dwipradnyana, I.M.M., Windia, W., Sudarma, I.M. (2015). Factors affecting land conversion and its impact on farmer welfare: The case in Subak Jadi, Kediri District, Tabanan Regency. Jurnal Manajemen Agribisnis, 3(1). https://ojs.unud.ac.id/index.php/agribisnis/issue/view/1714
[25] Cahyani, D. (2020). Examining the spatial pattern in Indonesia's villages for the globalization mechanism of survival. Journal of Engineering Science and Technology 15: 30-38. https://jestec.taylors.edu.my/Special%20Issue%20ASSEEE2020/AASSEEEC2020_01.pdf
[26] Munasinghe, M. (1992). Environmental economics and valuation in development decision making environment. Working Paper No 51 World Bank.
[27] Jensen, J.R. (2007). Remote sensing of the environment. Second Edition Pearson Prentice Hall.
[28] Juhadi. (2007). Patterns of land use and environmental degradation in hilly areas. Jurnal Geografi, 1.
[29] Sihaloho, M., Dharmawan, A.H., Rusli, S. (2007). Agricultural Land Conversion and Changes in Agrarian Structure. Jurnal Transdisiplin Sosiologi, Komunikasi, dan Ekologi Manusia, 1(2).
[30] Jalzarika, A. (2008). The role of landsat satellite imagery for various geodesy and geomatics applications in Indonesia. Lembaga Penerbangan dan Antariksa Nasional (LAPAN) Jakarta.
[31] Sakarov, O.D., Kaharap, G. (2017). Identification of the development of coastal spatial patterns bantul regency passed by the southern cross road (JJLS). Prosiding Seminar Nasional XII “Rekayasa Teknologi Industri dan Informasi 2017”. Sekolah Tinggi Teknologi Nasional Yogyakarta. https://journal.itny.ac.id/index.php/ReTII/article/view/766
[32] Arifin, B., Achsani, N.A., Martianto, D., Sari, L.D., Firdaus, A.H. (2018). Modeling the future of indonesian food consumption: final report, research report submitted to the national development planning agency (Bappenas), world food programme (WFP), and food and agricultural organization of the united nations (FAO).
[33] Sari, D.K., Nugroho, Hendriawaty, H., dan Ginting, M. (2010). Urban land price modeling using geostatistical Method. Jurnal Rekayasa LPPM Itenas, 16(2). https://ejurnal.itenas.ac.id/index.php/rekayasa/article/view/54
[34] Nurpita, A., Wihastuti, L., Andjani, I.Y. (2018). Impact of land use change on food security of farmer households in Temon District, Kulon Progo Regency. Jurnal Gama Societa, 1(1): 103–110.
[35] FAO. (2007). Global Forest Resources Assessment 2010. Working Papers 141. Rome
[36] Danoedoro, P., Ananda, I.N., Kartika, C.S.D., Umela, A.F., Indayani, A.B. (2020). Testing detailed classification scheme for land-cover/land-use mapping typical Indonesian landscape: a case study of Sarolangun, Jambi and Salatiga, Central Java. Indonesian Journal of Geography, 52(3): 327-240. http://dx.dot.org/10..22146/ijg.50080
[37] Lu, D., Mausel, P., Brondizio, E., Moran, E. (2004). Change detection techniques. International Journal of Remote Sensing, 25(12): 2365-2401. https://doi.org/10.1080/0143116031000139863
[38] Novio, R., Mariya, S., Wijayanto, B. (2020). The spatial pattern analysis of settlements area in Batusangkar City Tanah Datar Regency. Jurnal Pendidikan Geografi, 25: 80-87. http://journal2.um.ac.id/index.php/jpg/article/view/12009
[39] Martanto, R., Ketut Rachmi Handayani, I. (2020). Classification of Sustainable Food Agricultural Land for Food Security in Bali, Indonesia. Talent Development & Excellence, 12(2). https://www.semanticscholar.org/paper/Classification-of-Sustainable-Food-Agricultural-for-Martanto-Handayani/c382f1c53611f486e19194c2153440c345371a88
[40] Nelson. (1986). Guideline for Rural Landuse Planning in Developing Countries. Rome.
[41] Martanto, R. (2019). Analysis of land use change patterns for rice self-sufficiency stability in Sukoharjo District. STPN Press: Yogyakarta.
[42] Bantul Regency BPS. (2019). Land area by utilization and agricultural machinery in bantul regency. Bantul: Bantul Regency BPS.
[43] Saaty, T.L. (1994). Fundamentals of decision making and priority theory with the analytic hierarchy process. Pittsburgh, USA: RWS Publications.
[44] Soerjani, M., Ahmad, R., Munir, R. (2001). Environment: Resources and population in development. Jakarta: Penerbit Universitas Indonesia.