Anis Ali*![]() | Basel J. A. Ali
| Basel J. A. Ali![]() | Nadeem Fatima
| Nadeem Fatima![]()
© 2023 IIETA. This article is published by IIETA and is licensed under the CC BY 4.0 license (http://creativecommons.org/licenses/by/4.0/).
OPEN ACCESS
The outbreak of COVID-19 affected all aspects of individuals at a worldwide level. It harmed the physically and economically of individuals, and lower the growth of economies, globally. India the third largest consumer of oil and gas was affected by the pandemic, negatively. The study is based on the data collected from the financial statements of Indian oil and gas companies available on the websites. The purpose of the study is to know the financial performance of the Indian oil and gas companies pre and post-COVID-19 pandemic period. The absolute and relational financial variables are applied to get the absolute trend and relational growth of the financial performance of Indian oil and gas companies in graphical form. To explore the profit-earning capacity, short-term paying ability, and long-term paying ability of the Indian oil and gas companies, profitability (profit before tax ratio) ratio, liquidity (current ratio) ratio, and solvency (Debt-Equity ratio) ratio were applied. From 2015 to 2021, the absolute values of revenues, total expenses, and profit before tax were applied to get the trend in graphical form while stacked column charts were prepared to compare the profitability, liquidity, and long-term paying ability of the Indian oil and gas companies. During the pandemic period, total revenues, total expenses, profits, and profitability declined while liquidity and solvency status was unaffected by COVID-19 in Indian oil and gas companies. The profitability of the smaller Indian oil and gas companies improved more than the larger Indian oil and gas companies after the COVID-19 pandemic. It is found that the large-scale production of Indian oil and gas companies was affected more than the smaller-scale production of Indian and gas companies by the negativity of the pandemic COVID-19 due to fixed expenses.
oil and gas companies, COVID-19, financial performance, profitability, liquidity, trend analysis
The pandemic COVID-19 affected businesses and industries negatively at the worldwide level. Due to the seizure of the borders during the pandemic, the import and export and internal environment of businesses affected to a larger extent [1]. The Indian oil and gas industry nurtures the business and industry, local and international transportation as well as fulfills the demand for the kitchen. The World health organization declared a public health emergency and outbreak of pandemic on 30 January and 11 March 2020, respectively. The COVID-19 pandemic changed the global economy drastically. Almost, all countries are affected by the corona directly and indirectly. Some of the major economies in the world are severely affected by the corona economically and physically. India is the fifth-largest economy with the second-largest population in the world. After the USA, India is the most affected country in the world by the COVID-19. The COVID-19 changed the sentiments of the world regarding growth and development. During the pandemic period, lifesaving was the priority in the production of goods or rendering services. This pandemic changes the shape of growth and development, globally. The outbreak of COVID-19 stopped production and manufacturing due to the scarcity of the workforce as well as the unavailability of essential inputs for production. COVID-19 governed negatively businesses and manufacturing industries in India. The oil and gas industry is one of the essential industries that play a vital role in personal life as well as in business context. India is the third largest consumer of oil in the world. Energy consumption in India has fallen due to the outbreak of the COVID-19 pandemic [2] and reduced the demand for oil and gas [3]. The profits and profitability of the firms depend on the demand and the sale prices of the products while the sale prices are also governed by demand and supply [4-6]. In COVID-19 pandemic period, supply of the oil and gas from overseas and domestic demand for oil and gas decreased. Conceptually, it should reduce revenue and profitability and negatively affects the other measures of the financial performance of the firms. The COVID-19 pandemic affected Indian oil and gas companies. The effects of external factors on financial performance are not equal for all companies in a particular industry [7, 8]. The study considers the growth of the total revenue, total expenses, profits, and related measures of the profitability, liquidity, and long-term paying ability of Indian oil and gas firms’ pre and posts COVID-19 pandemic period to measure the negativity of the pandemic on the financial performances. The primary goal of companies, which are a vital element of the economic system, is to maximize value [9, 10]. The financial success of enterprises is critical to accomplishing this goal [11]. Financial performance analysis is a useful criteria for firms to fulfill their objectives, adjust to changing market circumstances, enhance their company practices, and be prepared to respond to potential difficulties [5, 6, 12]. As a result, financial performance is becoming an increasingly crucial problem not just for enterprises but also for national economies [13]. Financial performance analysis is a critical instrument for assessing a company's commercial activities. This assessment is critical for many stakeholders, including company directors, management, vendors, lenders, employees, customers, rivals, shareholders, and the government [5, 10]. While analyzing their financial position, firms attempt to compute and analyze financial ratios using econometric and statistical analysis and information from financial statements such as the statement of income, financial statements, and statement of cash flows [4, 14].
At worldwide level, everyone was concerned with the gas and oil industry due to the large-extend demand and supply damage and the descendent movement of crude or raw oil prices. There is a powerful effect of COVID-19 on the price velocity of crude oil but not on natural gas. The demand of oil has decreased during the pandemic COVID-19 but the gas industry was not so much affected as the use of natural gas is mainly for household consumption (cooking and heating) is higher than the fuel. The main reason for the oil decline was not running the transportation activities due to the lockdown. On the other hand, the use of natural gas increased household use during the pandemic COVID-19 [15]. In the US, the increasing number of cases harmed the crude oil price while it positively affected the natural gas price. For Japan, only a short-run shock with a gap was apparent in the crude oil market and no evidence of that shock was visible in the natural gas market [16].
The gas and oil industry is mainly damaged more than any other energy sector during COVID-19. The pandemic harmed the prices, supply, demand, investment, and some other phases of the energy sector along with the oil and gas industry. The oil industry is losing investment rapidly and so many projects in the energy sector are closing due to lack of funding [17]. There is a major decrease in the performance of oil and gas, and coal companies before and during the pandemic. The pandemic has mainly affected oil and gas firms. This is strongly reasonable that the working capital needed to run an energy company is a massive amount. The firms having low funds, would not be able to achieve their expected performance [18].
There is a relationship between oil price returns and stock price returns during the COVID-19 period. During COVID-19, there was a positive correlation between oil price returns and stock price returns, which indicated that falling oil prices act as a negative signal for the stock market [19]. The rapid increase of COVID-19 cases harms financial and product markets as well as the economy. They revisit the relationship between the sources of oil price and stock returns during COVID-19. There is a big change in dynamics between different global oil market shocks and Indian stock returns [20].
The rising of COVID-19 has affected the whole Indian economy. The Indian oil corporation has been unfavorably influenced by the economy. Further, the presence of a leverage effect has been proved in the price volatility of crude oil in India. But, a few of the companies like Reliance and NTPC (non-technical popular categories) might not be affected much [21]. The net volatility spillovers of the COVID-19 remained positive in all primary energy sectors from January to June 2020 and February to April 2021. The effects of COVID-19 varied among different energy sub-sectors in different periods. The oil extraction sector, associated with the power and gas sectors, is affected more by the COVID-19 due to negative supply and demand surprises and the high uncertainty surprises in the oil, gas, and power sectors during the most severe stage of the pandemic [22].
China is one of the world’s largest oil consumers. COVID-19 has created serious challenges for the global economy. During COVID-19, the effects on oil prices has attracted wide attention, globally. The increase in the number of cases and deaths was the main factor in the oil price volatility and could decrease the oil demand and prices in China [23].
There are significant changes in the prices of the oil and gas industry during COVID-19. The oil industry was more affected due to the pandemic than the gas industry. India is another oil-consuming country, and along with India, many other countries have faced the problem of less oil demand due to COVID-19. During COVID-19, traveling bans and grounding of global flights contributed to a weighty decrease in the usage of aviation turbine fuel throughout the world [24].
There was enhancement in oil prices during COVID-19 pandemic. The fluctuation in the demand and supply due to the fall of oil prices during the COVID-19. Oil prices and rapid decline are not only due to COVID-19 but also due to the uneven environment caused by the pandemic affecting the world [25]. The sentiments of the investors’ have been affected due to COVID-19. The Behavioral Finance theory establishes the fact to lead negative impact of the pandemic on the stock prices of oil and gas firms. Market sentiments govern more than the fundamentals of the firms to stock returns during the start of the crisis but the market got its peak, it starts improving but how much time, the market takes to recover depends upon the severity of the crises [26].
Nigeria is highly weak to both external and internal oil price shocks on all facts of the economy specifically the gas and oil sector. By implication, the lower crude oil price impacts will remain within the industry well after coming back to the normal routine of the companies and common people [27]. COVID-19 has significantly and negatively affected the supply chains of industries including the gas and oil industry. COVID-19 pandemic has disturbed the supply chain significantly at the global level. The factors of flexibility in supply chains and their mutual relationship is helpful to policymakers to frame strategies [28].
There are only four main components of the price structure of diesel, crude oil price, currency exchange rate, government taxes, and other costs. The increase and decrease of diesel prices are dependent on the trend of these variables, and these variables are not the same throughout the sample period, and none of these variables moved together. India’s net import of crude oil and other petroleum products fell about 24% due to COVID-19 in the first quarter of the 2020-2021 financial year [29].
Due to COVID-19 and social distancing the demand for fuel dropped intensely. The way of working and the relationship between people had changed and adopted a new way during the pandemic [30]. The transportation industry prominent contributor to the economy of Nepal has been affected due to COVID-19. Nepal is completely dependent on the roadways and airways for means of transportation and is locked due to the lockdown. Transportation is interlinked with mobility and due to COVID-19 every sector related to transportation is affected everywhere in the world [31].
Due to COVID-19, there was a change in energy supply and demand. The crude oil prices have continued to decline, and it was the first time in history when there was a negative value, with the lowest price of -40.32 dollars per barrel. The price of natural gas was not so much affected by the pandemic, it only fluctuated a little in the first quarter of 2020 with a slight decrease [32]. Many factors influence the stock prices and the value of energy and fuel companies. But, the COVID-19 pandemic has harmed the energy and fuel sector and it has declined significantly. The situation of a decrease in the fuel and energy sector is temporary after the relaxation of the pandemic restrictions, and there will be a change in the prices of oil [33]. The economies of four Asian countries (India, Pakistan, Bangladesh, and Afghanistan) oil prices play a vital role in any nation’s market and economic performance, among other natural resources. If the oil price increases, it reduces the demand, but the reduction in oil price enhances the economic growth of a country. During COVID-19, a decline has been reported in the prices of oil and other natural resources that unfavorably affect the import of energy and exporting economies, globally [34].
COVID-19 harmed oil returns, and the global financial crises had a positive impact on oil returns. COVID-19 and the global financial crisis enhanced the volatility of the oil market. COVID-19 adversely affected the global financial crises and decreased the crude oil demand. After spreading the news of the pandemic, oil prices and demand both decreased [35].
There is a varied or mixed reaction of COVID-19 on the firms in US. The heterogeneous reaction of the firms could be determined by firm-specific qualities such as turnover rate, and size. COVID-19 pandemic caused a reduction in oil demand and was important to a decline in oil prices [1]. There is a positive relationship between shares returns and oil firms’ returns during COVID-19. The sentiment aspects of the pandemic COVID-19 affected the exporting countries adversely. The announcement of the COVID-19 reduced the oil demand worldwide [3]. From the above previous studies, there are no specific studies are available to analyze the impact of negativity of COVID-19 on the financial performance of the larger and smaller-scale production Indian oil and gas industry.
The study is purely based on the secondary data obtained from the websites. IOCL (Indian oil corporation limited), ONGC (Oil and Natural Gas Commission), BP (Bharat Petroleum), HP (Hindustan Petroleum), and GAI (Gas Authority of India limited) companies are the leading and bigger oil and Gas companies. While, CP (Chennai Petroleum), GG (Gujarat Gas), and IG (Indraprastha Gas) are the smaller oil and gas companies in India. There is a comparative study between the pre and post-COVID-19 period. The line chart is prepared to get the growth trend of total revenue, total expenses, and profits before tax (PBT) from 2015 to 2022. While the clustered column charts explain the comparative status of the financial ratios to reveal the symmetry of pre and post COVID-19 pandemic. The pre-COVID-19 period is before 2020 while the post-COVID-19 period is after 2020 and 2021. Ratio analysis is applied to get the profitability, liquidity, and solvency of Indian oil and gas companies [36].
Profitability(PBT)ratio $=\frac{\text { Profit Before Tax }}{\text { Total Revenue }} 100$; (1)
Liquidity (Current)ratio $=\frac{\text { Current Assets }}{\text { Current Liabilities }}$; (2)
Debt-Equity ratio $=\frac{\text { Long term debts }}{\text { Shareholders Equity }}$; (3)
where, Profit before tax = Total Sales Revenue – (Cost of Goods sold + Operating Expenses + Interest Expenses); Total revenue = Income from the selling of goods and services; Current assets = all the assets which can be converted into cash in normal course of business activities in an accounting period including cash and cash equivalent; Current liabilities = All the liabilities which are payable within an accounting period or a normal operating cycle; Long term debts = all the debts which are payable after an accounting period; Shareholders’ Equity = Share capital and retained earnings. The profitability ratio measures the profit earning capacity of the business organization while liquidity (current ratio) and debt-equity ratio indicates the short and long term paying ability of the business organization (Table 1).
Table 1. Explanation of trend of absolute and relative financial measures
|
No. |
Variables |
Interpretations of trend |
|
|
Growing |
Decline |
||
|
1 |
Total Revenue |
Enhancement in the production/activity level or increment in the sale price or both. |
Decrement in the production/activity level or sale price or both. |
|
2 |
Total Expenses |
Enhancement in the production/activity level or increment in the cost composition or both. |
Decrement in the production/activity level or decrement in the cost composition or both. |
|
3 |
Profit before Tax |
Enhancement in the excess of total revenues over total Expenses. |
Decrement of the excess of total revenues over total Expenses. |
|
4 |
Profitability Ratio |
Managerial and cost efficiency; increment in the sale price, and decrement in the total expenses. |
Managerial and cost inefficiency; decrement in the sale price, and increment in the total expenses. |
|
5 |
Liquidity Ratio (Current Ratio) |
Strengthening of short-term paying ability; Enhancement of the working capital. |
Weakening of short-term paying ability; decrement of the working capital. |
|
6 |
Solvency Ratio (Debt-Equity Ratio) |
Strengthening of long-term paying ability; Enhancement of the owners ‘equity in capital composition. |
Weakening of long-term paying ability, decrement of the owners ‘equity in capital composition. |
The comparative trend of variables considers the movement of lines in line charts and bars in clustered column charts.
Analysis and interpretations consider trends and comparative relational performance of Indian oil and gas companies. Trend performance consists trend of the total revenue, total expenses, and profits of the Indian oil and gas companies. While, comparative relational performance explains the relational profitability, liquidity, and long-term paying ability of the Indian oil and gas companies.
4.1 Trend of revenues of Indian oil and gas companies
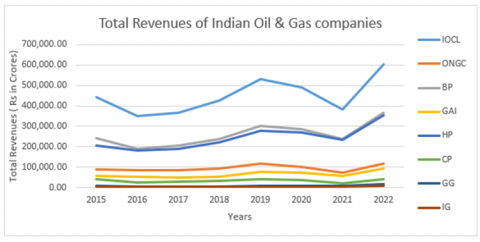
Revenue of the business organization refers to the income from the selling of goods and services. The higher income of a business organization is to be considered the demand for the product or services in the market and a favorable indication of the return of the operational activities. The positivity of revenue is the base for the development and growth of the business organization. The trend of the revenues indicate the absolute positive or negative financial performance. The increasing trend of total revenues is a positive indication while the declining trend explains negativity in terms of the growth of the business activities.
Figure 1. Growth trend of total revenue of Indian oil and gas companies
Source: Based on the values given in Appendix 1.
Figure 1 explains that the total revenues of the Indian oil and gas companies have an increasing trend from 2016 to 2019. During the pandemic period, revenues of Indian oil and gas companies start to decline from 2019 to 2021. There is more decline in the total revenues of the Indian oil and gas companies whose revenues are higher and a low decline in the lower revenue companies, proportionately. From the 2021 financial year, the total revenues of the Indian oil and gas companies started increasing in the ratio of the decline of the pandemic period. This refers that the Indian oil and gas companies with higher total revenues or larger scale production were affected negatively more than smaller Indian oil and gas companies during the pandemic period.
4.2 Trend of Total Expenses of Indian oil and gas Companies
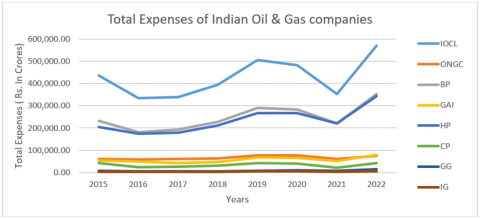
The total expenses refer to the total monetary sacrifice to get the product or services in the business organization. The total expenses of business organization include cost of goods sold, operating and interest expenses. The trend of the total expenses indicate the absolute positive or negative financial performance. The increasing trend of total revenues is a negative indication while the declining trend explains positivity in terms of the cost or managerial efficiency of the business activities if total revenues remain constant.
Figure 2. Growth trend of total expenses of Indian oil and gas companies
Source: Based on the values given in Appendix 2.
Figure 2 indicates that the total expenses of the Indian oil and gas companies are increasing trend from 2016 to 2019. During the pandemic period, the expenses of Indian oil and gas companies start to decline from 2019 to 2021. There is more decline in the total expenses of the Indian oil and gas companies whose expenses are higher and a low decline in the lower expenses companies, proportionately. From the 2021 financial year, the total expenses of the Indian oil and gas companies started increasing in the ratio of the decline of the pandemic period. This refers that the Indian oil and gas companies with higher total expenses or larger-scale production were affected more than smaller Indian oil and gas companies during the pandemic period.
4.3 Trend of Profit Before Tax (PBT) of Indian oil & gas companies
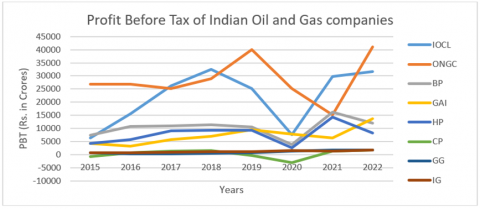
Profit before tax (PBT) is the excess of the total revenue over the total expenses of the business organization. The absolute higher amount of the PBT indicates the positivity of the results of the business activities. The trend of the profits (PBT) indicates the absolute positive or negative financial performance. The increasing trend of PBT is a positive indication while the declining trend explains negativity in terms of the cost or managerial efficiency of the business activities.
Figure 3. Growth trend of Profit Before Tax of Indian oil and gas companies
Source: Based on the values given in Appendix 2.
Figure 3 indicates that the profit before tax (PBT) of the Indian oil and gas companies is an increasing trend from 2016 to 2019. During the pandemic period, the PBT of Indian oil and gas companies starts to decline from 2019 to 2020. There is more decline in the PBT of the Indian oil and gas companies whose PBT is higher and a low decline in the lower PBT companies, proportionately. From the 2020 financial year, the profits of the Indian oil and gas companies started increasing in the ratio of the decline of the pandemic period. This refers that the Indian oil and gas companies with higher PBT or larger-scale production were affected more during the pandemic period. Due to the pandemic, total revenues, and total expenses were affected for two years while the profits of the Indian oil and gas companies were affected only for one year. This indicates that the Indian oil and gas companies reduced their total expenses more than their total revenue.
4.4 Comparative relational profitability
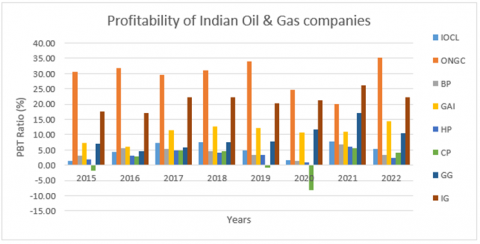
Profitability refers the profit earning capacity of the business organization in relational measures i.e. Ratio or percentage. The higher relational profitability refers to the high profit-earning capacity of the business organization, comparatively. The comparative relational performance of profitability explains the relational profit-earning capacity of the firms for a specific time period. The fluctuations among the profitability measures indicate the disparity in profit earning capacity while the symmetry reveals the equality. The higher profitability ratio is favorable and indicates the cost or managerial efficiency of the firms.
Figure 4. Profitability (Profit Before Tax ratio) of Indian oil and gas companies
Source: Based on the values given in Appendix 4.
Figure 4 reveals that there is a decrement in the profit-earning capacity of the Indian oil and gas companies during the pandemic period (2019 to 2020). In 2020, the profitability of the Indian oil and gas companies was at its lowest level but starts enhancing drastically in 2021. After the pandemic, smaller revenue companies (CP, GG, and IG) profitability is better than the higher revenue or larger-scale production companies.
4.5 Comparative relational liquidity
Liquidity refers to the paying capacity of debts in the business organization in the short run or within an accounting period. The comparative relational performance of liquidity explains the relational short-term paying capacity of the firms for a specific period. The fluctuations among the liquidity measures indicate the disparity in short-term paying capacity while the symmetry reveals equality. The higher liquidity ratio indicates the strength of paying the short-term liabilities arising in the normal course of business activities. But, a higher liquidity ratio is the indication of blockage of funds in the current assets and a lower liquidity ratio may stop business activities due to the unavailability of the funds to pay out routine expenses. Hence, the standard liquidity ratio of 2:1 is advised. But, liquidity of 2:1 is relaxed in firms as per the size and nature of the industry.
Figure 5. Liquidity (current ratio) of Indian oil and gas companies
Source: Based on the values given in Appendix 5.
Figure 5 explains that there is an insignificant change in the liquidity of the Indian oil and gas companies during the pandemic COVID-19. There are only 2 companies with higher liquidity (ONGC & IG) during pandemic period. Normally, Indian oil and gas companies’ liquidity ratio is lower than 1 except for ONGC and IG. After the pandemic period, lower liquidity ratio companies strengthened their liquidity status.
4.6 Comparative relational Solvency (Long Term paying ability)
Long-term paying ability refers to the financial soundness of the business organization to payout all debts payable after an accounting period. The comparative relational performance of long-term paying ability explains the relational long-term paying strength of the firms for a specific period. The fluctuations among the long-term paying ability measures indicate the disparity in long-term paying capacity while the symmetry reveals equality. The lower long-term paying ability ratio is favorable and indicates the long-term paying strength of the firms. While the higher long-term paying ability ratio is an indication of the weaker long-term paying ability of the firms. However, there is higher long-term paying ability ratio is an indication of managing the funds from external sources. Long-term borrowings or external funds are favorable for the firms while the normal rate of return is more than the contractual rate of external funds. However, the external funds are negative for the firms in the context of long-term paying ability and negative when the contractual rate is more than the normal rate of return. Hence, the standard liquidity ratio of 1:1 is advised. But, liquidity of 1:1 is relaxed in firms as per the size and nature of the industry.
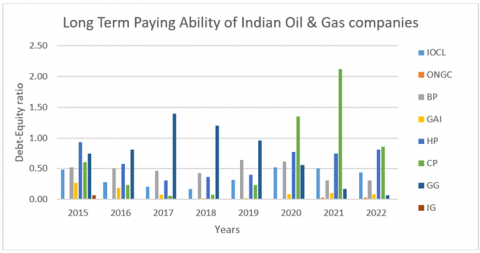
Figure 6 explains the solvency (long-term paying ability) of the Indian oil and gas companies and observed the significant differences among the long-term paying abilities of the Indian oil and gas companies. The solvency status of the Indian oil and gas companies was insignificantly lower during the pandemic COVID-19 period. The solvency status of the larger oil and gas companies is stronger than the smaller companies in India during pandemic. The larger-scale production oil and gas companies maintain their debt-equity ratio below 0.5 which is a good indication of solvency. While smaller production oil and gas companies enhanced their solvency ratio after the pandemic period. Smaller-scale production oil and gas companies enjoy the leverage to enhance their profits and profitability.
Figure 6. Long term paying ability (Debt-Equity ratio) of Indian oil and gas companies
Source: Based on the values given in Appendix 6.
The above descriptive analysis based on the financial variables reveal that the total revenues, total expenses, and profits of the Indian oil and gas companies were on an increasing trend before the COVID-19 pandemic and starts to decline from the pandemic outbreak in 2020 [18]. There is more decline in total revenues, total expenses, and profits of the larger scale production than the smaller scale production Indian oil and gas companies.
The total revenues, and total expenses, start growing from the 2021 financial year while profits start increasing from 2020 [17]. This implies that the Indian oil and gas companies reduced their total expenses more than their total revenue. The post-COVID-19, increment in the total revenues, total expenses, and profits were higher in the larger-scale production than the smaller scale production Indian oil and gas companies. This refers that the Indian oil and gas companies with higher total revenues, total expenses, and PBT or larger scale production were affected more than smaller Indian oil and gas companies during the pandemic period.
There is a decrement in the profit-earning capacity of the Indian oil and gas companies during the pandemic period. After the COVID-19 pandemic, smaller-scale production Indian oil and gas companies’ profitability increased better than the larger-scale Indian oil and gas companies. This indicates that fixed expenses in the larger scale production Indian oil and gas companies enhanced more than the smaller scale Indian oil and gas companies, proportionately. There was a negative impact on the financial performance of the Indian oil and gas companies for a short span period from 2019 to 2020 and enhanced again from 2021 [33].
There insignificant change in the liquidity status of the Indian oil and gas companies during the pot pandemic period. Overall, the average liquidity of the Indian oil and gas companies is lower than 1. In heavy industries, the liquidity ratio range of 0.5 to 1 is satisfactory. The solvency status of the Indian oil and gas companies was lower during the pandemic COVID-19 period. The solvency status of the larger Indian oil and gas companies is better than the smaller Indian oil and gas companies. Smaller production oil and gas companies enhanced their solvency ratio after the pandemic period to enjoy the leverage to enhance their profits and profitability [18].
After analysis, interpretations, and discussions it can be concluded that there was an absolute decrement in the total revenue, total expenses, and profits of the Indian oil and gas companies during the COVID-19 pandemic period. The absolute decrement of the total revenue, total expenses, and profits of the smaller scale production companies were lower than the higher scale production Indian oil and gas companies during the COVID-19 pandemic period. The Indian oil and gas companies with higher total revenues, total expenses, and PBT or larger scale production were affected more than smaller Indian oil and gas companies during the pandemic period.
The profit-earning capacity of all Indian oil and gas companies decreased during pandemic period. After the COVID-19 pandemic, the profitability of the smaller-scale production of Indian oil and gas companies increased more than the higher-scale production of Indian oil and gas companies. This refers to the enhancements of fixed expenses in the larger scale production of Indian oil and gas companies more than the smaller scale Indian and gas companies, proportionately.
There were no significant changes in the liquidity of the Indian oil and gas companies during pandemic period. The solvency or long-term paying ability of higher scale production Indian oil and gas companies is better than the smaller scale production Indian oil and gas companies. Solvency of the larger scale Indian oil and gas companies and external debts of the smaller scale production oil and gas companies enhanced, negligibly.
The smaller-scale production of Indian oil and gas companies start working on leverage after the pandemic which enhanced their profitability. Overall, there was a negative impact on the financial performance of the Indian oil and gas companies for a short span period from 2019 to 2020. After the COVID-19 pandemic period, there were absolute increments in the revenue, expenses, and profits of larger-scale production of Indian oil and gas companies more than the smaller companies. The profitability of the smaller scale companies enhanced better than larger scale companies after the pandemic. There were insignificant changes in the liquidity of Indian oil and gas companies pre and post-COVID-19 period. To face the unexpected situation like COVID-19 pandemic, the Indian oil and gas companies has to prepare themselves by preparing contingencies fund to nullify the impact of unexpected natural calamity or pandemic. The contingency fund will lower the negativity of pandemic on revenue and profits in Indian oil and gas firms to continue their operational activities. The study is based on the secondary data available on the websites of the Indian oil and gas companies, only. There is future scope to analyze each and every expenses of total cost absolutely and relatively to get the real scene of abnormality during the pandemic period.
The study is supported via funding from Prince Sattam Bin Abdulaziz university project number (PSAU/2023/R/1444).
Appendix 1. Total Revenues of Indian oil and gas companies (In Rs. crores)
|
Years |
IOCL |
ONGC |
BP |
GAI |
HP |
CP |
GG |
IG |
|
2015 |
441,670.18 |
88,237.53 |
240,286.86 |
57,602.84 |
207794.59 |
41902.67 |
9113.4 |
3715.53 |
|
2016 |
349,498.59 |
84,552.08 |
191,315.49 |
52,771.85 |
180709.24 |
25882.17 |
6150.53 |
3715.68 |
|
2017 |
364,142.77 |
85,345.95 |
204,811.25 |
49,325.12 |
188538.62 |
27731.58 |
5118.93 |
3880 |
|
2018 |
427,453.32 |
92,813.24 |
239,332.51 |
54,648.58 |
221182.06 |
32566.06 |
6210.01 |
4635.52 |
|
2019 |
530,829.77 |
117,128.43 |
300,258.65 |
76,671.11 |
276889.68 |
41397.12 |
7865.69 |
5910.99 |
|
2020 |
489,215.08 |
102,270.87 |
287,464.26 |
73,287.80 |
270604.58 |
37195.56 |
10384 |
6641.65 |
|
2021 |
382,608.33 |
75,229.69 |
236,889.57 |
58,734.61 |
235785.54 |
22551.64 |
9928.28 |
5091.03 |
|
2022 |
602,488.01 |
116,860.98 |
364,689.19 |
93,673.34 |
352652.61 |
43399.04 |
16546.96 |
7925 |
Source: Based on financial statements of Concerned companies available on the website of moneycontrol.com
Appendix 2. Total Expenses of Indian oil and gas companies (In Rs. crores)
|
Years |
IOCL |
ONGC |
BP |
GAI |
HP |
CP |
GG |
IG |
|
2015 |
435,335.42 |
61,298.38 |
232,871.35 |
53,381.34 |
203644.94 |
42640.59 |
8470.98 |
3066.49 |
|
2016 |
334,036.30 |
57,726.65 |
180,664.31 |
49,599.05 |
174965.63 |
25123.54 |
5872.66 |
3080.79 |
|
2017 |
337,821.53 |
60,130.43 |
193,768.46 |
43,615.57 |
179517.78 |
26366.54 |
4815.6 |
3019.31 |
|
2018 |
394,889.04 |
63,920.77 |
228,046.54 |
47,717.90 |
211980.13 |
31107.81 |
5747.17 |
3603.03 |
|
2019 |
505,702.85 |
77,174.41 |
289,819.03 |
67,259.96 |
267551.02 |
41695.14 |
7253.97 |
4710.98 |
|
2020 |
481,604.55 |
77,003.13 |
283,712.39 |
65,446.07 |
268029.06 |
40211.59 |
9176.22 |
5226 |
|
2021 |
352,892.68 |
60,201.93 |
220,720.90 |
52,348.80 |
221538.75 |
21275.1 |
8223.58 |
3759.54 |
|
2022 |
570,754.94 |
75,794.46 |
352,698.69 |
80,083.05 |
344448.91 |
41567.4 |
14821.65 |
6159.12 |
Source: Based on financial statements of Concerned companies available on the website of moneycontrol.com
Appendix 3. Profit before Tax (PBT) of Indian oil and gas companies (In Rs. crores)
|
Years |
IOCL |
ONGC |
BP |
GAI |
HP |
CP |
GG |
IG |
|
2015 |
441,670.18 |
88,237.53 |
240,286.86 |
57,602.84 |
207794.59 |
41902.67 |
9113.4 |
3715.53 |
|
2016 |
349,498.59 |
84,552.08 |
191,315.49 |
52,771.85 |
180709.24 |
25882.17 |
6150.53 |
3715.68 |
|
2017 |
364,142.77 |
85,345.95 |
204,811.25 |
49,325.12 |
188538.62 |
27731.58 |
5118.93 |
3880 |
|
2018 |
427,453.32 |
92,813.24 |
239,332.51 |
54,648.58 |
221182.06 |
32566.06 |
6210.01 |
4635.52 |
|
2019 |
530,829.77 |
117,128.43 |
300,258.65 |
76,671.11 |
276889.68 |
41397.12 |
7865.69 |
5910.99 |
|
2020 |
489,215.08 |
102,270.87 |
287,464.26 |
73,287.80 |
270604.58 |
37195.56 |
10384 |
6641.65 |
|
2021 |
382,608.33 |
75,229.69 |
236,889.57 |
58,734.61 |
235785.54 |
22551.64 |
9928.28 |
5091.03 |
|
2022 |
602,488.01 |
116,860.98 |
364,689.19 |
93,673.34 |
352652.61 |
43399.04 |
16546.96 |
7925 |
Source: Based on financial statements of Concerned companies available on the website of moneycontrol.com
Appendix 4. Profitability (PBT ratio) of Indian oil and gas companies
|
Years |
IOCL |
ONGC |
BP |
GAI |
HP |
CP |
GG |
IG |
|
2015 |
1.43 |
30.53 |
3.09 |
7.33 |
2.00 |
-1.76 |
7.05 |
17.47 |
|
2016 |
4.42 |
31.73 |
5.57 |
6.01 |
3.18 |
2.93 |
4.52 |
17.09 |
|
2017 |
7.23 |
29.55 |
5.39 |
11.58 |
4.78 |
4.92 |
5.93 |
22.18 |
|
2018 |
7.62 |
31.13 |
4.72 |
12.68 |
4.16 |
4.48 |
7.45 |
22.27 |
|
2019 |
4.73 |
34.11 |
3.48 |
12.27 |
3.37 |
-0.72 |
7.78 |
20.30 |
|
2020 |
1.56 |
24.71 |
1.31 |
10.70 |
0.95 |
-8.11 |
11.63 |
21.31 |
|
2021 |
7.77 |
19.98 |
6.83 |
10.87 |
6.04 |
5.66 |
17.17 |
26.15 |
|
2022 |
5.27 |
35.14 |
3.29 |
14.51 |
2.33 |
4.22 |
10.43 |
22.28 |
Source: Based on financial statements of Concerned companies available on the website of moneycontrol.com
Appendix 5. Liquidity (current ratio) of Indian oil and gas companies
|
Years |
IOCL |
ONGC |
BP |
GAI |
HP |
CP |
GG |
IG |
|
2015 |
0.99 |
1.57 |
0.93 |
1.06 |
1.16 |
0.72 |
0.74 |
0.87 |
|
2016 |
0.88 |
1.72 |
0.89 |
0.99 |
1.03 |
0.74 |
0.36 |
1.02 |
|
2017 |
0.72 |
1.55 |
0.79 |
1.09 |
0.72 |
0.82 |
0.37 |
1.39 |
|
2018 |
0.67 |
0.44 |
0.83 |
1.02 |
0.78 |
0.74 |
0.47 |
1.52 |
|
2019 |
0.81 |
0.61 |
0.99 |
1.10 |
0.76 |
0.68 |
0.62 |
1.46 |
|
2020 |
0.69 |
0.67 |
0.70 |
0.97 |
0.65 |
0.34 |
0.79 |
1.39 |
|
2021 |
0.73 |
0.86 |
0.93 |
0.86 |
0.70 |
0.54 |
0.64 |
1.32 |
|
2022 |
0.76 |
0.98 |
0.76 |
1.10 |
0.70 |
0.77 |
0.55 |
1.21 |
Source: Based on financial statements of Concerned companies available on the website of moneycontrol.com
Appendix 6. Solvency (Debt-Equity ratio) of Indian oil and gas companies
|
Years |
IOCL |
ONGC |
BP |
GAI |
HP |
CP |
GG |
IG |
|
2015 |
0.48 |
0 |
0.52 |
0.27 |
0.93 |
0.60 |
0.75 |
0.07 |
|
2016 |
0.28 |
0 |
0.50 |
0.19 |
0.58 |
0.23 |
0.81 |
0 |
|
2017 |
0.20 |
0 |
0.46 |
0.08 |
0.31 |
0.06 |
1.39 |
0 |
|
2018 |
0.17 |
0 |
0.43 |
0.02 |
0.37 |
0.07 |
1.20 |
0 |
|
2019 |
0.32 |
0 |
0.64 |
0.02 |
0.40 |
0.23 |
0.96 |
0 |
|
2020 |
0.53 |
0.01 |
0.62 |
0.08 |
0.77 |
1.35 |
0.56 |
0 |
|
2021 |
0.50 |
0.03 |
0.31 |
0.10 |
0.75 |
2.12 |
0.17 |
0 |
|
2022 |
0.44 |
0.03 |
0.31 |
0.09 |
0.81 |
0.86 |
0.07 |
0 |
Source: Based on financial statements of Concerned companies available on the website of moneycontrol.com
[1] Iyke, B.N. (2020). COVID-19: The reaction of US oil and gas producers to the pandemic. Energy Research Letters, 1(2): 1-4. https://doi.org/10.46557/001c.13912
[2] Aruga, K., Islam, M.M., Jannat, A. (2020). Effects of COVID-19 on Indian energy consumption. Sustainability, 12(14): 5616. https://doi.org/10.3390/su12145616
[3] Prabheesh, K.P., Garg, B., Padhan, R. (2020). Time-varying dependence between stock markets and oil prices during COVID-19: The case of net oil-exporting countries. Economics Bulletin, 40(3): 2408-2418.
[4] Gharaibeh, A.T., Saleh, M.H., Jawabreh, O., Ali, B.J. (2022). An empirical study of the relationship between earnings per share, net income, and stock price. Applied Mathematics & Information Sciences, 16(5): 673-679. http://dx.doi.org/10.18576/amis/160502
[5] Ali, A., Ali, B.J. (2022). Disparity in total resources growth and its impact on the profitability: An analytical approach. Planning, 17(5): 1441-1447. https://doi.org/10.18280/ijsdp.170508
[6] Wang, F., Chen, W., Fakieh, B., Ali, B.J. (2021). Stock price analysis based on the research of multiple linear regression macroeconomic variables. Applied Mathematics and Nonlinear Sciences, 7(1): 267-274. https://doi.org/10.2478/amns.2021.2.00097
[7] Ali, B.J., Oudat, M.S. (2021). Board characteristics and intellectual capital performance: empirical evidence of bahrain commercial banks. Academy of Accounting and Financial Studies Journal, 25(4): 1-10.
[8] Ali, B.J., Oudat, M.S. (2020). Financial risk and the financial performance in listed commercial and investment banks in Bahrain bourse. International Journal of Innovation, Creativity and Change, 13(12): 160-180.
[9] Oudat, M.S., Ali, B.J. (2021). The underlying effect of risk management on banks' financial performance: an analytical study on commercial and investment banking in bahrain. Ilkogretim Online, 20(5): 404-414. https://doi.org/10.17051/ilkonline.2021.05.42
[10] Harban, F.J.M.J., Ali, B.J., Oudat, M.S. (2021). The effect of financial risks on the financial performance of banks listed on bahrain bourse: An empirical study. Information Sciences Letters, 10(S1): 71-89. http://dx.doi.org/10.18576/isl/10S10
[11] Shibly, M., Alawamleh, H.A., Nawaiseh, K.A., Ali, B.J., Almasri, A., Alshibly, E. (2021). The relationship between administrative empowerment and continuous improvement: An empirical study. Revista Geintec-Gestao Inovacao E Tecnologias, 11(2): 1681-1699.
[12] Ali, B.J. (2022). Integration of supply chains and operational performance: The moderating effects of knowledge. Information Sciences Letters, 11(4): 1069-1076.
[13] Alrabei, A.M., Al-Othman, L.N., Al-Dalabih, F.A., Taber, T.A., Ali, B.J. (2022). The impact of mobile payment on the financial inclusion rates. Information Sciences Letters, 11(4): 1033-1044.
[14] Shan, R., Xiao, X., Dong, G., Zhang, Z., Wen, Q., Ali, B. (2022). The influence of accounting computer information processing technology on enterprise internal control under panel data simultaneous equation. Applied Mathematics and Nonlinear Sciences. https://doi.org/10.2478/amns.2022.2.0157
[15] Meher, B.K., Hawaldar, I.T., Mohapatra, L., Sarea, A. (2020). The impact of COVID-19 on price volatility of crude oil and natural gas listed on multi commodity exchange of India. International Journal of Energy Economics and Policy, 10(5): 422-431. https://doi.org/10.32479/ijeep.10047
[16] Nyga-Łukaszewska, H., Aruga, K. (2020). Energy prices and COVID-immunity: The case of crude oil and natural gas prices in the US and Japan. Energies, 13(23): 6300. https://doi.org/10.3390/en13236300
[17] Norouzi, N. (2021). Post‐COVID‐19 and globalization of oil and natural gas trade: Challenges, opportunities, lessons, regulations, and strategies. International Journal of Energy Research, 45(10): 14338-14356. https://doi.org/10.1002/er.6762
[18] Kusmayadi, D. (2022). Analysis of gas, oil, and coal company performance during pandemic of Covid-19: A case study of Indonesia. International Journal of Energy Economics and Policy, 12(1): 23-31. https://doi.org/10.32479/ijeep.11944
[19] Prabheesh, K.P., Padhan, R., Garg, B. (2020). COVID-19 and the oil price–stock market nexus: Evidence from net oil-importing countries. Energy Research Letters, 1(2): 13745.
[20] Aruna, B., Rajesh, A.H. (2020). Impact of COVID 19 virus cases and sources of oil price shock on Indian stock returns. Structural VAR Approach. In IAEE Energy Forum/COVID-19 Issue, 2020: 68-70.
[21] Meher, B.K., Hawaldar, I.T., Thomas Gil, M., Dum, Z. (2021). Measuring leverage effect of COVID-19 on stock price volatility of energy companies using high frequency data. International Journal of Energy Economics and Policy, 11(6): 489-502. https://doi.org/10.32479/ijeep.11866
[22] Si, D.K., Li, X.L., Xu, X., Fang, Y. (2021). The risk spillover effect of the COVID-19 pandemic on energy sector: Evidence from China. Energy Economics, 102: 105498. https://doi.org/10.1016/j.eneco.2021.105498
[23] Zhang, Y. (2021). The COVID-19 outbreak and oil stock price fluctuations: Evidence from China. Energy Research Letters, 2(3): 27019. https://doi.org/10.46557/001c.27019
[24] Hashmi, N. (2021). Evolutionary analysis of global oil and gas sector and its impact on global economy. International Journal of Management (IJM), 12(2): 773-779. https://doi.org/10.34218/IJM.12.2.2021.075
[25] Priya, S.S., Cuce, E., Sudhakar, K. (2021). A perspective of COVID 19 impact on global economy, energy and environment. International Journal of Sustainable Engineering, 14(6): 1290-1305. https://doi.org/10.1080/19397038.2021.1964634
[26] Yamini, Y. (2020). The impact of COVID-19 on the stock returns of companies of oil & gas industry of G7 nations. International Journal of Management, 11(11): 477-488.
[27] Afaha, J., Aderinto, E., Oluwole, E., Oyinlola, A., Akintola, Y. (2021). Effect of COVID-19 on the Nigerian oil and gas industry and impact on the economy. CPEEL’s COVID, 19(11): 1-22.
[28] Piya, S., Shamsuzzoha, A., Khadem, M. (2022). Analysis of supply chain resilience drivers in oil and gas industries during the COVID-19 pandemic using an integrated approach. Applied Soft Computing, 121: 108756. https://doi.org/10.1016/j.asoc.2022.108756
[29] Shinghal, A.K., Paliwal, V., Nagar, H. (2020). Effects of covid-19 pandemic on diesel: A boon or bane in the indian context. Journal of International Business and Economy, 21(1): 37-53.
[30] Rodrigues, M.V.G., Duarte, T.E., dos Santos, M., Gomes, C.F.S. (2021). Prospective scenarios analysis Impact on demand for oil and its derivatives after the COVID-19 pandemic. Brazilian Journal of Operations & Production Management, 18(2): 1-15. https://doi.org/10.14488/BJOPM.2021.039
[31] Singh, D.B., Sah, D.K. (2021). Assessment of the impact of COVID-19 on transportation and its inter-linked sectors of Nepal. Journal of Engineering Issues and Solutions, 1(1): 8-19. https://doi.org/10.3126/joeis.v1i1.36813
[32] Lu, H., Ma, X., Ma, M. (2020). What happened and will happen in the energy sector under the impact of COVID-19? A review. EnerarXiv, 1: 21.
[33] Susu, S. (2021). The impact of the COVID-19 pandemic on the financial performance and price of the shares of the energy and fuel companies listed on the main segment of the Bucharest Stock Exchange. The USV Annals of Economics and Public Administration, 21(2 (34)): 27-36.
[34] Zhou, H., Li, D., Mustafa, F., Altuntaş, M. (2022). Natural resources volatility and South Asian economies: Evaluating the role of COVID-19. Resources Policy, 75: 102524. https://doi.org/10.1016/j.resourpol.2021.102524
[35] Shehzad, K., Zaman, U., Liu, X., Górecki, J., Pugnetti, C. (2021). Examining the asymmetric impact of COVID-19 pandemic and global financial crisis on Dow Jones and oil price shock. Sustainability, 13(9): 4688. https://doi.org/10.3390/su13094688
[36] Ali, A., Haque, M.I. (2014). Ratio analysis: A comparative study of National Petrochemicals co. and Sahara petrochemicals co. of Saudi Arabia. International Journal of Management Academy, 2(4): 53-61.