Chao Xu | Zhongwu Li* | Jiafu Su
© 2022 IIETA. This article is published by IIETA and is licensed under the CC BY 4.0 license (http://creativecommons.org/licenses/by/4.0/).
OPEN ACCESS
E-commerce platforms are in the development trend of differentiation and vertical segmentation, and quality content output will become the core competitiveness of new e-commerce platforms. This study investigated data from 226 consumers of the Taobao live streaming shopping platform. This study incorporates the Technology Acceptance Model (TAM) with Social Presence Theory to investigate the experiential factors and system characteristics that psychologically influence users' behavioral intentions. The empirical results show that interactivity has a significant positive effect on purchase intention, and social presence, perceived ease of use and perceived usefulness play a mediating role in the process of interactivity affecting purchase intention. This research can help enterprises and merchants innovate system features and improve the user experience for their customers.
live streaming shopping, social presence, technology acceptance model, sustainable purchase intention
Live streaming shopping brings the upgrade of the shopping scene, from the traditional e-commerce offers text and pictures, to today's new live streaming shopping with real-time video display and interaction, consumers' shopping needs continue to improve. Live streaming shopping to a certain extent to make up for the shortcomings of the lack of realism in the virtual shopping scene, to create a "buy while you watch" shopping experience for consumers. The interactivity of live streaming shopping allows consumers to simulate to "feel, touch and use" the product, thus making the product display more realistic, just like in a physical shopping environment, users can enhance consumers' perception of the product by understanding the details of the product through the anchor [1].
Live streaming shopping makes the offline real economy no longer bound to stores, regions and distances, and breaks the traditional "transmission-reception" propagation mode, stimulating the audience with rich emotions in the propagation process so as to achieve the propagation effect [2]. Good interactivity leads to a certain level of cognitive immersion, which enhances consumers' shopping enjoyment and overall attitude and involvement in the online store, thus helping to increase consumers' purchase intentions [3]. On the one hand, the live streaming scene penetrates upstream of the industry chain, such as live streaming of origin and factory, to shorten the industrial chain and improve industrial efficiency; on the other hand, it penetrates into the offline retail industry, such as live streaming of shopping areas and stalls, to promote online and offline integration and accelerate the pace of digital transformation of the offline retail industry.
As the final psychological decision before the consumer's purchase behavior, the consumer's purchase intention is crucial for the consumer itself, which is an extension of the behavior and can reflect the consumer's own behavioral tendencies more clearly. To this end, this study proposes a theoretical model that can more effectively measure the factors that influence consumers' purchase intention in live streaming shopping. In addition, the study aims to explain the impact of the features of live streaming shopping on consumer experience and purchase intentions, and to provide useful suggestions for anchors and merchants in online marketing to improve consumers' purchase intentions in live streaming shopping.
2.1 Relationship between interactivity, perceived ease of use, perceived usefulness, social presence, and purchase intention
Interaction is very effective for the transmission of information, so that consumers do not have to spend too much effort to understand the information transmitted by the anchor, which improves the effectiveness of communication, reduces the communication barriers brought about by the different knowledge backgrounds of communication subjects, and makes it easier for consumers to understand and master live streaming shopping [4]. Cyr et al. [5] also found that for most consumers, the ability to get a better sense of interactivity is associated with higher ratings of features such as ease of use of the website. Islam et al. [6] found that high levels of interaction positively influenced consumer perceptions and that the virtual shopping environment was more useful, easier to use, and enjoyable. Therefore, the following hypothesis is proposed:
H1: Interactivity has a positive impact on perceived ease of use in live streaming shopping.
In the live streaming shopping scenario, anchors provide timely feedback and targeted answers based on users' questions, and users share product details and usage experiences through comments among themselves, and the effective information interaction among them promotes the sharing of product knowledge and information [7], reduces users' anxiety about product uncertainty, and enhances users' perception of the usefulness of live streaming shopping [8]. Zhou et al. [9] also found that effective interaction between users and anchors not only increases consumers' interest in shopping, but also satisfies consumers' sense of involvement, and the pleasant experience obtained through interaction helps to maintain a good relationship between anchors and consumers and form perceived usefulness of consumers. For most consumers, a better sense of interactivity will increase consumers' evaluation of the usefulness and ease of use of the website [10], which will also lead to consumer loyalty to the website. Therefore, the following hypothesis is proposed:
H2: Interactivity has a positive effect on perceived usefulness in live streaming shopping.
At the level of interpersonal interactions, social presence is described as a warm sense of socialization that the medium brings to the user [11], i.e., a psychological perception that the user interacts with others in the virtual space and perceives the presence of others. In the bidirectional interaction scenario of live streaming shopping, anchors can display products in multi-dimensional and multi-angle, and exchange product information with users to create a face-to-face shopping scenario, allowing users to experience the reality of being there, seeing is believing, which can gradually instill a sense of warmth and socialization between people and create a strong atmosphere of social presence [12], giving users a good immersive experience [13]. It can also create an "immersive" shopping situation and a unique "virtual touch" perception [9]. Ou et al. [14] also found that interactions promote social presence and to some extent influence consumer trust building and repeat transaction forming. Therefore, the following hypothesis is proposed:
H3: Interactivity has a positive impact on social presence in live streaming shopping.
The instant interaction through pop-up information during the live broadcast provides a channel for the anchor to understand users' consumption needs, and the anchor consciously adjusts the recommended products to meet their consumption needs according to the users' demands. Users can also send pop-ups to communicate with other users to ask questions or express their opinions about the product. The bidirectional information exchange between users and anchors and between users and users is not bound by time and space, which can arouse users' desire to participate [15]. Online shopping is a social process. During the interaction, users can obtain information, experience and advice from others to complete their shopping decisions, which stimulates consumers' purchase intentions and triggers their purchase behavior [16]. Therefore, the following hypothesis is proposed:
H4: Interactivity has a positive impact on purchase intention in live streaming shopping.
The shopping site itself is a form of information technology, and for consumers who visit online stores, their perception of the system determines their willingness to try out this new way of shopping. The cognitive factors of both perceived ease of use and perceived usefulness are derived from the technology acceptance model, where perceived ease of use influences perceived usefulness [17], and both perceived usefulness and perceived ease of use influence intention to use through attitudes in the technology acceptance model [18]. Convenient plays an important role in helping to achieve marketing goals, and Internet experience and Convenient are drivers of Internet use [19, 20]. Technology acceptance pioneers who maintain a positive attitude towards new technologies and services are more like pragmatists, people tend to focus more on ease of use [21] and users are more likely to shift their goals when the content and functionality are too complex [22]. Therefore, the following hypothesis is proposed:
H5: Perceived ease of use has a positive impact on the perceived usefulness of live streaming shopping.
H6: Perceived ease of use has a positive effect on purchase intention for live streaming shopping.
H7: Perceived ease of use mediates the effect of interactivity on purchase intention.
When customers visit a website, the information, pictures, videos, website helpers, online reviews or online customer service, etc., all trigger different levels of social presence. If consumers can experience a high-quality website presence and feel relaxed, easy, free or stress-free when browsing products, this will inevitably make consumers feel that the website is real and useful [11]. Consumers' perceptions of shopping websites are no longer limited to time and cost savings; their needs have increased to the level of social presence such as friendliness, sensitivity, friendliness, and sociability. The ability to make consumers perceive a shopping website not only as an emotionless computer system but also as a sentient and independent individual can greatly influence consumers' purchase intentions [23]. Fan et al. [24] point out that social presence makes users of live streaming rooms feel connected to others, satisfies their need for social interaction, and gives them a satisfying live streaming viewing experience, which in turn promotes their willingness to continue using it. Ou et al. [14] found that interactions promote social presence and to some extent influence consumer trust building and repeat transaction formation. Therefore, the following hypothesis is proposed:
H8: Social presence has a positive effect on the perceived usefulness of live streaming shopping.
H9: Social presence has a positive effect on purchase intention for live streaming shopping.
H10: Social presence mediates the effect of interactivity on purchase intention.
Live streaming shopping offers consumers a wealth of product information, competitive product prices, a large variety of products, and flexible shopping options. All features that increase the benefits or reduce the costs of shopping for consumers are relative advantages offered by online shopping, which can make consumers perceive the usefulness of live streaming shopping and thus increase their intention to shop online [25]. The perceived usefulness of live streaming shopping emphasizes the shopping experience of consumers in the shopping process and the results of accomplishing shopping goals, and the perceived Convenient of live streaming shopping places more emphasis on the shopping process of achieving shopping goals, i.e., the ease of use of live streaming shopping. The easier consumers perceive the operation of online shopping, the more likely they are to have the intention to shop [26]. Also, the stronger the consumers' perception of ease of use of online shopping, the more their perception of usefulness of online shopping increases [27]. Therefore, the following hypothesis is proposed:
H11: Perceived usefulness has a positive effect on purchase intention for live streaming shopping.
H12: Perceived usefulness mediates the effect of vividness on purchase intention.
2.2 Research model
Based on the above literature review and hypotheses, the following theoretical model was constructed in this study. As shown in the Figure 1 below, interactivity is the variable of external stimuli. The model is used to test the mediating effects of perceived usefulness, perceived ease of use, and social presence. In addition, the model identifies the relationship between perceived ease of use, perceived usefulness, and social presence.
Figure 1. Conceptual framework of this study
3.1 Questionnaire
This study reviewed previous studies and developed a questionnaire on consumers' purchase intention in live streaming shopping. Five interactive question items from Le et al. [28] were used to represent the characteristic factors of live streaming shopping. The items of perceived ease of use and perceived usefulness were adapted from Vahdat et al. [29]. In addition, social presence was measured in the study by Algharabat et al. [30] to determine the psychological experience of users. Four purchase intention question items from Ventre and Kolbe [31] were used. All of the established scales from previous studies were used in this study. In this paper, all question items were measured using the Likert five-level scale.
3.2 Data collection and analysis
In this study, the purchase intention of live streaming shopping consumers is studied by users who have used live streaming shopping.Convenient sampling was used in this study and non-probability sampling method is the most commonly used method because it is less costly than probability sampling and saves time in implementation [32]. Electronic questionnaires are a common questionnaire survey method [33], and online questionnaires can improve the speed of questionnaire survey and get the questionnaires to the respondents in a short period of time. In this study, social media such as WeChat, QQ and email were used to distribute and collect electronic questionnaires from consumers who use live streaming shopping.
To effectively measure the model and identify relationships between variables, Amos 24.0 software was used to analyze the data and help draw conclusions from the study. Structural equation modeling (SEM) is a statistical data analysis tool that combines multiple regression analysis, path analysis, and confirmatory factor analysis methods and can be used to explain the relationship between one or more independent variables and one or more dependent variables [34]. SEM is a powerful and important research method [35], which can ensure the quality of research results. Therefore, SEM is used in order to analyze data information and to determine research results.
Table 1. Reliability analysis
|
Dimensions |
Title items |
Corrected term to total correlations |
Cronbach's Alpha after deleting items |
Cronbach's Alpha |
Total Cronbach's Alpha |
|
I |
I1 |
.674 |
.873 |
.886 |
.934 |
|
I2 |
.795 |
.846 |
|||
|
I3 |
.703 |
.866 |
|||
|
I4 |
.726 |
.861 |
|||
|
I5 |
.728 |
.860 |
|||
|
PEU |
PEU1 |
.711 |
.807 |
.854 |
|
|
PEU2 |
.716 |
.806 |
|||
|
PEU3 |
.652 |
.832 |
|||
|
PEU4 |
.706 |
.810 |
|||
|
PU |
PU1 |
.715 |
.864 |
.884 |
|
|
PU2 |
.705 |
.869 |
|||
|
PU3 |
.835 |
.817 |
|||
|
PU4 |
.743 |
.853 |
|||
|
SP |
SP1 |
.671 |
.834 |
.859 |
|
|
SP2 |
.700 |
.822 |
|||
|
SP3 |
.782 |
.789 |
|||
|
SP4 |
.666 |
.835 |
|||
|
PI |
PI1 |
.751 |
.864 |
.892 |
|
|
PI2 |
.790 |
.850 |
|||
|
PI3 |
.736 |
.870 |
|||
|
PI4 |
.782 |
.856 |
Note: I is Interactivity, PEU is Perceived Ease of Use, PU is Perceived Usefulness, SP is Social Presence, and PI is Purchase Intention.
Table 2. Structural validity analysis
|
Components |
|||||
|
1 |
2 |
3 |
4 |
5 |
|
|
I1 |
0.671 |
||||
|
I2 |
0.826 |
||||
|
I3 |
0.769 |
||||
|
I4 |
0.793 |
||||
|
I5 |
0.740 |
||||
|
PEU1 |
0.773 |
||||
|
PEU2 |
0.811 |
||||
|
PEU3 |
0.700 |
||||
|
PEU4 |
0.834 |
||||
|
PU1 |
0.739 |
||||
|
PU2 |
0.722 |
||||
|
PU3 |
0.810 |
||||
|
PU4 |
0.794 |
||||
|
SP1 |
0.729 |
||||
|
SP2 |
0.770 |
||||
|
SP3 |
0.838 |
||||
|
SP4 |
0.758 |
||||
|
PI1 |
0.725 |
||||
|
PI2 |
0.764 |
||||
|
PI3 |
0.739 |
||||
|
PI4 |
0.712 |
||||
|
total |
9.176 |
2.013 |
1.673 |
1.302 |
1.088 |
|
Cumulative % |
16.428 |
30.809 |
44.898 |
58.960 |
72.627 |
|
KOM |
0.929 |
||||
|
Bartlett’s Test |
2913.023 (p=0.000) |
||||
Note: I is Interactivity, PEU is Perceived Ease of Use, PU is Perceived Usefulness, SP is Social Presence, and PI is Purchase Intention.
Table 3. Model fit indices
|
Parameters |
CMIN/DF |
RMR |
GFI |
AGFI |
NFI |
TLI |
CFI |
RMSEA |
|
Estimated values |
1.183 |
0.038 |
0.919 |
0.896 |
0.930 |
0.986 |
0.988 |
0.028 |
|
Reference values |
<3 |
<0.05 |
>0.8 |
>0.8 |
>0.9 |
>0.9 |
>0.9 |
<3 |
In this study, the reliability and validity of the recovered samples were analyzed using SPSS24.0 software. Then, AMOS24.0 was used to construct a structural SEM to test the relationship between variables and verify the hypotheses. Finally, the reasons affecting the relationship between variables were revealed and the results were analyzed to find a scientific solution.
4.1 Reliability and validity
As shown in Table 1, the Cronbach's α coefficients under different dimensions were all above 0.8, indicating good dimensional reliability results. Among them, the correlations between the corrected terms of the question items and the total are all greater than 0.6, indicating that there is a correlation between the question items. Based on this analysis, it indicates that the reliability of the questionnaire is good.
As shown in Table 2, Different questionnaire items belonging to the same concept are clustered in the same common factor as predicted by the theory. The variance of the 6 common factors is all greater than 0.4, and the concepts are clearly delimited. Factor loads for all measured items were between 0.5 and 0.95, indicating that each measured variable could effectively reflect factor construction. To sum up, the questionnaire designed in this study has good structural validity.
As shown in Table 3, the Kaiser-Meyer Olkin measure is 0.929, which is already much greater than 0.7, and can prove that there is a strong correlation between the questions in the test; it can also be seen that the approximate chi-square value obtained by Bartlett's test is 2913.023, and the Bartlett's test significance sig<0.001, which rejects the original hypothesis. It indicates that it is suitable for factor extraction. In this study, factors with eigenvalues greater than 1 were extracted using Principal Component Analysis(PCA), 5 common factors were extracted, and the Cumulative rotated square sum was 72.627%, which was greater than 60%. After rotation by orthogonal rotational method, the 21 question options can be divided into 5 categories of factors, and the loading of each item is greater than 0.5, which indicates that each measured variable can effectively reflect the factor construction. Based on this analysis, it indicates that the questionnaire designed in this study has good structural validity.
As shown in Table 3, the ratio of chi-square values to degrees of freedom was 1.183, indicating a good model fit. GFI = 0.885, AGFI = 0.860, NFI = 0.888, TLI = 0.940, CFI = 0.946, and RMSEA = 0.051, indicating a good model fit. Based on this analysis, it indicates that all the indicators of the exploratory factor analysis in this study met the criteria and the overall model fit was good.
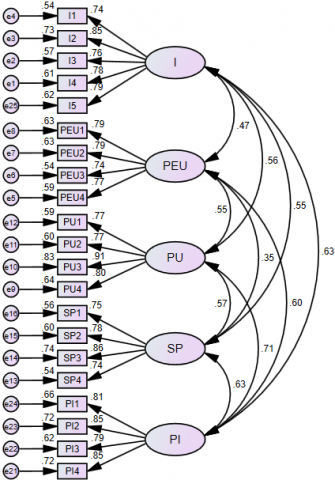
In order to further verify the rationality of dimensions, it is necessary to test the measurement model before evaluating and verifying the structural model in the SEM operation process, so as to ensure whether all items in the measurement model can accurately reflect the required factors. As shown in the Figure 2 below, All factor loads were greater than 0.6, and SMC was greater than 0.36
Figure 2. Validation factor analysis
Table 4. Results of validation factor analysis
|
Dimensions |
items |
Unstd. |
S.E. |
t-value |
P |
Std. |
SMC |
CR |
AVR |
|
I |
I1 |
1.000 |
.718 |
.516 |
.887 |
.613 |
|||
|
|
I2 |
1.116 |
.092 |
12.125 |
*** |
.866 |
.750 |
||
|
|
I3 |
1.028 |
.096 |
10.740 |
*** |
.758 |
.575 |
||
|
|
I4 |
1.066 |
.096 |
11.122 |
*** |
.786 |
.618 |
||
|
|
I5 |
1.108 |
.101 |
11.008 |
*** |
.778 |
.605 |
||
|
PEU |
PEU1 |
1.000 |
.786 |
.618 |
.854 |
.595 |
|||
|
|
PEU2 |
1.084 |
.092 |
11.776 |
*** |
.803 |
.645 |
||
|
|
PEU3 |
.864 |
.082 |
10.483 |
*** |
.713 |
.508 |
||
|
PEU4 |
.974 |
.085 |
11.503 |
*** |
.781 |
.610 |
|||
|
PU |
PU1 |
1.000 |
.761 |
.579 |
.887 |
.664 |
|||
|
|
PU2 |
1.072 |
.091 |
11.734 |
*** |
.764 |
.584 |
||
|
|
PU3 |
1.219 |
.087 |
14.000 |
*** |
.922 |
.850 |
||
|
|
PU4 |
1.012 |
.082 |
12.409 |
*** |
.802 |
.643 |
||
|
SP |
SP1 |
1.000 |
.734 |
.539 |
.861 |
.610 |
|||
|
|
SP2 |
1.049 |
.096 |
10.906 |
*** |
.768 |
.590 |
||
|
|
SP3 |
1.127 |
.094 |
12.031 |
*** |
.880 |
.774 |
||
|
|
SP4 |
.976 |
.094 |
10.420 |
*** |
.733 |
.537 |
||
|
PI |
PI1 |
1.000 |
.810 |
.656 |
.894 |
.678 |
|||
|
|
PI2 |
1.036 |
.073 |
14.214 |
*** |
.855 |
.731 |
||
|
|
PI3 |
.913 |
.071 |
12.832 |
*** |
.786 |
.618 |
||
|
|
PI4 |
1.194 |
.086 |
13.961 |
*** |
.841 |
.707 |
Note: I is interactivity, PEU is perceived ease of use, PU is perceived usefulness, and SP is social presence proximity. *** means P < 0.001
As shown in Table 4, the standardized factor loadings for each item in the questionnaire were greater than 0.6, indicating that the question item had good explanatory power for the dimension in which it was included. The component reliability (CR) was all greater than the criterion of 0.7, indicating that the items included in each dimension explained the latent variables well. The AVE values of each dimension were all greater than 0.5, p<0.001, which met the reference values for validity evaluation. Based on this analysis, it showed that the five latent variables had significant relationships with each measured question item, indicating that the scale had good convergent validity.
AVE is used to measure the convergent validity and discriminant validity of the latent variables, reflecting the changes in the latent variables due to errors and revealing the explanatory power of the questionnaire items on the variables [36]. The larger the AVE, the smaller the measurement error. As shown in Table 5, the AVE values of each dimension are greater than 0.5, and the square root of AVE is greater than the correlation coefficient between the dimensions, based on this analysis, it indicates that the scale has good discriminant validity.
Table 5. Discriminant validity analysis table
|
AVE |
PI |
SP |
PU |
PEU |
I |
|
|
PI |
.678 |
.823 |
||||
|
SP |
.610 |
.627 |
.781 |
|||
|
PU |
.664 |
.709 |
.566 |
.815 |
||
|
PEU |
.595 |
.597 |
.353 |
.546 |
.771 |
|
|
I |
.613 |
.629 |
.551 |
.560 |
.474 |
.783 |
Note: I is Interactivity, PEU is Perceived Ease of Use, PU is Perceived Usefulness, SP is Social Presence, and PI is Purchase Intention.
4.2 Structural equation
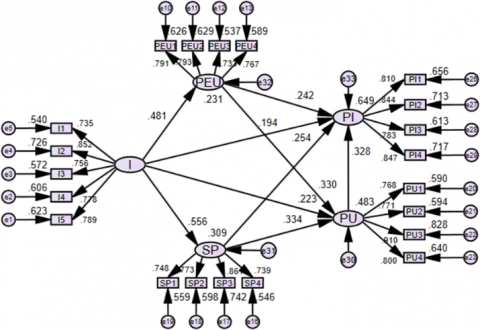
Based on the conceptual framework (Figure 1) with interactivity (I) as the independent variable, perceived ease of use (PEU), perceived usefulness (PU) and social presence (SP) as mediator, and purchase intention (PI) as the dependent variable, a structural equation model was developed using AMOS 24.0 software (Figure 3).
As shown in Table 6, if the p is less than 0.05, the hypothesis is valid; however, if it is greater than 0.05, the hypothesis is not supported. Interactivity has a significant positive effect on perceived ease of use, perceived usefulness, social presence, and purchase intention. Observing the path coefficients of each path, the path coefficient of interactivity to social presence reached 0.56, indicating that interactivity has a strong influence on social presence. In addition, on the influence of perceived usefulness, social presence is stronger than perceived ease of use and interactivity; perceived usefulness has the strongest influence on purchase intention, and social presence also has a strong influence on purchase intention.
Figure 3. Structural equation model
Table 6. Path coefficients between latent variables
|
Estimate |
S.E. |
C.R. |
P |
Std. |
Results |
|||
|
PEU |
<--- |
I |
0.432 |
0.069 |
6.235 |
*** |
0.481 |
Supported |
|
SP |
<--- |
I |
0.45 |
0.064 |
7.011 |
*** |
0.556 |
Supported |
|
PU |
<--- |
I |
0.186 |
0.07 |
2.665 |
0.008 |
0.223 |
Supported |
|
PU |
<--- |
PEU |
0.306 |
0.068 |
4.475 |
*** |
0.33 |
Supported |
|
PU |
<--- |
SP |
0.344 |
0.081 |
4.261 |
*** |
0.334 |
Supported |
|
PI |
<--- |
PU |
0.33 |
0.079 |
4.193 |
*** |
0.328 |
Supported |
|
PI |
<--- |
SP |
0.263 |
0.075 |
3.509 |
*** |
0.254 |
Supported |
|
PI |
<--- |
PEU |
0.227 |
0.064 |
3.535 |
*** |
0.242 |
Supported |
|
PI |
<--- |
I |
0.163 |
0.062 |
2.62 |
0.009 |
0.194 |
Supported |
Note: *** means p < 0.001
Table 7. Analysis of mediating effects
|
Parameter |
Estimate |
Bootstrapping |
|||||
|
Bias-corrected 95% CI |
Percentile 95% CI |
||||||
|
Lower |
Upper |
P |
Lower |
Upper |
P |
||
|
I-PEU-PI |
0.098 |
0.039 |
0.17 |
0.001 |
0.036 |
0.165 |
0.002 |
|
I-PU-PI |
0.061 |
0.016 |
0.138 |
0.004 |
0.011 |
0.127 |
0.009 |
|
I-SP-PI |
0.119 |
0.043 |
0.224 |
0.002 |
0.041 |
0.217 |
0.002 |
|
I-PEU-PU-PI |
0.044 |
0.019 |
0.087 |
*** |
0.017 |
0.082 |
*** |
|
I-SP-PU-PI |
0.051 |
0.021 |
0.101 |
*** |
0.02 |
0.097 |
*** |
Note: *** means p < 0.001
The mediating effects are shown in Table 7, and Bootstrapping test was adopted to test all mediating paths in the study model. In the analysis 5000 samples were repeated and 95% confidence intervals were designed. If the p is higher than 0.05, 0 is not included between the upper and lower intervals of the test results, which means that the mediation effect is significant. In addition to the three mediator variable of perceived ease of use, perceived usefulness, and social presence that hold, the chain mediating effects of interactivity in turn through perceived ease of use, perceived usefulness to purchase intention and interactivity in turn through social presence, perceived usefulness to purchase intention are both significant, suggesting that interactivity indirectly affects purchase intention.
The results of this study validate the impact of interactivity and expand the influence of systemic characteristic factors on behavioral intention, indicating that live streaming shopping with good interactivity gives consumers a very convenient and realistic feeling, which is conducive to increasing their purchase intentions. Similar to previous studies, Lee et al. [10] also found that high levels of interaction positively influenced consumer perceptions and that virtual shopping environments were more useful and easier to use. The mediating role of perceived ease of use and perceived usefulness was demonstrated. Both perceived ease of use and perceived usefulness have a significant positive effect on purchase intention. The effect of perceived usefulness on purchase intention is greater than that of perceived ease of use, which indicates that consumers pay more attention to the help that live streaming shopping brings to shopping than to ease of use.
This study explains the importance of intrinsic motivation in consumers' purchase intentions. The mediating role of social presence is demonstrated. Consumers' perceptions of shopping websites are no longer limited to time and cost savings, this can greatly influence consumers' willingness to purchase [23]. Even though live streaming shopping helps people experience better shopping and is easy to use, consumers' psychological experiences have a mediating role and may influence behavioral decisions. Consumers value the psychological experience of using live streaming shopping, and this should be noted when anchors and merchants are live.
The empirical study aimed to explore the external factors and mediating variables of purchase intention for live streaming shopping. This study demonstrates the importance of systemic characteristics and that consumer experience reflects consumer needs. Therefore, it is crucial to understand consumers' needs. This study instead focuses on this feature of live streaming shopping being highly interactive and expands on the external factors that influence purchase intention. The results show that interactivity has different degrees of positive effects on perceived usefulness, perceived ease of use, and social presence, and there is a correlation between social presence and perceived usefulness. Interactivity indirectly affects purchase intention through perceived ease of use, perceived usefulness, and social presence. Regarding intrinsic motivation, Shang et al. [37] introduced two intrinsic motivation variables in their TAM, cognitive attentiveness and popular involvement, and other introduced variables include subjective criteria, perceived behavioral control, and self-efficacy, among others [38, 39]. Capturing social presence is intended to extend the theoretical framework of TAM and has a stronger effect on purchase intention of consumption compared to other mediators.
The theoretical implications, this study integrated external factors into the TAM model and identified the main external factors. This study used social presence as a mediator of intrinsic motivation and extended TAM. In addition, the mediating effects of perceived usefulness, perceived ease of use, and social presence are verified, and the optimized TAM is more suitable for the current situation, which is conducive to extending the current research results in the field of e-commerce. The combing and analysis reveal that the influence of the features of live streaming shopping on consumers continues to exist in the field of live streaming shopping, forming a validation with previous scholars' studies. It also provides insights into the differences between the research findings and previous studies to help explore the continued exploration of the features of live streaming shopping in the area of consumer purchase intentions.
The practical implications, the study results provide valuable recommendations for anchors and live merchants. By considering social presence, they can identify better marketing methods to improve the effectiveness of live streaming. In addition, anchors and live merchants should pay more attention to the interactivity of live streaming and should consider how to bring convenient and effective shopping to consumers. In short, this study promotes TAM and helps anchors and merchants improve their marketing methods and enhance the effectiveness of live streaming.
This study also suffers from some limitations. First, for the selection of live streaming shopping features, which were chosen to have targeted interactivity, there may be more diggable points and research points on whether there will be other more special features of live streaming shopping purchases that can better explain current consumer behavior. In addition, this study did not consider the effects of consumption scenario and type of product purchased; product factors may influence consumers' use of specific interactive features, whereas situational factors may influence consumer experience value perception [40].
[1] Jiang, Z., Benbasat, I. (2004). Virtual product experience: Effects of visual and functional control of products on perceived diagnosticity and flow in electronic shopping. Journal of Management Information Systems, 21(3): 111-147. https://doi.org/10.1080/07421222.2004.11045817
[2] Wang, X.J., Wang, W., Sun, N.N. (2019). A study on the impact of e-commerce webcasting model on consumers' purchase intention based on the mediating role of cognition and emotion. Market Modernization, (15): 13-14.
[3] Kettanurak, V.N., Ramamurthy, K., Haseman, W.D. (2001). User attitude as a mediator of learning performance improvement in an interactive multimedia environment: An empirical investigation of the degree of interactivity and learning styles. International Journal of Human-Computer Studies, 54(4): 541-583. https://doi.org/10.1006/ijhc.2001.0457
[4] Zhou, Y.S., Tang, S.H., Xiao, J. (2014). Research on consumers' purchase intention on e-commerce livestreaming platforms-based on the perspective of social presence. Contemporary Economic Management, 43(1): 8.
[5] Cyr, D., Head, M., Ivanov, A. (2009). Perceived interactivity leading to e-loyalty: Development of a model for cognitive–affective user responses. International Journal of Human-Computer Studies, 67(10): 850-869. https://doi.org/10.1016/j.ijhcs.2009.07.004
[6] Islam, H., Jebarajakirthy, C., Shankar, A. (2021). An experimental based investigation into the effects of website interactivity on customer behavior in on-line purchase context. Journal of Strategic Marketing, 29(2): 117-140. https://doi.org/10.1080/0965254X.2019.1637923
[7] Cropanzano, R., Mitchell, M.S. (2005). Social exchange theory: An interdisciplinary review. Journal of management, 31(6): 874-900. https://doi.org/10.1177/0149206305279602
[8] Liu, S.N., Dong, H. (2011). Interpretation of virtual experience of online consumers based on two major psychological theories. Foreign Economics & Management, 33(2): 41-47.
[9] Zhao, H.X., Cai, Z.H., He, S. (2014). The relationship between online merchandise displaying, online interaction and impulsive buying based on virtual tactility. Chinese Journal of Management, 11(1): 133-141.
[10] Lee, H.H., Fiore, A.M., Kim, J. (2006). An experimental based investigation into the effects of website interactivity on customer behavior in on-line purchase context. International Journal of Retail & Distribution Management, 34(8): 621-644.
[11] Hassanein, K., Head, M. (2007). Manipulating perceived social presence through the web interface and its impact on attitude towards online shopping. International Journal of Human-Computer Studies, 65(8): 689-708. https://doi.org/10.1016/j.ijhcs.2006.11.018
[12] Xie, Y., Li, C.Q., Gao, P.L.Y. (2019). The effect and mechanism of social presence in live marketing on online herd consumption from behavioral and neurophysiological perspectives. Advances in Psychological Science, 27(6): 990-1004. https://doi.org/10.3724/SP.J.1042.2019.00990
[13] Feng, J., Lu, M. (2020). The empirical research on impulse buying intention of live marketing in mobile internet era. Soft Science, 34(12): 128-133.
[14] Ou, C.X., Pavlou, P.A., Davison, R.M. (2014). Swift guanxi in online marketplaces: The role of computer-mediated communication technologies. Mis Quarterly, 38(1): 209-230.
[15] Han, X.Y., Xu, Z.L. (2020). Impacts of e-commerce anchor Attributes on consumers' willingness to buy online: research based on the grounded theory. Foreign Economics & Management, 42(10): 62-75.
[16] Kotler, P., Armstrong, G. (2012). Principles of Marketing. In: New Jersey, USA: Prentice Hall Inc.
[17] Cyr, D., Hassanein, K., Head, M., Ivanov, A. (2007). The role of social presence in establishing loyalty in e-service environments. Interacting with Computers, 19(1): 43-56. https://doi.org/10.1016/j.intcom.2006.07.010
[18] Davis, F.D. (1989). Perceived usefulness, perceived ease of use, and user acceptance of information technology. MIS Quarterly, 13(3): 319-340. http://dx.doi.org/10.2307/249008
[19] Jiang, J.J., Hsu, M.K., Klein, G., Lin, B. (2000). E-commerce user behavior model: An empirical study. Human Systems Management, 19(4): 265-276. https://doi.org/10.3233/HSM-2000-19406
[20] Wei, N., Li, Z. (2021). Telepresence and interactivity in mobile learning system: Its relation with open innovation. Journal of Open Innovation: Technology, Market, and Complexity, 7(1): 78. https://doi.org/10.3390/joitmc7010078
[21] Parasuraman, A. (2000). Technology Readiness Index (TRI) a multiple-item scale to measure readiness to embrace new technologies. Journal of Service Research, 2(4): 307-320. https://doi.org/10.1177/109467050024001
[22] Massey, A.P., Khatri, V., Montoya-Weiss, M.M. (2007). Usability of online services: The role of technology readiness and context. Decision Sciences, 38(2): 277-308. https://doi.org/10.1111/j.1540-5915.2007.00159.x
[23] Shin, D.H., Shin, Y.J. (2011). Consumers' trust in virtual mall shopping: The role of social presence and perceived security. International Journal of Human-Computer Interaction, 27(5): 450-475. https://doi.org/10.1080/10447318.2011.552060
[24] Fan, X.J., Jiang, X.Y, Ni, R.R., Dong, X.B. (2020). Influence of interactivity of mobile live-video broadcast on intention of continuous use of users. Journal of Systems & Management, 29(2): 14. https://doi.org/10.3969/j.issn.1005-2542.2020.02.010
[25] Bi, J.D. (2009). On acceptance of internet word-of-mouth based on technology acceptance model. Contemporary Economic Management, 31(9): 6.
[26] Xiong, Y., Li, Y. (2008). Empirical study on e-business trust based on TAM. Journal of Beijing Technology and Business University: Social Science Edition, 23(5): 5.
[27] Gu, Q.L. (2014). A study on the relationship between website presence, consumer's trust and purchase intention in B2C environment. Soochow University.
[28] Le, A.N.H., Ho, H.X., Nguyen, D.P., Cheng, J.M.S. (2022). Dataset for cognition processes, motivations, spatial presence experience, and customer engagement in retail mobile apps. Data in Brief, 42: 108198. https://doi.org/10.1016/j.dib.2022.108198
[29] Vahdat, A., Alizadeh, A., Quach, S., Hamelin, N. (2020). Would you like to shop via mobile app technology? The technology acceptance model, social factors and purchase intention. Australasian Marketing Journal, 29(2): 187-197. https://doi.org/10.1016/j.ausmj.2020.01.002
[30] Algharabat, R., Rana, N.P., Dwivedi, Y.K., Alalwan, A.A., Qasem, Z. (2018). The effect of telepresence, social presence and involvement on consumer brand engagement: An empirical study of non-profit organizations. Journal of Retailing and Consumer Services, 40: 139-149. https://doi.org/10.1016/j.jretconser.2017.09.011
[31] Ventre, I., Kolbe, D. (2020). The impact of perceived usefulness of online reviews, trust and perceived risk on online purchase intention in emerging markets: A Mexican perspective. Journal of International Consumer Marketing, 32(4): 287-299. https://doi.org/10.1080/08961530.2020.1712293
[32] Battaglia, M.P. (2008). Nonprobability sampling. Encyclopedia of Survey Research Methods, 1: 523-526.
[33] VanDen Kerkhof, E.G., Parlow, J.L., Goldstein, D.H., Milne, B. (2004). In Canada, anesthesiologists are less likely to respond to an electronic, compared to a paper questionnaire. Canadian Journal of Anesthesia, 51(5): 449-454. https://doi.org/10.1007/BF03018307
[34] Li, H.Z. (2004). Management Research Methodology (2nd Edition).
[35] Steenkamp, J.B.E.M., Baumgartner, H. (2000). On the use of structural equation models for marketing modeling. Interntion Jounral of Research in Marketing, 17(2-3): 195-202. https://doi.org/10.1016/S0167-8116(00)00016-1
[36] Fornell, C., Larcker, D.F. (1981). Evaluating structural equation models with unobservable variables and measurement error. Journal of Marketing Research, 18(1): 39-50. https://doi.org/10.1177/002224378101800104
[37] Shang, R.A., Chen, Y.C., Shen, L. (2005). Extrinsic versus intrinsic motivations for consumers to shop on-line. Information Management, 42(3): 401-413. https://doi.org/10.1016/j.im.2004.01.009
[38] Mathieson, K., Peacock, E., Chin, W.W. (2001). Extending the technology acceptance model: the influence of perceived user resources. ACM SIGMIS Database: the DATABASE for Advances in Information Systems, 32(3): 86-112. https://doi.org/10.1145/506724.506730
[39] Taylor, S., Todd, P.A. (1995). Understanding information technology usage: A test of competing models. Information Systems Research, 6(2): 144-176. https://doi.org/10.1287/isre.6.2.144
[40] Holbrook, M.B., Schindler, R.M. (1994). Age, sex, and attitude toward the past as predictors of consumers’ aesthetic tastes for cultural products. Journal of Marketing Research, 31(3): 412-422. https://doi.org/10.1177/002224379403100309