Liyushiana | Robert Sibarani* | Agus Purwoko | Emrizal
© 2022 IIETA. This article is published by IIETA and is licensed under the CC BY 4.0 license (http://creativecommons.org/licenses/by/4.0/).
OPEN ACCESS
The COVID-19 pandemic is causing significant global changes, and one of the most affected sectors is the tourism industry. Therefore, this study aimed at determining the impacts of the pandemic on tourism by comparing the spatial economic classification before and during the pandemic using four analyses, namely the regional Klassen Typology, sector approach, the Location Quotient (LQ), and Shift-Share Analysis. The processed information is secondary data from the Central Statistical Agency of Karo Regency and North Sumatra Province, Indonesia. This area is one of the mainstay areas of the national economy and part of the Lake Toba Super Priority Destination. The obtained results showed that the tourism sector was classified among the fast-growing and uncompetitive sectors before the pandemic. However, during the crisis, it became a slow-growing and competitive sector.
spatial economy, tourism, Klassen typology, shift-share, location quotient
According to UNWTO, the pandemic significantly affected the tourism and hospitality industries, with a 73% decline in 2020 and -71% in 2021 [1]. A previous study stated that the decline was due to travel restrictions, border closure, and limitations on people's mobility [2-6]. Accordingly, the potential of each sector and its changes in the regional economy need to be assessed at the local level, specifically for tourism.
The tourism and hospitality industries contribute to economic development globally, nationally, and locally [7-9]. These industries are considered significant influencers to Gross Regional Income (GRDP), specifically those related to hotel investments, level, and duration of tourist visits in an area [10]. Unfortunately, these industries are not covered by any sector within the GRDP framework, hence, to interpret their contributions, the analysis is usually represented by the accommodation and food & beverage sectors [11, 12].
It is essential to closely analyze the changes in the economic structure at the local level before and during the pandemic because the dynamics of each region and spatial economic sector cannot be generalized [2, 13]. Therefore, this study discusses the impacts of the pandemic using a local approach at the regency level, which was selected due to the authority and priorities of regional autonomy.
Karo Regency, located in North Sumatra Province, Indonesia, was selected as the focus area of this study. This regency is part of the mainstay area designated by the President for the super-priority destination of Lake Toba, which positively affects regional GRDP in addition to the agricultural sector [14, 15]. Furthermore, the cool air, rich culture, and many tourist attractions in this regency are factors that attract international and domestic tourists [14, 16].
This study aims to compare the spatial economic and tourism classification of Karo Regency before and during COVID-19. It also aims to identify whether the tourism-related sectors and hospitality industry are in the top category and to analyze the industry's competitiveness.
Studies on spatial economics are usually conducted using the Klassen Typology partially, with either regional or sectorial needs. However, this study accommodates both factors to provide a more comprehensive picture of the existence of Karo Regency as a region and the tourism sector in it. Additional analysis of Location Quotient (LQ) and Shift-Share will confirm the advantages, acceleration of growth, and competitiveness of the tourism sector in the target area, which has long been known as a mainstay destination in North Sumatra, Indonesia.
This quantitative study was conducted using the analytical method consisting of the Klassen Typology, LQ, and Shift-Share Analysis. Secondary data were sourced from the Central Statistics Agency of North Sumatra Province and Karo Regency. Table 1 describes the summary of unit of analysis used to evaluate the data collected.
2.1 The Klassen typology analysis
The Klassen Typology analytical method is one of the techniques used to classify economic growth in regional sectors [17, 18]. In this study, the economic growth of all cities/regencies in North Sumatra was mapped using Klassen Typology, hence, the position of the Karo Regency can be known. In addition, economic sectors in the target areas were also mapped to see the typological classification. The Klassen Typology calculation in this study was done using SPSS by utilizing the ScatterDot feature. Table 2 explains the classification of the analytical method was observed for region-based approach, while Table 3 explains the classification of sector-based.
Table 1. Data analysis
|
Analysis |
Data |
Comparison |
|
Klassen Typology |
North Sumatra Regency/City GRDP (Based on Applicable Prices-2010) |
Before (2016 – 2019) and during (2020 - 2021) the pandemic |
|
GRDP of Business Fields in Karo Regency (Based on Applicable Prices-2010) |
Before (2016 – 2019) and during (2020 - 2021) the pandemic |
|
|
Shift-Share |
GRDP of Business Fields in Karo and North Sumatra Regencies (Based on Applicable Prices-2010) |
Before (2016 – 2019) and during (2020 - 2021) the pandemic |
|
Location Quotient (LQ) |
GRDP of Business Fields in Karo and North Sumatra Regencies (Based on Applicable Prices-2010) |
Before (2016 – 2019) and during (2020 - 2021) the pandemic |
Table 2. Region-based classification of Klassen typology
|
|
yi> y |
yi<y |
|
ri>r |
Developed and fast-growing region |
Fast growing region |
|
ri<r |
Developed but depressed region |
Relatively lagging region |
Explanation:
yi=Average contribution of Cities/Regencies in North Sumatra to GRDP
y=Average GRDP in North Sumatra Province
ri=Growth rate in Cities/Regencies in North Sumatra
r=Average GRDP growth rate in North Sumatra Province
Table 3. Classification of sector-based Klassen typology
|
|
yi>y |
yi<y |
|
ri>r |
The developed and fast-growing sector |
Fast growing sector |
|
ri<r |
Developed but depressed sector |
Relatively lagging sector |
Explanation:
yi=The average GRDP contribution of sector i in Karo Regency
y=Average GRDP in North Sumatra Province
ri=Sector i growth rate in Karo Regency
r=Average GRDP growth rate in North Sumatra Province
2.2 Location quotient (LQ)
LQ is used to determine a regional economy's leading sector or economic basis in the observed region [19]. In this study, the LQ function was employed to determine whether the tourism and hospitality sectors fall into the essential or non-basic category in Karo Regency [20]. The leading sector or the primary economic sector in a smaller area shows the magnitude of other economic sectors’ roles compared to similar sectors in a larger area like North Sumatra Province.
The LQ analysis model uses the following formula:
$L Q=(s 1: s) /(S 1: S)$ (1)
where, LQ=Location Quotient, s1=GRDP sector i in Karo Regency, s=Total GRDP in Karo Regency, S1=GRDP Sector i in North Sumatra Province, S=Total GRDP of North Sumatra Province.
The results of the LQ calculation will produce two criterias, namely:
LQ>1: means that the sector is a leading sector (base);
LQ≤1: means that the sector is not a leading sector (non-base).
2.3 Shift-share analysis
Shift share analysis was used to determine the changes in the regional economic sector [21]. These factors can be external, such as the development of national and international economic activities, or internal, such as the structure of the regional economy and the extraordinary potential of the associated region [20]. Furthermore, the Shift-Share method starts from the assumption that a region's economic growth or added value is influenced by three main interconnected components namely regional share (regional growth component), proportional shift, and regional competitiveness growth (Different Shift) [21-23].
The simple formula used to measure Shift-Share analysis is as follows:
$S S=R S+P S+D S$ (2)
where, SS=Shift-Share, changes in the GRDP of economic sectors in Karo Regency, RS=Regional Share, changes in the GRDP of the economic sector in Karo Regency due to the influence of regional economic growth in North Sumatra Province as a reference area, PS=Proportional Shift, changes in the GRDP of the economic sector in Karo Regency caused by the influence of the growth of the sector in North Sumatra Province as a reference area, DS=Differential Shift, which is the changes in the GRDP of the economic sectors in Karo Regency caused by the sector's competitive advantage in the observed area.
To calculate RS, PS and DS require a separate formula, then, the Shift-Share formula can be written as Eq. (3). From the results of the Shift-Share analysis, there will be two interpretations related to proportional shift and differential shift in the following Table 4:
Table 4. Interpretation of shift-share analysis
|
Result condition |
Interpretation |
|
PS<0 |
Slow sector |
|
PS>0 |
Fast Sector |
|
DS<0 |
Competitive |
|
DS>0 |
Not Competitive |
where, X..=total value of sector activity I, Xij=the value of sector i activity in Karo Regency, Xi=value of sector i activity in North Sumatra Province, t1=final year (2021), t0=early year (2016).
The findings in this study are divided into four parts as follows: 1. The results of the Klassen Typology analysis based on the Regencies/Cities in North Sumatra to examine the economic growth position of Karo Regency before and during the pandemic; 2. The analysis was based on the business field to examine the position of business sectors related to tourism and hospitality; 3. LQ analysis results, which was used to compare the advantages of these sectors with others before and during the pandemic; and 4. The results of the Shift-Share analysis to examine the growth rate of business fields in the observed area, including in the tourism and hospitality sectors.
3.1 Karo regency spatial economic classification based on Klassen typology
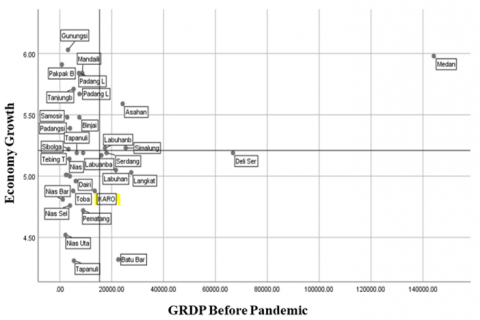
The results of the Klassen Typology classification for the economy of Karo Regency before the pandemic are shown in Figure 1. It can be seen that Karo Regency is in quadrant IV, which indicates that the level of economic growth and GRDP in the area is lower than that of North Sumatra Province.
Figure 1. Spatial economic growth before the pandemic
Figure 2. Spatial economic growth during the pandemic
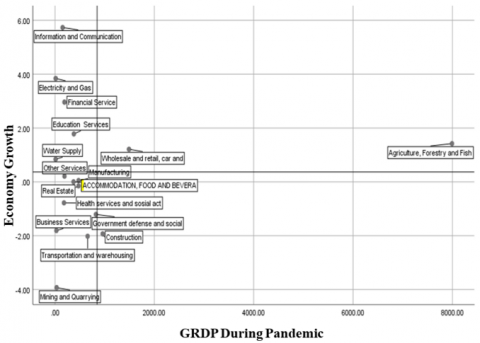
Furthermore, Figure 2 shows that Karo Regency was in quadrant IV during the pandemic. This means that there was no significant change in the economic growth level in the area both before and during the pandemic. In other words, the pandemic did not significantly affect the spatial economic growth pattern and structure in this regency. The analysis result also indicates that the observed area has a lower level of economic growth and per capita income than the average for North Sumatra.
Further information on GRDP and growth rate in Karo Regency was obtained from the average data of all Regencies/Cities in North Sumatra from 2016 to 2021, as shown in Figure 3.
Figure 3. The growth of karo regency and the average of north Sumatra for the 2016-2021 period
Figure 3 shows that the income and growth level of Karo Regency has been below the economic average of North Sumatra since 2016. However, the spatial economy increased in 2017 and significantly decreased in the following years. This data is in line with the findings related to the Klassen Typology theory which showed that the economic growth and per capita income in this regency are lagging or below the average for North Sumatra.
3.1 Classification of the tourism sector in karo regency with Klassen typology
Figure 4 shows that the growth of the spatial economic sector related to the tourism industry, which is represented by the accommodation and food & beverage, was in quadrant III before the pandemic. This implies that it is included in the developed and depressed sectors. These results illustrated that although this sector is relatively advanced, it recently experienced a decline in its growth rate.
Figure 4. Economic sector growth in karo regency before the pandemic
Figure 5 shows that the economic sector is in quadrant IV during the pandemic. This finding also confirmed how devastating the pandemic's impact was on Karo Regency's tourism sector. During the pandemic, several raids were conducted, hence, visitors from the surrounding area were not allowed to visit this region. This restriction became the main factor that influenced the decline of income in the accommodation, food, and beverage sectors, which is a representative of the tourism industry.
Figure 5. Economic sector growth in karo regency during the pandemic
3.2 Classification of the leading sector of karo regency with location quotient (LQ) analysis
The basic logic of LQ analysis is the economic base theory, which is used to produce goods and services for markets within and outside the associated region to generate income through sales. Furthermore, the flow of income from outside this area increases the consumption and investment rate, which raises income and creates new job opportunities. This income increase demand for primary and non-basic industries [23]. Table 4 shows the details of the pre-pandemic LQ analysis period in Karo Regency based on 2019 prices.
Table 4 illustrates that the accommodation and food & beverage industries were the leading sectors before the pandemic. Meanwhile, the analysis of the tourism industry during the pandemic is shown in the following table (Table 5). Table 5 shows that the accommodation and food & beverage provision sectors were included in the top category during the pandemic. This implies that both before and during the pandemic, these sectors thrived and were able to promote the growth of others.
Table 4. Pre-pandemic LQ analysis (Based on 2019 prices)
|
Business Field |
Karo Regency |
North Sumatra |
LQ |
Sector Category |
|
A Agriculture, Forestry, and Fisheries |
10964.8 |
164152.75 |
2.51 |
Leading Sector |
|
B Mining and Quarrying |
46.15 |
10160.53 |
0.17 |
Non Leading Sector |
|
C Processing Industry |
763.53 |
152246.63 |
0.19 |
Non Leading Sector |
|
D Electricity and Gas Procurement |
14.55 |
908.22 |
0.60 |
Non Leading Sector |
|
E Water Supply; Waste, Waste and Recycling Management |
17.43 |
796.7 |
0.82 |
Non Leading Sector |
|
F Construction |
1569.1 |
113764.69 |
0.52 |
Non Leading Sector |
|
G Wholesale and Retail Trade; Car and Motorcycle Repair |
2212.37 |
150445.28 |
0.55 |
Non Leading Sector |
|
H Transportation and Warehousing |
948.56 |
40566.53 |
0.88 |
Non Leading Sector |
|
I Provision of Accommodation and Food & Beverage |
540.5 |
19379.42 |
1.05 |
Leading Sector |
|
J Information and Communication |
156.34 |
17139.67 |
0.34 |
Non Leading Sector |
|
K Financial Services and Insurance |
284.02 |
23344.41 |
0.46 |
Non Leading Sector |
|
L Real Estate |
958.36 |
40942.91 |
0.88 |
Leading Sector |
|
M, N Company Services |
713.56 |
8667.23 |
3.10 |
Leading Sector |
|
O Government Administration, Defense, and Mandatory Social Security |
42.83 |
29505.6 |
0.05 |
Leading Sector |
|
P Education Services |
1254.02 |
14767.59 |
3.19 |
Non Leading Sector |
|
Q Health Services and Social Activities |
500.37 |
8155.28 |
2.31 |
Leading Sector |
|
R, S, T, U Other Services |
270.65 |
4665.51 |
2.18 |
Leading Sector |
|
TOTAL |
21257.14 |
799608.95 |
|
|
Table 5. During pandemic LQ analysis (Based on 2021 prices)
|
Business Field |
Karo Regency |
North Sumatra |
LQ |
Sector Category |
|
A Agriculture, Forestry, and Fisheries |
11779.76 |
189491.36 |
2.45 |
Leading Sector |
|
B Mining and Quarrying |
45.13 |
10710.15 |
0.17 |
Non Leading Sector |
|
C Processing Industry |
829.08 |
167886.09 |
0.19 |
Non Leading Sector |
|
D Electricity and Gas Procurement |
15.86 |
986.94 |
0.63 |
Non Leading Sector |
|
E Water Supply; Waste, Waste and Recycling Management |
17.96 |
870.54 |
0.81 |
Non Leading Sector |
|
F Construction |
1605.89 |
115754.38 |
0.55 |
Non Leading Sector |
|
G Wholesale and Retail Trade; Car and Motorcycle Repair |
2370.49 |
162578.56 |
0.57 |
Non Leading Sector |
|
H Transportation and Warehousing |
969.86 |
35869.85 |
1.07 |
Leading Sector |
|
I Provision of Accommodation and Food & Beverage |
546.07 |
17663.47 |
1.22 |
Leading Sector |
|
J Information and Communication |
181.03 |
20094.28 |
0.35 |
Non Leading Sector |
|
K Financial Services and Insurance |
313.91 |
25545.12 |
0.48 |
Non Leading Sector |
|
L Real Estate |
743.09 |
43912.94 |
0.67 |
Non Leading Sector |
|
M, N Company Services |
43.71 |
8847.57 |
0.19 |
Non Leading Sector |
|
O Government Administration, Defense, and Mandatory Social Security |
1259.39 |
30457.51 |
1.63 |
Leading Sector |
|
P Education Services |
530.66 |
16017.36 |
1.31 |
Leading Sector |
|
Q Health Services and Social Activities |
278.51 |
8499.17 |
1.29 |
Leading Sector |
|
R, S, T, U Other Services |
293.73 |
4685.66 |
2.47 |
Leading Sector |
|
TOTAL |
21824.13 |
859870.95 |
|
|
3.4 Competitiveness of tourism-related sectors in karo regency with shift-share analysis
Quantitative calculations were carried out for Shift-Share analysis to determine the changes that occurred in the regional economic structure relative to the higher administrative area as a comparison or reference. This analysis was conducted using three basic related information. The first is the provincial reference economic growth, which shows the influence of the higher region's economic growth on the observed region (Karo Regency).
The second is the proportional shift which illustrates the relative change in the performance of a sector in a particular area under local or national references. Proportional shifts, also known as industrial mix effects, are used to determine whether the regional economy is concentrated in industries that grow faster than those used as a reference.
The third is the differential shift, which provides the information used in determining the distance between the competitiveness of regional (local) industries with the economy used as a reference. The result showed that when an industry's differential shift is positive, it is relatively more competitive than the reference economy. The differential shift is also known as the competitive advantage effect.
Furthermore, the results of the Shift-Share analysis for Karo Regency both before and during the pandemic are shown in Table 6. The proportional shift component analysis showed that the accommodation and food & beverage sectors were in the fast growing categories before and during the pandemic.
Additionally, a differential shift analysis was performed to examine the changes in a particular sector/industry due to its improvement in a higher reference area. A region with higher growth in a sector indicates that the activity is competitive with a positive differential shift and vice versa. The differential shift component arises due to an increase or decrease in the value of production sectors in a region compared to others. When compared to other regions, this shift's fast or slow process is dependent on the region's comparative advantages, market access, as well as social and economic infrastructure.
Following this, the results of the differential shift analysis indicated that the accommodation and food & beverage sectors had no competition before the pandemic. These sectors, however, experienced this process during the pandemic from 2020 to 2021 due to faster shift growth. Lastly, based on the analysis of Klassen Typology, LQ, and Shift-Share above, it can be seen that tourism-related sectors play a major role in supporting economic activities such as the production of goods and services.
Table 6. Analysis of shift share in karo regency before and during the pandemic (2016-2019 and 2020-2021)
|
Business Field |
Before Pandemi (2016-2019) |
During Pandemi (2020-2021) |
||||||
|
RS |
PS |
DS |
SS |
RS |
PS |
DS |
SS |
|
|
A Agriculture, Forestry, and Fisheries |
27.72 |
-6.05 |
-2.59 |
19.08 |
5.99 |
3.49 |
-4.94 |
4.54 |
|
B Mining and Quarrying |
27.72 |
-7.82 |
-1.29 |
18.61 |
5.99 |
-2.74 |
0.26 |
3.51 |
|
C Processing Industry |
27.72 |
-6.42 |
13.98 |
35.27 |
5.99 |
1.28 |
-0.86 |
6.41 |
|
D Electricity and Gas Procurement |
27.72 |
8.07 |
-3.88 |
31.91 |
5.99 |
-0.13 |
-1.25 |
4.62 |
|
E Water Supply; Waste, Waste and Recycling Management |
27.72 |
-5.96 |
5.19 |
26.95 |
5.99 |
-1.25 |
-3.09 |
1.64 |
|
F Construction |
27.72 |
7.34 |
-3.49 |
31.57 |
5.99 |
-1.03 |
-1.93 |
3.03 |
|
G Wholesale and Retail Trade; Car and Motorcycle Repair |
27.72 |
6.99 |
-7.35 |
27.36 |
5.99 |
0.18 |
0.72 |
6.89 |
|
H Transportation and Warehousing |
27.72 |
-0.28 |
-4.98 |
22.45 |
5.99 |
-7.40 |
3.65 |
2.24 |
|
I Provision of Accommodation and Food & Beverage |
27.72 |
2.04 |
-5.40 |
24.37 |
5.99 |
-6.15 |
1.72 |
1.56 |
|
J Information and Communication |
27.72 |
12.83 |
-9.20 |
31.36 |
5.99 |
2.82 |
0.28 |
9.09 |
|
K Financial Services and Insurance |
27.72 |
-15.11 |
10.54 |
23.15 |
5.99 |
2.58 |
1.96 |
10.52 |
|
L Real Estate |
27.72 |
10.06 |
-9.13 |
28.65 |
5.99 |
-3.20 |
-1.49 |
1.30 |
|
M, N Company Services |
27.72 |
10.14 |
-9.24 |
28.62 |
5.99 |
-4.41 |
0.72 |
2.29 |
|
O Government Administration, Defense, and Mandatory Social Security |
27.72 |
0.85 |
1.58 |
30.14 |
5.99 |
-5.32 |
-2.54 |
-1.86 |
|
P Education Services |
27.72 |
-2.56 |
1.61 |
26.77 |
5.99 |
-2.14 |
0.08 |
3.93 |
|
Q Health Services and Social Activities |
27.72 |
9.15 |
-9.23 |
27.64 |
5.99 |
-4.40 |
-2.02 |
-0.43 |
|
R, S, T, U Other Services |
27.72 |
4.69 |
-7.31 |
25.10 |
5.99 |
-3.96 |
0.00 |
2.03 |
In conclusion, the descriptions presented in previous chapters indicated that Karo Regency's tourism sector supports economic activities. The detailed findings are explained in the following points:
Karo Regency was in quadrant IV or relatively lagging category, both before and during the pandemic, based on Klassen typology analysis using a regional approach.
Tourism-related sectors, such as the accommodation and food & beverages sectors, were classified in quadrant III before the pandemic, and this indicated that the sectors had the potentials to develop rapidly. However, from 2020 to 2021, during the pandemic, the position changed to quadrant IV.
The accommodation and food & beverage supply sectors are included in the leading category both before and during the pandemic.
The accommodation, food, and beverages sectors are classified among the fast growing category before the pandemic but became slow in growth during the crisis. Therefore, these tourism-related sectors are considered to lack and possess competitiveness before and during the crisis respectively.
This study is limited to the specified scope area, therefore, the findings cannot be generalized.
[1] UNWTO, “UNWTO Tourism Dashboard,” 2022. https://www.unwto.org/tourism-data/international-tourism-and-covid-19, accessed on May 31, 2022.
[2] Susilawati, S., Falefi, R., Purwoko, A. (2020). Impact of COVID-19’s pandemic on the economy of Indonesia. Budapest International Research and Critics Institute (BIRCI-Journal): Humanities and Social Sciences, 3(2): 1147-1156. https://doi.org/10.33258/birci.v3i2.954
[3] Saputra, F.E., Praningrum, Anggarawati, S. (2022). Will self-service technologies be widely adopted in travel, tourism, and hospitality industries during and after COVID-19? International Journal of Sustainable Development and Planning, 17(6): 1937-1942. https://doi.org/10.18280/ijsdp.170629
[4] Handoyo, E., Wijayanti, T., Ekaningsih, L., Puspita, M.A. (2022). Economy impact of the COVID-19 prevention policy on business continuity and welfare of street vendors. International Journal of Sustainable Development and Planning, 17(6): 1781-1788. https://doi.org/10.18280/ijsdp.170612
[5] Kolopaking, L.M., Wahyono, E., Irmayani, N.R., Habibullah, H., Erwinsyah, R.G. (2022). Re-adaptation of COVID-19 impact for sustainable improvement of Indonesian villages' social resilience in the digital era. International Journal of Sustainable Development and Planning, 17(7): 2131-2140. https://doi.org/10.18280/ijsdp.170713
[6] Abdullah, M.N.A. (2021). Revenge tourism: Trend or impact post-pandemic COVID-19? In Promoting Creative Tourism: Current Issues in Tourism Research, 623-627. https://doi.org/10.1201/9781003095484-89
[7] Maftuhah, D.I., Wirjodirdjo, B. (2018). Model for developing five key pillars of sustainable tourism: A literature review. In AIP Conference Proceedings, 1977(1): 040009. https://doi.org/10.1063/1.5042979
[8] Purwoko, A., Kuswanda, W., Situmorang, R.O.P., Hutapea, F.J., Saputra, M.H., Pasaribu, P.H.P. (2022). Orangutan ecotourism on Sumatra island: current conditions and a call for further development. Sustain., 14(18): 11328. https://doi.org/10.3390/su141811328
[9] Purwoko, A., Nurrochmat, D.R., Ekayani, M., Rijal, S., Garura, H.L. (2022). Examining the economic value of tourism and visitor preferences: A portrait of sustainability ecotourism in the Tangkahan protection area, Gunung Leuser National Park, North Sumatra, Indonesia. Sustain., 14(14): 8272. https://doi.org/10.3390/su14148272
[10] Purwanta, I.K.S.D., Dewi, M.H.U. (2019). The effect of number of tourists and general bank credits on hotel room offers, women workers and growth of tourism sector in the province of Bali. Russ. J. Agric. Socio-Economic Sci., 94(10): 209-219. https://doi.org/10.18551/rjoas.2019-10.28
[11] Hakim, M.A.A., Suryantoro, A., Rahardjo, M. (2021). Analysis of the influence of tourism growth on economic growth and human development index in west java province 2012-2018. Budapest International Research and Critics Institute-Journal (BIRCI-Journal), 4(1): 160-169. https://doi.org/10.33258/birci.v4i1.1561
[12] Zulvianti, N., Aimon, H., Abror, A. (2022). The influence of environmental and non-environmental factors on tourist satisfaction in Halal tourism destinations in West Sumatra, Indonesia. Sustain., 14(15): 9185. https://doi.org/10.3390/su14159185
[13] Lubis, S.N., Jufri, M., Ulfa, N. (2021). Analysis of income of motorboat workers with a 5 GT capacity on the east and west coast, Sumatra Utara. Indones. J. Agric. Res., 4(1): 31-38. https://doi.org/10.32734/injar.v4i1.4867
[14] Ginting, N., Rahman, V.N., Nasution, A.D., Dewi, N.A. (2021). Geotourism development through the public facilities in Geotrail Bakkara, Toba caldera geopark. Geoj. Tour. Geosites, 37(3): 914-920. https://doi.org/10.30892/gtg.37324-726
[15] Izwar, I., Badaruddin, B., Mulya, M.B., Sibarani, R. (2020). Potential of Reusam Island to become sharia ecotourism area. Geoj. Tour. Geosites, 30(2): 827-834. https://doi.org/10.30892/gtg.302spl07-511
[16] Ginting, N., Rahman, V., Nasution, A. (2019). Aspects of self-esteem in the tourism development in Karo regency, north Sumatera, Indonesia. J. Urban Reg. Anal., 11(2). https://doi.org/10.37043/JURA.2019.11.2.4
[17] Katti, S., Pratiwi, D., Setiahadi, R. (2019). Klassen typology approach for analysis of the role of competitiveness agricultural sector. IOP Conf. Ser. Earth Environ. Sci., 347(1): 012106. https://doi.org/10.1088/1755-1315/347/1/012106
[18] Siradjuddin, H., Anshar, M., Asman, A.I. (2021). Implementation of klassen typology in mapping of superior commodities of food crops in the Malolo Agropolitan area. IOP Conf. Ser. Earth Environ. Sci., 887(1): 1-10. https://doi.org/10.1088/1755-1315/887/1/012024
[19] Billings, S.B., Johnson, E.B. (2012). The location quotient as an estimator of industrial concentration. Reg. Sci. Urban Econ., 42(4): 642-647. https://doi.org/10.1016/j.regsciurbeco.2012.03.003
[20] Shi, H., Li, X., Yang, Z.Z., Li, T.H., Ren, Y., Liu, T.T., Yang, N.D., Zhang, H., Chen, G.Z., Liang, X. (2020). Tourism land use simulation for regional tourism planning using POIs and cellular automata. Trans. GIS, 24(4): 1119-1138. https://doi.org/10.1111/tgis.12626
[21] Knudsen, D.C. (2000). Shift-share analysis: further examination of models for the description of economic change. Socio-Economic Planning Sciences, 34(3): 177-198. https://doi.org/10.1016/S0038-0121(99)00016-6
[22] Satrianto, A., Sasongko, B. (2019). Determination of the same leading sectors in Blitar city. JEJAK, 12(2): 382-402. https://doi.org/10.15294/jejak.v12i2.22616
[23] Rahman, H., Ashik, F.R., Hasan, N., Islam, I., Haque, A. (2020). A long run analysis of regional economic structure of selected districts using shift share method. An Annu. Publ. URP Students’ Assoc. BUET, no. January, pp. 978-984. https://doi.org/10.13140/RG.2.2.18787.09763/1