Anis Ali
© 2022 IIETA. This article is published by IIETA and is licensed under the CC BY 4.0 license (http://creativecommons.org/licenses/by/4.0/).
OPEN ACCESS
The banking sector plays a vital role in the growth and development of the economy of any nation. Nowadays, NPAs are great challenges for banks and harm profitability, and financial soundness, and hinder the operational activities of the banks. The Non-Performing Assets (NPAs) refer to the loans and advances of which payment of interest or principal amount is delayed, or missed as per the bank’s schedule. The purpose of the study is to find out the comparative financial soundness of the leading Indian public and private banks to get the hedging factors against the NPAs. Possibly, the hedging factors against the NPAs will be helpful to control and reduce the level of NPAs in Indian banks. Financial ratios are the base to measure financial soundness. The graphical presentation and ANOVA (Analysis of Variance) were applied to get the comparative growth trend and disparity among the financial soundness measures of the leading Indian private and public sector banks. The analysis reveals that there is a significant difference in the financial soundness of leading Indian private and public sector banks. The NIM (net interest margin) of leading Indian public sectors is significantly different and the public banks with higher NIM utilize their profitability to write off their NPAs. Based on the study is advised to enhance the CASA (current account and saving account to total deposits) for hedging against NPAs and the profitability in public sector banks.
financial soundness, Indian banks, NPAs, capital adequacy ratio, public and private banks, ANOVA
Nowadays, banks play a vital role in the development of business and trade and contribute to the growth of the economy. Banks provide funds to establish new business entities as well as liquidity to run operational activities. Apart from satisfying the business needs of funds, banks also provide funds for consumption purposes. Banks’ loans and advances to the business to establish and nurture manufacturing and service organizations of the nation. Ultimately, manufacturing and service organizations provide goods and services in the nation and enhance the economy. Consumption loans comprise loans for houses, vehicles, education, household items, etc. So, loans by banks or any financial institutions can be categorized into two categories i.e. productive and consumption purpose loans. Banks manage the loans and advances from their funds, various types of deposits from the public, or loans from other banks or financial institutions. Banks have to pay a fair return or contractual rate of return on the deposits or loans from others and repay the principal amount as per the depositors or banks or other financial institutions. If the banks get the return or interest and repayment of the principal amount of loans and advances as per the schedule of the loan. There will not be a financial crisis for the bank and the bank will pay its debts and interest thereof duly. However, this ideal situation of lending and receiving the regular income and principal amount does not exist. Sometimes, banks’ inappropriate loan sanctioning policies and strategies, poor physical verification, and supervision of loans and advance accounts enhance the possibility of not receiving the regular income or interest or no repayment of the principal amount. In addition, failure of the business due to internal and external factors, or loss of expected income and profit by the individuals enhances the probability of the non-repayment of their loans and advances. The non-performing assets (NPAs) refer to the loans and advances of the banks of which payment of interest or principal amount is delayed, or missed as per the bank’s schedule. As per the delay, or missed in the payment of the principal amount and interest thereof, the NPA can be classified among three categories i.e. standard assets, sub-standard assets, doubtful assets, and loss assets. Standard assets are loans and advances of the banks of which no problems of repayment of the principal and interest thereof. Sub-standard assets are assets of which repayment is not made less or equal to twelve months. Doubtful assets are assets of which repayment is not made for more than twelve months. Loss assets are those assets, which is identified by the bank, inspector, or auditor as non-repayment of principal and interest is not possible and needs to be entirely written off. Net NPAs in Indian banks are considered as the excess of gross NPAs over the provisions for NPAs while gross NPAs are the Sum of all loan assets not repaid by the borrowers within 90 days’ period. Net Advances refer to the excess of gross advances over the provisions for NPA accounts as per asset classification in Indian banks. While gross advances include Standard advances and Gross NPAs. NIM (net interest margin), net income, interest income, and interest expenses define the profits and profitability of the banks. Loans, securities, and reserves are the forms of the total assets while capital comprises equity capital, ordinary share capital, intangible assets, audited revenue reserves (Tier I capital) and unaudited retained earnings, unaudited reserves, and general loss reserves (Tier II capital) in Indian banks. In the banking industry, the problem of NPAs is crucial for the smooth operation of banking activities. As per the records of the World Bank, the NPAs in Indian banks are on an increasing trend.
Originating Source: https://databank.worldbank.org/reports.aspx?source=2&series=FB.AST.NPER.ZS&country=IND
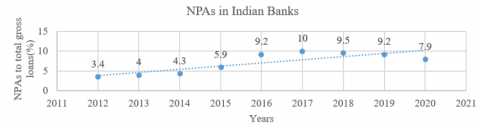
Figure 1. Growth trend of NPAs in Indian banks
Originating Source: https://rbidocs.rbi.org.in/rdocs/Publications/PDFs/55T_1509202206BBE107A9E947A8BCF3C488D0922404.PDF
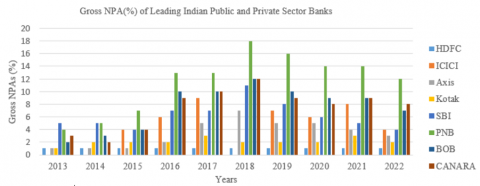
Figure 2. Growth trend of GNPAs and NNPAs in Indian public and private sector banks
Overall, there is upward trend of NPAs in Indian banks (Figure 1) from 2012 to 2020. There is growth of NPAs from the 2012 to 2017 while decline starts form 2018. Possibly, the reasons for the enhancements of NPAs in Indian banks are ineffective credit appraisal systems, poor recovery of the loans and advances, regulatory and legal systems, and poor loan management as explored by the numerous studies on Indian banks' NPAs.
Figure 2 explains that there is a difference between the GNPAs and NNPAs of public sector banks and private sector banks in India. The GNPAs and the NNPAs were at their highest level in 2018 and starts to decline after that. Most of the previous available studies in the context of NPAs of Indian banks reveal that there are significant differences among the GNPAs and NNPAs and the NPAs of public sector banks are higher than the private sector banks [1]. Some of the studies found that the NPAs are in a declining trend [2] and NPAs of the public banks are higher due to the compulsory lending to the priority sector [3]. Most of the studies are silent to explain hedging or managing the NPAs in Indian banks. There are two ways of dealing with the NPAs i.e. control or reduction of NPAs and hedging or provisioning against the NPAs. Control or reduction of the NPAs depends on the strategies and policies of loan sanction and physical verification, supervision of the loans, and advances of the banks. Hedging or provision against the NPAs is the way to safeguard the banks from the vicious shocks of the NPAs. The study considers the NPAs in the leading Indian public and private sector banks to analyze the comparative financial soundness Also, there is a need to identify disparities in the profitability and financial soundness of Indian banks. In addition, the study focuses to get measures of financial soundness or the factors that play a vital role in hedging against the NPAs to minimize the effect of NPAs on the profit earning capacity and operational activities of the banks.
The CAR (capital adequacy ratio) is the technique to measure the financial soundness of a bank [4]. While, NPA affects the profit earning capacity of the banks. Public sector banks' NPAs are higher than those of private sector banks, and effective control of the NPAs enhances profitability [5]. The net NPAs, NIM (net interest margin), and profit per employee positively correlated with the profitability of the Indian banks [6]. The Net NPAs in public sector banks are higher than in the private sector banks of India. The private sector banks' loans sanctioning policies and procedures are better than the public banks, comparatively. The public sector banks have to take the necessary and strict actions to reduce the NPAs [7]. There is decay in the assets quality of the public sector banks in India. In addition, there is an increment in the NPAs and decrement in the profitability in the post-GER (global economic recession). In the past years NPAs, operational efficiency of the banks, CAR, the growth rate of the Indian economy, and interest rate margin is the major factor that affects the NPAs in public sector banks [8]. The high NIM, optimum proportion of long-term and short-term loans, and bank’s asset-liability policy enhance the NPAs soundness of the banks [9]. The NPAs are the financial indicators of the banks and govern the profit earning capacity of the banks. The operational performance of the public sector Indian banks is better than the private sector banks [10]. There is enhancing the NPAs problem in the public sector banks in India. The strong and strict credit approval process and change in the loan review mechanism as per the Basel III advanced internal rating approach are necessary to reduce or control the NPAs in the banks [11]. The large number of NPAs accounts affects the profitability and liquidity of the banks. The NPAs affect the economy on a larger scale. In Indian banks, NPAs are higher due to poor performance of industry and trade. The poor industry and trade performance directly enhances the NPAs level in Indian banks [12]. There is proper attention necessary to reduce the NPAs in the Indian banks. Contrarily, it is found that GNPAs and NNPAs do not affect the financial performance of private banks [13]. There is a negative relationship between the intermediation cost ratio, ROA, and NPAs [14]. The increasing loan failure enhances the NPAs in Indian Banks. The NPAs of the banks adversely affect the profitability of the banks. There is a need to lower the NPAs to improve the profitability of the banks [15]. The NPAs of the public sector banks is the higher than the private sector banks, and foreign banks. In private sector banks, NPAs are lower due to the high accountability of the employees, and high working efficiency in the loan sanctioning process. The modification of the model of lending in public banks is essential to lower the NPAs in public sector banks [16]. The NPAs negatively affected the performance of the private and public banks in India. However, the impact of the NPAs on the financial performance of public banks is more than that of private banks [17-19]. There is a need to take some legal measures to recover the loans. Banks should make some provisions out of the current year’s profit to face the expected NPAs. In India, private sector banks are better than public sector banks in the context of NPAs [20]. The NPAs are serious issues in the banking sector. There is an upward trend of NPAs in Indian banks. The private banks manage their NPAs more effectively than the public sector banks. The financial performance of the public sector banks is better than the private sector banks, comparatively. However, the NPAs in public sector banks are higher due to the compulsory government lending to the priority sectors of the economy [21, 22]. There are significant differences among the CAR, D/E ratio, GNPAs, ROA, liquidity assets to total assets ratio, and total advances to total deposit ratio. The performance of the private sector banks is better than the public sector banks [23]. Also, there is insignificant difference in NNPAs to NAR (net advance ratio) between the private sector and public sector banks in India [24]. The pre-global economic recession NPAs in the Indian banks were higher than the post-global economic recession. The negative growth rate was seen after the global economic recession period in India [25]. It is obvious from the above studies that most of the studies explore the impact of the NPAs on the profitability of the banks or comparative impact of the NPAs on public and private sector banks. In addition, there is need to study to explain the factor that can help hedge against the NPAs and maintain financial soundness and enhance the profit earning capacity of the banks.
The study is based upon the secondary data obtained from the websites of the leading Indian banks from 2013 to 2022. HDFC (Housing Development Finance Corporation), ICICI (Industrial Credit and Investment Corporation of India), Axis (Axis Bank Limited), Kotak (Kotak Mahindra Bank Limited), SBI (State Bank of India), PNB (Punjab National Bank of India), BOB (Bank of Baroda), and Canara (Canara Bank) banks considered for the financial soundness disparity of the leading Indian banks. HDFC, ICICI, Axis, and Kotak banks belong to the private sector while SBI, PNB, BOB, AND Canara banks are the leading banks from the public sector. The Financial soundness ratios or measures i.e. GNPAs (Gross Non-Performing Assets), NNPAs (Net Non-Performing Assets), CAR (Capital Adequacy Ratio), CASA (Current and savings account total deposits) ratio, NIM (Net Interest Margin) and ROA (Return on Assets) ratio applied to get the financial soundness of the leading Indian banks (Table 1).
1. Gross NPAs $(\%)=\frac{\text { Gross NPA }}{\text { Gross Advances }} 100$
2. Net NPAs $(\%)=\frac{\text { Net NPA }}{\text { Net Advances }} 100$
3. CAR (%) $=\frac{\text { Banks Capital }}{\text { Risk weighted assets }} 100$
4. CASA $(\%)=\frac{\text { CA+SA }}{\text { Total Deposits }} 100$
5. $\operatorname{NIM}$ (times) $=\frac{\text { (Interest Income-Interest Expenses) }}{\text { Average Earning assets }}$
6. $\operatorname{ROA}(\%)=\frac{\text { Net Income }}{\text { Total assets }} 100$
where,
Table 1. Variables in Banks’ financial statements
|
No. |
Variables |
Explanation |
|
1 |
Gross NPAs |
Sum of the all loans assets not repaid by the borrowers within 90 days period |
|
2 |
Net NPAs |
Gross NPAs – provisions for NPAs |
|
3 |
Gross Advances |
Standard advances and Gross NPAs |
|
4 |
Net Advances |
Gross advances -Provisions for NPA accounts as per asset classification |
|
5 |
Banks Capital |
Tier I capital (equity capital, ordinary share capital, intangible assets, and audited revenue reserves) + Tier II capital (unaudited retained earnings, unaudited reserves, and general loss reserves) |
|
6 |
Risk-weighted Assets |
Amount of capital that must be held by banks to reduce the risk of insolvency |
|
7 |
CA+SA |
Current Account Deposits and Saving Account Deposits |
|
8 |
Total Deposits |
Total deposits of the bank including CA & SB |
|
9 |
NIM |
Net Interest Margin |
|
10 |
Interest Income |
Interest received on loans and advances |
|
11 |
Interest Expenses |
Interest paid on loans or advances |
|
12 |
Average Earning Assets |
stocks, bonds, rental income, certificates of deposit (CDs), and other interest or dividend -earning accounts or instruments. |
|
13 |
Net Income |
Income after all expenses and tax |
|
14 |
Banks’ Total Assets |
Loans, securities, and reserves |
A Clustered column chart is prepared to get the graphical visualization of the data to get inferences. A Clustered column chart is used to compare the values of some categories while the order of the categories is not important. ANOVA (Analysis of Variance) was applied to get the mean performance difference among the financial soundness of leading Indian banks. In addition, ANOVA applied to get the disparity in public sector and Private Sector Indian banks [26].
$\mathrm{F}=\frac{\mathrm{Bss} / \mathrm{df} 1}{\text { Wss } / \mathrm{df} 2} ;$ While, $\mathrm{F} \geq \mathrm{F} \propto$, Reject $\mathrm{H} 0$;
where, F is Fisher's ratio, Bss/df1, and Wss/df2 are the sum of squares between samples divided by degrees of freedom.
To fulfill the objectives of the research, analysis of financial soundness measures can be divided into two categories i.e. Historical Analysis, and Disparity Analysis.
4.1 Historical analysis
Historical analysis of the financial soundness of Indian banks consists of comparative trends, and growth analysis of the financial soundness measures over a period of time.
4.1.1 Growth trend of GNPAs ratio of leading Indian Banks
The Gross Non-Performing Assets ratio is the ratio between the Gross non-performing assets and total advances. This ratio indicates the gross proportion of the debts not recoverable in the context of the total advances of banks.
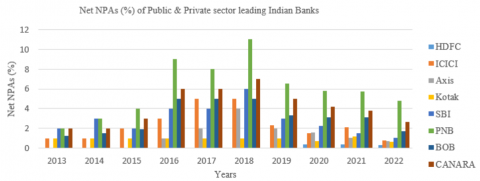
From Figure 3, it can be explained that there is a growth in the GNPAs of the leading Indian banks from 2013 to 2018. There is a decline in the GNPAs of the leading Indian banks from 2019 to 2022. The GNPAs of the leading Indian banks were at the highest level in 2018 except for ICICI. The GNPAs of the leading public sector banks were higher than the leading private sector banks. In Indian leading banks, the highest GNPAs are from the PNB (public bank) while the lowest GNPAs are from the HDFC (private bank) bank.
Source: Based on the GNPAs ratio of leading Indian banks (appendix 1)
Figure 3. Growth trend of the GNPA of leading Indian banks
Table 2. Average GNPAs of Indian banks from 2013 to 2018 and from 2019 to 2022
|
Mean |
HDFC |
ICICI |
Axis |
Kotak |
SBI |
PNB |
BOB |
CANARA |
|
2013-18 |
1 |
3.17 |
2.83 |
2 |
6.5 |
10 |
6.83 |
6.67 |
|
2019-22 |
1 |
6.25 |
4.25 |
2.25 |
5.75 |
14 |
8.75 |
8.5 |
|
+/- |
0 |
3.08 |
1.42 |
0.25 |
-0.75 |
4.00 |
1.92 |
1.83 |
|
+/- (%) |
0 |
97.37 |
50.00 |
12.50 |
-11.54 |
40.00 |
28.05 |
27.50 |
Source: Based on the GNPAs ratio of leading Indian banks (appendix 1)
Source: Based on the NNPAs ratio of leading Indian banks (as given in appendix 2)
Figure 4. Growth trend of the NNPA of leading Indian banks
Table 2 explains the increment in the average GNPAs of Indian banks from 2013-18 to 2019-2022. It is astonishing that the GNPAs of the ICICI and Axis banks increased by 3.08% (+97.37%) and 1.42%(+50%) as both banks are not from the private sector banks. Overall, the average GNPAs of Indian banks are higher in 2019-2022 than in 2013-18. There is a need to more focus on the control and reduction of the GNPAs. The probable reason for enhanced GNPAs is liberal policies of loan approval to attain more and more business or poor recovery due to the global epidemic.
4.1.2 Growth trend of NNPA ratio of leading Indian Banks
NNPAs are the amount obtained by subtracting the amount of the provision made by the bank from GNPAs of the bank. NNPA ratio is the ratio of the NNPAs to net advances. This ratio indicates the net proportion of the debts not recoverable in the context of the net advances of banks.
From above Figure 4, it can be explained that there is a growth in the NNPAs of the leading Indian banks from 2013 to 2018. There is a decline in the NNPAs of the leading Indian banks from 2019 to 2022. The NNPAs of the leading Indian banks were at the highest level in 2018. The NNPAs of the leading public sector banks were higher than the leading private banks. In Indian leading banks, the highest NNPAs are from the PNB (public bank) while the lowest NNPAs are from the HDFC (private bank) bank. The excess of GNPAs over the provision for the NPAs was at its apex level in 2018 in the context of net advances of the banks.
Table 3 reveals the average increment in the NNPAs of the Indian banks from 2013-18 to 2019-2022 except ICICI, Kotak, and SBI banks decreased NNPAs by 0.05% (-2.17%), 0.09% (-8.80%), and 0.25(-8.33%). There is an increment in the public sector banks NNPAs except for SBI while negligible decrement in private sector banks (ICICI and Kotak). There is an exceptionally absolute higher increment and decrement in Axis (private sector bank) and PNB (public sector bank). This refers to the higher rate of provisions against the NPAs in the private banks and Indian public sector banks focusing on controlling on NNPAs as their relational increment is either negative or lower than the Indian private sector banks.
4.1.3 Growth trend of CAR (capital adequacy ratio) of leading Indian Banks
The capital adequacy ratio is the ratio of a bank’s available capital to risk-weighted assets. The risk-weighted assets consider the market risk, operational risk, and account credit risk. The purpose of maintaining the capital in the context of the risk-weighted assets is to safeguard from the amount of the losses before becoming solvent. CAR also safeguards form the liquidity risk. The higher CAR is to be considered favorable for the financial soundness of the bank to pay out its current liabilities.
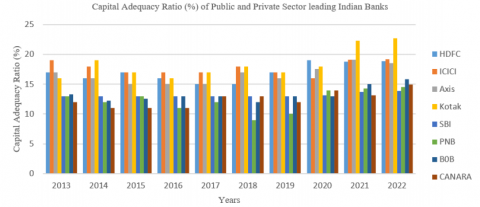
From Figure 5, it can be explained that there is a slight decline in the CAR of the leading Indian banks from 2013 to 2018. There is a slight increment in the CAR of leading Indian banks from 2019 to 2022. The CAR of the leading Indian banks was at the lowest level in 2018. The CAR of the leading public sector banks was lower than the leading private sector banks. In Indian leading banks, the highest CAR is from the Kotak (private sector bank) while the lowest CAR is from the PNB (Public sector bank) bank. The banks’ capital was higher in the leading Indian private banks compared to leading public sector banks in the context of Risk-weighted Assets from 2013 to 2022.
Table 4 explains the absolute increment in the CAR ratio of leading Indian public and private sector banks from 2013-18 to 2019-2022. Growth in the CAR ratio of the leading private Indian banks is higher than the Indian public banks except for ICICI (0.15%) and SBI (0.43%). The higher CAR ratio in the private sector banks assures liquidity after the shocks of the NPAs. The relational growth of the CAR ratio indicates that the Indian private sector banks are much more concerned about NPAs management than the Indian public sector banks.
Table 3. Average NNPAs of Indian banks from 2013 to 2018 and from 2019 to 2022
|
Mean |
HDFC |
ICICI |
Axis |
Kotak |
SBI |
PNB |
BOB |
CANARA |
|
2013-19 |
0.00 |
2.40 |
0.60 |
1.00 |
3.00 |
5.20 |
2.94 |
3.80 |
|
2019-22 |
0.22 |
2.35 |
1.87 |
0.91 |
2.75 |
6.77 |
3.25 |
4.54 |
|
+/- |
0.22 |
-0.05 |
1.27 |
-0.09 |
-0.25 |
1.57 |
0.32 |
0.74 |
|
+/- (%) |
100 |
-2.17 |
211.33 |
-8.80 |
-8.33 |
30.27 |
10.76 |
19.42 |
Source: Based on the NNPAs ratio of leading Indian banks (as given in appendix 2)
Source: Based on the CAR of leading Indian banks (as given in appendix 3)
Figure 5. Growth trend of the CAR of leading Indian banks
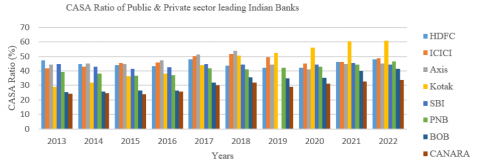
4.1.4 Growth trend of CASA (current account & saving account to total deposits) ratio of leading Indian Banks
CASA ratio establishes the relationship between the current account and saving account deposits to total deposits of the bank. The higher CASA ratio is to be considered favorable for the bank. The higher CASA ratio indicates a higher proportion of the saving account deposits and current account deposits to total deposits. The saving account deposits and current account deposits are the lower cost of funds available for lending by the bank.
From the above Figure 6, it can be explained that there is a slight increment in the CASA of leading Indian banks from 2013 to 2018. There is a slight decrement in the CASA of leading Indian banks from 2019 to 2022. The CASA of the leading Indian banks was at the lowest level in 2014 and 2015. The CASA of the leading public banks was lower than the leading private banks. In Indian leading banks, the highest CASA is from the Kotak (private sector bank) while the lowest CASA is from the Canara (Public sector bank) bank. The CASA ratio of the SBI was negligible (zero) in 2019, exceptionally. There is progressive growth seen in the Current account deposits and saving bank account compared to total deposits of Kotak bank.
Table 5 explains that the CASA ratio is higher in the Indian private sector banks compared to the Indian public sector banks. But, there is an increment in the public sector banks is more than the Indian private sector banks except for SBI and Kotak by -9.92% ( -22.84%), and 19.07% (49.69%). The higher CASA ratio of Indian private banks indicates the availability of a lower cost of capital for loans and advances. So, the CASA ratio is unaffected by the GNPAs and NNPAs in Indian banks.
Table 4. Average CAR of Indian banks from 2013 to 2018 and from 2019 to 2022
|
Mean |
HDFC |
ICICI |
Axis |
Kotak |
SBI |
PNB |
BOB |
CANARA |
|
2013-19 |
16.00 |
17.67 |
15.83 |
17.17 |
13.00 |
11.67 |
12.70 |
11.83 |
|
2019-22 |
18.42 |
17.82 |
17.80 |
19.99 |
13.43 |
13.21 |
14.21 |
13.52 |
|
+/- |
2.42 |
0.15 |
1.96 |
2.82 |
0.43 |
1.54 |
1.51 |
1.69 |
|
+/- (%) |
15.14 |
0.87 |
12.41 |
16.43 |
3.31 |
13.19 |
11.90 |
14.25 |
Source: Based on the CAR of leading Indian banks (as given in appendix 3)
Source: Based on the CASA ratio of leading Indian banks (as given in appendix 4)
Figure 6. Growth trend of the CASA ratio of leading Indian banks
Table 5. Average CASA of Indian banks from 2013 to 2018 and from 2019 to 2022
|
Mean |
HDFC |
ICICI |
Axis |
Kotak |
SBI |
PNB |
BOB |
CANARA |
|
2013-18 |
45.17 |
46.35 |
47.78 |
38.38 |
43.45 |
39.01 |
28.63 |
26.75 |
|
2019-22 |
44.72 |
47.42 |
43.87 |
57.44 |
33.53 |
44.06 |
37.98 |
31.81 |
|
+/- |
-0.45 |
1.07 |
-3.91 |
19.07 |
-9.92 |
5.04 |
9.35 |
5.06 |
|
+/- (%) |
-1.01 |
2.31 |
-8.18 |
49.69 |
-22.84 |
12.93 |
32.67 |
18.92 |
Source: Based on the CASA of leading Indian banks (as given in appendix 4)
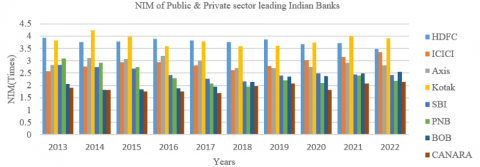
Source: Based on the NIM ratio of leading Indian banks (as given in appendix 5)
Figure 7. Growth trend of the NIM ratio of leading Indian banks
4.1.5 Growth trend of NIM (Net Interest Margin) ratio of leading Indian banks
The net Interest Margin ratio is the ratio of excess interest income over the interest expenses to the average of earning assets. The higher NIM ratio is considered favorable for the financial soundness of the banks. The higher NIM ratio implies the surplus of the bank’s regular income (interest earned on loans) on the bank’s regular expenses (interest paid on deposits). Interest rate margin, amount of loans and advances, and amount of deposits defines the NIM of the banks.
From the above Figure 7, it can be explained that there is either slight decrement or stagnation of the NIM ratio of the leading Indian banks from 2013 to 2018. There is a slight increment in the NIM ratio of leading Indian banks from 2019 to 2022. The NIM of the leading Indian banks was at the lowest level in 2018. The NIM of the leading public sector banks was lower than the leading private sector banks. In Indian leading banks, the highest NIM is from the Kotak (private sector bank) while the lowest NIM is from the Canara (Public sector bank) bank. Kotak bank is earning more interest on their loans and advances as compared to payment on payment of interest on their deposits.
Table 6 explains that the profit-earning capacity of the Indian private banks is higher than the Indian public sector banks. There is negligible increment or decrement in the NIM ratio of Indian banks from 2013-18 to 2019-22. The relational growth of all Indian banks is negative from 2013-18 to 2019-22 except ICICI (11.17%), BOB (25.36%), and Canara (11.74%) banks. This refers that the profit-earning capacity of the Indian banks varies as per the GNPAs and NNPAs, negatively.
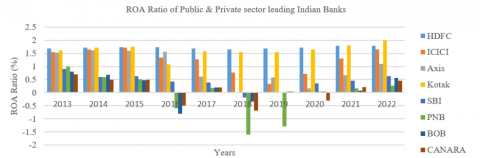
4.1.6 Growth trend of ROA (return on assets) ratio of leading Indian Banks
ROA ratio indicates the net return or net income on average total assets of the business organization. The higher ROA ratio is favorable for the banks and it indicates the efficient utilization of the resources. The higher ROA also explains the managerial efficiency of the business organization or how efficiently a business is utilizing its resources to generate income. The trend of the higher ROA ratio indicates the financial soundness of the banks.
From the above Figure 8, it can be explained that there is a decrement in the ROA of leading Indian banks from 2013 to 2018 except HDFC. There is an increment in the ROA ratio of leading Indian banks from 2019 to 2022 except HDFC. The ROA of the leading Indian banks was at the lowest level in 2018. The ROA of the leading public sector banks was lower than the leading private sector banks. In Indian leading banks, the highest ROA is the HDFC (private sector bank) while the lowest net income is from the PNB (Public sector bank) bank. In 2016 and 2018, the net income of the public sector banks (PNB, BOB, and Canara) was negative. There was a negative net income for SBI and PNB in 2018 and 2019.
Table 7 explains that the ROA of the Indian private banks is higher than the Indian public sector banks. There are negligible variations in the average ROA of the Indian banks from 2013-18 to 2019-22. There is HDFC (0.04%), Kotak (0.20%) and BOB (5.88%) banks’ ROA is increased only while negative trend in all private and public sector Indian banks. The relational growth of either negative or negligibly positive refers that the return on assets of the Indian banks varying as per the GNPAs and NNPAs, negatively.
Table 6. Average NIM of Indian banks from 2013 to 2018 and from 2019 to 2022
|
Mean |
HDFC |
ICICI |
Axis |
Kotak |
SBI |
PNB |
BOB |
CANARA |
|
2013-18 |
3.83 |
2.78 |
2.99 |
3.83 |
2.52 |
2.51 |
1.95 |
1.82 |
|
2019-22 |
3.68 |
3.09 |
2.80 |
3.81 |
2.44 |
2.22 |
2.44 |
2.03 |
|
+/- |
-0.14 |
0.31 |
-0.19 |
-0.02 |
-0.08 |
-0.29 |
0.49 |
0.21 |
|
+/- (%) |
-3.77 |
11.17 |
-6.25 |
-0.54 |
-3.31 |
-11.57 |
25.36 |
11.74 |
Source: Based on the NIM ratio of leading Indian banks (as given in appendix 5)
Source: Based on the ROA ratio of leading Indian banks (as given in appendix 6)
Figure 8. Growth trend of the ROA ratio of leading Indian banks
Table 7. Average ROA of Indian banks from 2013 to 2018 and from 2019 to 2022
|
Mean |
HDFC |
ICICI |
Axis |
Kotak |
SBI |
PNB |
BOB |
CANARA |
|
2013-18 |
1.70 |
1.38 |
1.16 |
1.55 |
0.46 |
0.01 |
0.17 |
0.11 |
|
2019-22 |
1.74 |
1.01 |
0.63 |
1.75 |
0.37 |
-0.21 |
0.18 |
0.11 |
|
+/- |
0.04 |
-0.38 |
-0.53 |
0.20 |
-0.09 |
-0.22 |
0.01 |
-0.01 |
|
+/- (%) |
2.55 |
-27.17 |
-45.67 |
13.02 |
-20.36 |
-1637.50 |
5.88 |
-7.35 |
Source: Based on the ROA ratio of leading Indian banks (as given in appendix 6)
4.2 Disparity analysis
Disparity analysis of financial soundness consists of variations among the measures of financial soundness over a period of time. To fulfill the objectives of the research disparity analysis can be bifurcated into three categories i.e. Disparity among the leading Indian banks, Disparity among the Private banks, and disparity among the public banks.
4.2.1 Disparity of financial soundness measures among the leading Indian banks
The disparity among the leading Indian banks refers to the differences in the financial soundness of the leading Indian banks.
From Table 8, it is clear that there are significant differences in measures of financial soundness among the leading Indian banks. The relative differences (based on F ratio) in NIM ratio (88.52312), CAR (27.99975), and ROA ratio (21.11652) is higher than the CASA ratio (8.846628), GNPA ratio (14.48165), and NNPA ratio (14.92833). Hence, there is a higher disparity in the returns and income while lower disparity in the non-performing assets ratio.
4.2.2 Disparity of financial soundness measures among the leading Indian private sector banks
The disparity among the leading Indian private banks refers to the difference in financial soundness measures among the leading Indian private sector banks.
Table 8. Differences among the financial soundness of the leading Indian Banks
|
H01 |
Hypothesis |
F* |
Fα** |
Decision: H0 (If F≥F, Don’t accept H0) |
|
H01.1 |
There is insignificant difference among the GNPAs ratio of leading Indian Banks |
14.48165 |
2.139656 |
Don’t Accept |
|
H01.2 |
There is insignificant difference among the NNPAs ratio of leading Indian Banks |
14.92833 |
2.139656 |
Don’t Accept |
|
H01.3 |
There is insignificant difference among the CAR of leading Indian Banks |
27.99975 |
2.139656 |
Don’t Accept |
|
H01.4 |
There is insignificant difference among the CASA ratio of leading Indian Banks |
8.846628 |
2.139656 |
Don’t Accept |
|
H01.5 |
There is insignificant difference among the NIM ratio of leading Indian Banks |
88.52312 |
2.139656 |
Don’t Accept |
|
H01.6 |
There is insignificant difference among the ROA ratio of leading Indian Banks |
21.11652 |
2.139656 |
Don’t Accept |
Source: F* (Fisher's ratios values) and F ** (F critical values) calculated using EXCEL's calculation based on financial soundness ratios of Indian banks (appendix 1, 2, 3, 4, 5, and 6)
Table 9. Differences among the financial soundness of the leading Private Sector Indian banks
|
H01 |
Hypothesis |
F* |
Fα** |
Decision: H0 (If F≥ F, Don’t accept H0) |
|
H01.1 |
There is insignificant difference among the GNPAs ratio of leading Private sector Indian Banks |
5.384563 |
2.866266 |
Don’t Accept |
|
H01.2 |
There is insignificant difference among the NNPAs ratio of leading Private sector Indian Banks |
8.836758 |
2.866266 |
Don’t Accept |
|
H01.3 |
There is insignificant difference among the CAR of leading Private sector Indian Banks |
1.992686 |
2.866266 |
Accept |
|
H01.4 |
There is insignificant difference among the CASA ratio of leading Private sector Indian Banks |
0.133991 |
2.866266 |
Accept |
|
H01.5 |
There is insignificant difference among the NIM ratio of leading Private sector Indian Banks |
70.10833 |
2.866266 |
Don’t Accept |
|
H01.6 |
There is insignificant difference among the ROA ratio of leading Private sector Indian Banks |
7.904597 |
2.866266 |
Don’t Accept |
Source: F* (Fisher's ratios values) and F ** (F critical values) calculated using EXCEL's calculation based on financial soundness ratios of Indian banks (appendix 1, 2, 3, 4, 5, and 6)
Table 10. Differences among the financial soundness of the leading Public Sector Indian banks
|
H01 |
Hypothesis |
F* |
Fα** |
Decision: H0 (If F≥ F , Don’t accept H0) |
|
H01.1 |
There is insignificant difference among the GNPAs ratio of leading Public sector Indian Banks |
4.487805 |
2.866266 |
Don’t Accept |
|
H01.2 |
There is insignificant difference among the NNPAs ratio of leading Public sector Indian Banks |
5.297973 |
2.866266 |
Don’t Accept |
|
H01.3 |
There is insignificant difference among the CAR of leading Public sector Indian Banks |
1.461115 |
2.866266 |
Accept |
|
H01.4 |
There insignificant difference among the CASA ratio of leading Public sector Indian Banks |
5.280484 |
2.866266 |
Don’t Accept |
|
H01.5 |
There is insignificant difference among the NIM ratio of leading Public sector Indian Banks |
9.183173 |
2.866266 |
Don’t Accept |
|
H01.6 |
There is insignificant difference among the ROA ratio of leading Public sector Indian Banks |
1.349332 |
2.866266 |
Accept |
Source: F* (Fisher's ratios values) and F ** (F critical values) calculated using EXCEL's calculation based on financial soundness ratios of Indian banks (appendix 1, 2, 3, 4, 5, and 6)
From Table 9, it is clear that there are no significant differences in measures of financial soundness among the leading Indian private banks except for CAR and CASA ratios. There is no variation in capital adequacy ratio (CAR) and current account and saving account total deposits ratio (CASA) among the leading Indian private banks. The relative differences (based on the F ratio) in the NIM ratio (70.10833) are higher than the GNPA ratio (5.384563), NNPA ratio (8.836758), and ROA (7.904597) ratio. There is a higher disparity in the returns and income while lower disparity in the non-performing assets ratio. The CAR and CASA of the Indian private banks are higher and similar revealing the adequacy to payout its debts and an indication of strong earning capacity due to a major portion of its current account and saving account in its total deposits. The deposits from the savings bank account and the current bank account are the low-cost capital. Ultimately, this facilitates a great reason for earning.
4.2.3 Disparity of financial soundness measures among the leading Indian public sector banks
The disparity among the leading Indian public banks refers to the difference in financial soundness measures among the leading Indian public sector banks.
From Table 10, it is clear that there are no significant differences in measures of financial soundness among the leading Indian public banks except for CAR, and ROA ratios. There is no variation in capital adequacy ratio (CAR) and return on assets (ROA) ratio among the leading Indian public banks. The relative differences (based on the F ratio) in the NIM ratio (9.183173) are higher than the GNPA ratio (4.487805), NNPA ratio (5.297973), and CASA (5.280484) ratio. Hence, there is a higher disparity in the returns and income while lower disparity in the non-performing assets ratio. The similarity in return on assets and Capital Adequacy ratio (CAR) in leading Indian banks refers to the similar profitability and similar paying ability of their liabilities.
From the historical analysis of the Leading Indian banks, it can be explained that the GNPAs ratios are higher in the leading public sector banks than in the leading private sector banks in India. The GNPAs was increasing and it was at their highest level in the year 2018 and starts to decline from 2018 in Indian leading banks. The growth trend of the NNPAs of leading Indian banks follows the trend of the GNPAs. The capital adequacy ratio was at its lowest level in 2019 and start increasing in 2020. This shows the improvement in the financial soundness of the leading Indian banks. The capital adequacy is lower in the leading Indian public banks than in the leading Indian private banks.
The banks’ capital was higher in the leading Indian private banks compared to leading public sector banks in the context of risk weighted Assets from 2013 to 2022. Overall, there is the growth seen in the capital adequacy ratio of leading Indian banks from 2013 to 2022. This is the indication that the leading Indian banks being stronger to payout their liabilities in the normal course of activities or the NPAs will not affect their paying capacity. The CASA ratio of the leading Indian private sector was higher than the leading Indian public banks. This facilitates a major source of the margin for the leading Indian private sector banks than the public sector banks. Probably, this may be the cause of low returns in the leading Indian public sector banks. There is slight growth seen in the CASA ratio of the leading Indian bank from 2013 to 2022. The progressive CASA ratio of leading Indian banks is an indication of the strengthening financial soundness of the banks. The NIM ratio in the leading Indian public sector banks is lower than the leading Indian private sector banks as the CASA ratio indicates the higher proportion of saving banks account and current accounts in the leading Indian private banks. There is no remarkable growth seen in the NIM ratio. However, the NIM ratio in leading Indian public banks is improving gradually. The return on assets (ROA) in the leading Indian public sector banks is the collective result of the CASA and NIM and conveys positive results over the leading Indian private banks while negatively affecting the leading Indian public banks. The ROA of the leading Indian public banks was negative in 2016 and 2018 and in 2019 and 2020 exceptionally. The NIM and ROA is governed by the NPAs in Indian banks, negatively. However, from 2021 the ROA of leading Indian public banks increasing. This is also a good signal for the banks regarding the NPAs and financial soundness. The disparity analysis reveals the significant disparity among the measures of the financial soundness of leading Indian banks. There is a higher disparity in earning capacity (NIM and ROA) while low disparity in the GNPAs and NNPAs of the leading Indian banks. Possibly, the leading Indian public sector banks manage provisions for the NPAs from their profits. This is also a cause of lowering the income of the leading Indian public sector bank for the shareholders. The individual disparity analysis of the leading private sector banks reveals that there are significant differences in measures of financial soundness among the leading Indian private banks except for CAR and CASA ratios. While a remarkable difference among the NIM of leading Indian private sector banks. This implies that some leading Indian private banks also utilize their profits to write off their NPAs. However, the graphical presentation reveals that the NIM of leading Indian private banks is higher than the public banks. The CAR and CASA of the Indian private are higher and similar revealing the adequacy to payout its debts and an indication of strong earning capacity due to a major portion of the current account and saving account in its total deposits. The deposits from the savings bank account and current bank account are the low-cost capital. Ultimately, this facilitates a great reason for the earning to the leading Indian private sector banks. The disparity analysis of the leading Indian public sector banks reveals that there are no significant differences between the capital adequacy ratio (CAR) and the return on assets (ROA) ratio of the leading Indian public sector banks. While there is a remarkable relative difference (9.183173) among the NIM of the public sector banks. This refers that the leading public sector banks with higher amounts of assets earn lower interest margins while the banks that own lower amounts of assets enjoy the higher NIM, comparatively. The significant difference among the CASA indicates the significant difference between NIM and ROA in leading Indian public sector banks. However, there is a significant difference between the NIM and similarity in the ROA. The Indian public banks with higher CASA and NIM suffer a higher rate of NPAs and utilize their profits to reduce the NPAs.
From all analysis and discussions, it is obvious that the GNPAs and NNPAs of all the leading Indian banks were at their highest level in 2018 and starts to decline in 2019 in a period of study 2013 to 2022. This reflects the strengthening of the financial soundness of the banks. The GNPAs and NNPAs of the leading public sector banks are higher than the leading private sector banks. The NPAs govern the NIM and ROA in Indian banks, negatively. The capital adequacy ratio (CAR) in the leading Indian private sector banks is higher than the leading private sector banks. All banks maintain the CAR as per the BASEL III prescriptions and also reserve the capital as per the RBI norms in India. The current account and saving banks account to total deposits (CASA) ratio is increasing slightly in the Indian banking industry. Enhancements of the CASA ratio will play a vital role in strengthening the financial soundness of the banks. The financial soundness of the banks can be maintained by controlling or reducing the NPAs and another hand enhancing the regular income to maintain the reserves or provisions against the hedging from insolvency. The controlling and reduction of the NPAs totally depends on the loan sanctioning policies and strategies, and after that strict governance to recover the loans to avoid the NPAs. Another hand, the banks have to maintain their CASA ratio to enhance the NIM ratio. Hence, there is a need in the leading Indian public banks to enhance the current account deposits and saving banks accounts in total deposits to avail the cheaper funds to the banks for loans and advances. The study is based on the secondary only data obtained from the financial statements and no consideration of the non-monetary factors related to the NPAs. Further, there is scope available to consider the behavioral approach or non-monetary approach to study the NPAs in Indian banks.
This study is supported via funding from Prince Sattam bin Abdulaziz University. Project No.: PSAU/2023/R/1444).
[1] Wadhwa, R., Ramaswamy, M.K., Fin, S.M. (2020). Impact of NPA on Profitability of Banks. International Journal of Engineering Technology and Management Sciences, 4(3): 1-8. https://doi.org/10.46647/ijetms.2020.v04i03.001
[2] Miyan, M. (2017). A comparative statistical approach towards NPA of PSU and private sector banks in India. International Journal of Advanced Research in Computer Science, 8(1): 46-52. https://doi.org/10.26483/ijarcs.v8i1.2850
[3] Kumar, S., Prakash, P. (2018). Emerging trends of NPAs in priority and non-priority sector in India: A study of public and private sector banks. PRAGATI: Journal of Indian Economy, 5(1): 1-14.
[4] Fatima, N. (2014). Capital adequacy: A financial soundness indicator for banks. Global Journal of Finance and Management, 6(8): 771-776.
[5] Mittal, R.K., Suneja, D. (2017). The problem of rising non-performing assets in banking sector in India: comparative analysis of public and private sector banks. International Journal of Management, IT and Engineering, 7(7): 384-398.
[6] Maiti, A., Jana, S.K. (2017). Determinants of profitability of banks in India: A panel data analysis. Scholars Journal of Economics, Business and Management, 4(7): 436-445. https://doi.org/10.21276/sjebm
[7] Bhaskaran, R., Bhalla, L., Sarin, V., Kaur, S., Rahman, A., Singh, G., Verma, P. (2016). Non-performing assets of public and private sector banks in India-a comparative study. International Journal of Services and Operations Management, 25(2): 155-172.
[8] Kadanda, D., Raj, K. (2018). Non-performing assets (NPAs) and its determinants: a study of Indian public sector banks. Journal of Social and Economic Development, 20(2): 193-212. https://doi.org/10.1007/s40847-018-0068-0
[9] Bajaj, R.V., Sanati, G., Lodha, C. (2021). Impact Assessment Study of NPAs and Rate of Recovery: Are Private Sector Banks in India Better off? Global Business Review, 0972150920980305. https://doi.org/10.1177/0972150920980305
[10] Jayakkodi, D., Rengarajan, P. (2016). Impact of non-performing assets on return on assets of public and private sector banks in India. International Journal of Applied Research, 2(9): 696-702.
[11] Boddu, S.N. (2019). Prevention of NPAs: A Comparative Study on Indian Banks. International Journal of Scientific Research Publications, 9(1): 618-622. http://dx.doi.org/10.29322/IJSRP.9.01.2019.p8574
[12] Singh, V.R. (2016). A Study of Non-Performing Assets of Commercial Banks and it’s recovery in India. Annual Research Journal of SCMS, Pune, 4(1): 110-125.
[13] Kumari, R., Singh, P.K., Sharma, V.C. (2017). Impact of Non-Performing Assets (NPAs) on Financial Performance of Indian banking Sector. Journal of Commerce & Management, 6(1): 122-133.
[14] Bawa, J.K., Goyal, V., Mitra, S.K., Basu, S. (2019). An analysis of NPAs of Indian banks: Using a comprehensive framework of 31 financial ratios. IIMB Management Review, 31(1): 51-62. https://doi.org/10.1016/j.iimb.2018.08.004
[15] Das, S.K., Uppal, K. (2021). NPAs and profitability in Indian banks: an empirical analysis. Future Business Journal, 7(1): 1-9. https://doi.org/10.1186/s43093-021-00096-3
[16] Batra, V., Batra, N. (2020). Trends and Differences in NPAs across Bank Groups in India. Global Journal of Finance and Management, 12(1): 1-17.
[17] Bepari, R., Sarkar, S.C. (2020). Impact of non-performing assets on profitability performance of selected public sector banks and private sector banks in India: A comparative study. International Journal of Multidisciplinary Educational Research, 9(5): 46-52.
[18] Mohanty, B., Mehrotra, S. (2021). Asset quality concern and its effect on performance of public and private sector banks in India: An empirical assessment. Asian Journal of Accounting & Governance, 16: 1-8. http://dx.doi.org/10.17576/AJAG-2021-16-01
[19] Javheri, J., Gawali, R. (2022). A study on NPAs of selected private & public sector banks in India. Indian Journal of Finance and Banking, 9(1): 129-139. https://doi.org/10.46281/ijfb.v9i1.1610
[20] Chary, D.S. (2021). A Comparative Analysis of the Non-Performing Assets of Public and Private Sector Banks in India. IUP Journal of Accounting Research & Audit Practices, 20(4): 76-87.
[21] Agarwal, M.K., Preeti, M. (2022). Non-performing assets in Indian banking sector: An analytical and comparative study of selected public and private sector banks. Journal Global Values, 8(1): 91-104. https://doi.org/10.31995/jgv.2022.v13i01.013
[22] Beevi, H.R. (2018). Financial performance of public and private sector banks in India using CAMEL model. IJRAR-International Journal of Research and Analytical Reviews, 5(4): 430-434.
[23] Khan, A. (2018). Financial performance analysis of public and private sector banks through camel model. Asian Journal of Applied Science and Technology, 2(2): 954-964.
[24] Chander, K., Madaan, S. (2019). Trends of NPAS in selected public & private sector banks. ZENITH International Journal of Business Economics & Management Research, 9(5): 18-26.
[25] Kaur, M., Kumar, R. (2018). Sectoral analysis of non-performing assets during pre and post crisis period in selected commercial banks. Pacific Business Review International, 11(3): 34-41.
[26] Ali, A. (2020). Financial performance and size determinants: growth trend and similarity analysis of Indian pharmaceutical industry. Humanities & Social Sciences Reviews, 8(4): 547-560. https://doi.org/10.18510/hssr.2020.8454