Cesar Felipe Henao Villa* | Julio Cesar Martínez Zarate | Federico Henao Villa
© 2022 IIETA. This article is published by IIETA and is licensed under the CC BY 4.0 license (http://creativecommons.org/licenses/by/4.0/).
OPEN ACCESS
Competitiveness as a concept has had a significant impact on the development not only of individual companies, but also of the national and international economy. This article contributes to the analysis of competitiveness framed in the context of sustainability, responding to the call of the United Nations in relation to the Sustainable Development Goals (SDG), and more specifically in the framework of SDG 11, which mentions the importance of working in pursuit of “sustainable cities and communities”. The mixed-cut methodology starts from a conceptual inquiry into the competitiveness of states according to the World Economic Forum, highlighting its main components and a detailed examination of the associated indices to collect data that were later analyzed for the construction of models for understanding of the dynamics of the sustainable competitiveness index, thus contributing to the knowledge of the main competitive advantages and disadvantages of the states in this matter. As a result, a factor analysis of 1196 country records is obtained, which, after being contrasted with structural equation models, allowed the identification of five factors with their respective regression values, thereby identifying classification scenarios by countries with their respective predictor variables. Finally is concluded that there are different variables such as intellectual capital, social capital, natural capital and governance that are needed for a better sustainable society. The methodology approach for this paper presents a novel KDD approach in order to have a more suitable and proper results.
competitiveness, sustainability, predictive models, structural equation models, predictive factors
The Global Competitiveness Index is made up of 113 variables that characterize in detail the competitiveness of the countries of the world at different levels of economic development. The set of variables is made up of two-thirds of the results of a global survey of business leaders (to cover a wide range of factors affecting the business climate in the countries studied), and one-third of publicly available sources (statistics and research results carried out periodically by international organizations). All variables are combined into 12 benchmarks that determine national competitiveness: the quality of institutions, Infrastructure, macroeconomic stability, health and primary education, higher education and vocational training, efficiency of the market for goods and services, efficiency of the labor market, development of the financial market, level of technological development, size of the national market, competitiveness of the companies and potential for innovation.
The choice of these same variables is due to theoretical and empirical studies, and not a single factor by itself can ensure the competitiveness of the economy. Thus, the effect of an increase in spending on education can be reduced due to inefficiency in the labor market, other deficiencies in the institutional structure and, therefore, the lack of opportunities for graduates of educational institutions to have adequate employment. Attempts to improve the macroeconomic environment, for example to optimize the control of public finances, will only be successful if the financial management system is transparent and there are no large-scale corruption or violations. Entrepreneurs will only implement new technologies if the potential profits exceed the required investment. Thus, when compiling the Index, experts consider the fact that the economies of different countries of the world are at different stages of their development.
The importance of individual factors in the growth of a country's competitiveness is associated with the starting conditions, or with the institutional and structural characteristics that allow the State to be positioned in relation to other countries through the prism of development. Researchers are constantly improving the methodology for calculating the Index so that it remains a suitable tool for measuring the level of competitiveness in a constantly changing global environment.
In other hand, Competitiveness Council was founded during the Reagan administration in 1986. Its stated goal was to increase the economic competitiveness of the United States in the global marketplace. It sponsors conferences, seminars, and special events, and publishes annual reports of its recommendations.
The Geneva-based World Economic Forum began the calculations of its Global Competitiveness Index in 1979. It recognizes twelve "pillars" or causal factors that influence competitiveness, such as health and primary education, higher education and training, financial market development, technology and innovation. Lately, it has become common to use the term also in relation to the absence of degradation and human conditions in general. The 1987 Brundtland Report defined it as follows:
Sustainable development... meets the needs of the present without compromising the ability of future generations to meet their own needs. It contains ... the essential needs of the world - the poor, who must be given priority ... In essence, sustainable development is a process of change in which the exploitation of resources, the direction of investments, the orientation of technological development, and institutional changes are all in harmony and enhance both present and future potential to meet human needs and aspirations [1].
In the modern world, the conservation of natural resources is typically achieved through alternative and innovative technology. Fossil fuels are saved through solar or wind power, fish populations in the seas are replenished with fish farms, CO2 release is reduced by installing exhaust controls. In short, sustainability is promoted by innovation and new technologies [2].
In September 2015, world leaders met at the UN in New York adopting a universal agenda setting out 17 SDGs. With this agenda the term “sustainability” is taking on an even broader and more general political meaning. While the university is talking it must be remembered that there is no sustainability that can endure without a constant flow of new technology [3]. Sustainability requires creativity: a continuous updating of technology, new production lines [4], the start-up of new companies and a gradual elimination of obsolete technology.
The Forum's Sustainable Competitiveness Index (SCI) expands the calculation of its standard competitiveness index to include characteristics of demographics, social cohesion, and environmental management [5]. The statistics cover nine social sustainability factors and ten mental sustainability factors. The great merit of the Forum's approach is to update the concept of competence as the capacity in underlying technologies, examined in relation to the social and environmental impact.
The methodological development of the research was framed in a level of abductive reasoning [6] with a quantitative approach, but with qualitative triangulation, leading to the consideration of a mixed approach. According to which, the extraction of the case study is generated at the moment of relating the results obtained with the existing theory.
This approach, whose paradigmatic level is centered on pragmatism, allows the configuration and articulation of methods that make it possible to integrate the results into the theoretical context. In this order of ideas, the importance of analyzing correlations and relationships between variables associated with the global index of sustainable competitiveness for the sample countries and thus identifying predictors is conceived. The model in this order of ideas, is conceived as a predictive model [7] based on CHAID-type algorithms supported by neural networks. The development of the predictive models will then consist of the application of a data mining algorithm in the SPSS software, this application is framed in the knowledge extraction phases that consist of (see Figure 1):
1. Literature review to identify variables and possible data sources.
2. Integration and collection: a data warehouse related to the variables under study is generated.
3. Selection, cleaning, and transformation: the data or databases are integrated into a selected data set in the form of a mineable view.
4. Data mining: patterns and models that best fit the characteristics and relationships between the data are identified. (Identification of structural equations, factorial analysis, construction of a tree diagram and generation of a neural network model).
5. Measurement of efficiency and validity: statistical values are generated that determine if the model fits in a statistically adequate way.
6. Analysis, dissemination, and use: with the results obtained, knowledge bases are generated, and hypotheses or relationships are verified that will eventually support decision-making considering the respective qualitative triangulation.
Figure 1. Extraction phases – methodology
Within the data mining subprocess, the experts suggest the Cross Industry Standard Process for Data Mining (CRISP-DM) methodology model, adapted to the study phenomenon.
The previous steps, in addition to being part of a cyclical process, constitute a recurring set in the sense that it is continuously validated and redefined based on the objectives of the research and its relationship with the expected results within the framework of the theoretical foundations that support them.
Taking into account the literature review and the analysis of different databases, the need to use the data from the global index of sustainable competitiveness for the years 2012-2019 was considered, which brings together 176 countries in the Global Ranking of Sustainable Competitiveness calculated by Solability [8]. These data, in turn, are contrasted with information on GDP, open access to information index, corruption index, population, mortality rate and other indicators proposed by the SDG corporate tracker for the evaluation and monitoring of Sustainable Development Goal related to “Sustainable cities and communities” [9].
The GDP databases provided by the World Bank [10], and the Human Development Index data presented by the United Nations Development Program [11], were also considered. Additionally, it was necessary the information provided by the Fraser Institute regarding the Index of Economic Freedom [12].
3.1 Bibliometric analysis
A bibliometric analysis has been carried out aimed at identifying the variables under study. To obtain the information required for the analysis, the following search equation was used: (TITLE {PREDICTING FACTORS IN THE GLOBAL INDEX}) on the Scopus platform, obtaining a total of 46 documents, such as: journal articles, research, book chapters and degree projects. From this procedure, the summaries of the content provided the argumentative support for the development of the research. Bibliometrics can be defined as the science that studies the nature and course of a discipline, as long as it gives rise to publications [13], so it is a timely tool to carry out this analysis, since it is useful to measure the activity and scientific repercussion through the quantification of publications, in addition to allowing trends and associated changes to be monitored, thus contributing to obtain a clearer panorama and work path [14].
Using the Scopus results search analysis, 46 results were obtained between the years 2000 and 2020, which will be the input to obtain the bibliometric indicators that are presented in Figure 2.
Source: Scopus
Figure 2. Trajectory diagram on predictive factors in the global index of sustainable competitiveness between 2000 and 2020
It is observed how the level of production has been up and down, but with an increase in recent years, having a drop in 2019 but with a rebound in 2020, possibly due to the necessary reflection due to the COVID-19 health crisis. Analyzing in detail the documents found in the previous bibliometric analysis that are most related to the topics associated with the research, the following articles were found: “technological adaptation and survival of SMEs”, “social progress in the development of global competitiveness”, “latest trends and future scenarios for the development of a sustainable digital economy”. From the above, variables to be considered are identified, which were described in the methodology.
3.2 Integration, recovery, selection, and cleaning of data
From the database search and its respective integration, 1,432 records were initially identified for 176 countries. The records were filtered according to missing or blank values, finally leaving 1,196 records for 160 countries. The number of records is due to the fact that the information of a country in a specific year is considered as a record, since the analysis is in the period between 2012 and 2019, there are eight years in the observation window that when multiplied by the 160 countries gives a maximum of 1,280 records or rows in which the variables for each specific case are represented, leaving 1,196 records with complete information.
The variables took up all the information that, at the discretion of the researchers and based on the bibliographic search, summarize the necessary and most complete data for a holistic understanding of the concept. Figure 3 presents the data integration model obtained.
3.3 Modeling: data mining, efficiency, and validity measures
When developing the factorial analysis with a measure of maximum likelihood and considering a varimax rotation for the variables identified excluding the value of the index, the results of the KMO and Bartlett tests were obtained, which are presented in Table 1.
Figure 3. Data integration model
Table 1. KMO and Bartlett test
|
Kaiser-Meyer-Olkin measure of sampling adequacy |
.772 |
|
|
Bartlett's sphericity test |
Approx. Chi squared |
12132,676 |
|
Gl |
120 |
|
|
Next. |
,000 |
|
It is then obtained that the sample is optimal for factor analysis, generating five groups of variables that can be seen in Table 2.
Table 2. Rotated factor matrix
|
Variable |
Factor |
||||
|
1 |
2 |
3 |
4 |
5 |
|
|
Employment_Agriculture |
0.897 |
|
|
0.206 |
0.368 |
|
Intellectual capital |
-0.860 |
0.167 |
0.231 |
-0.204 |
0.370 |
|
Jobs_Vulnerable |
0.856 |
|
|
0.255 |
0.213 |
|
Rural population |
0.768 |
|
-0.121 |
|
0.280 |
|
Social capital |
-0.572 |
|
|
-0.135 |
0.184 |
|
Export_Goods |
-0.472 |
|
|
|
|
|
Inflation |
0.160 |
|
|
|
|
|
PERCENTAGE_ GROWTH_GDP |
0.150 |
|
|
|
0.101 |
|
Total population |
0.145 |
0.936 |
0.314 |
|
|
|
Labor forcé |
0.114 |
0.892 |
0.391 |
|
|
|
Capital_Natural |
0.106 |
-0.163 |
|
|
0.124 |
|
Import_Goods |
-0.182 |
0.318 |
0.902 |
|
|
|
Direct_Investment |
-0.115 |
0.217 |
0.741 |
|
|
|
percentage_growth_ urban_population |
0.443 |
|
|
0.893 |
|
|
governance |
|
|
|
|
0.234 |
|
Extraction method: maximum likelihood. Rotation method: Varimax with Kaiser normalization. |
|||||
From the above, the generation of five main factors according to their factorial load stands out and can be seen in Table 3.
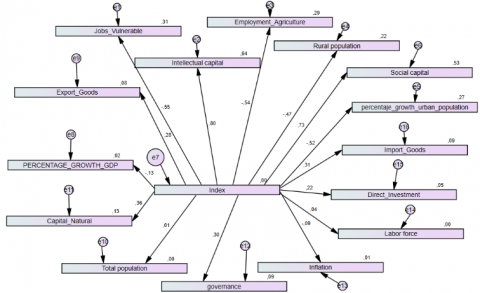
When contrasting the factorial analysis with regression values in a structural equation, the diagram in Figure 4 is made.
Figure 2 shows that the highest regression values associated with the sustainable competitiveness index with a significance level of 95% are Rural_Population (-0.47), social_capital (0.73), urban_population_growth_percentage (-0.52), agriculture_employment (-0.54), vulnerable_employments (-0.55) and intellectual_capital (0.80).
Table 3. Classification of variables by factor
|
Factor |
Variables |
|
1 (FAC1_2) |
Agriculture_Employment (direct), Intellectual_Capital (Reverse), Vulnerable_Employments (direct), Rural_Population (direct), Social_Capital (Reverse), Merchandise_Exports (Reverse), Inflation (direct), GDP_Growth_Percentage (direct) |
|
2 (FAC2_2) |
total_population (direct), Labor_Force (direct), Natural_Capital (direct) |
|
3 (FAC3_2) |
Import_Goods (direct), Investment_Direct (direct) |
|
4 (FAC4_2) |
urban_population_growth_percentage (direct) |
|
5 (FAC5_2) |
Governance (direct), year (reverse) |
Contrary to what was expected, the natural capital and governance indicators that were used to develop the index did not register high regression values (0.36 and 0.30, respectively). It is interesting to highlight the negative relationship between the variables of population growth in general (rural, urban), GDP growth and increase in vulnerable jobs in relation to the change in the index of sustainable competitiveness, indicating a possible inverse relationship that will be contrasted with neural network algorithms and CHAID (Chi Square Automatic Interaction Detector).
The CHAID algorithm yields decision trees, as can be seen in Figure 5.
Figure 4. Structural equation diagram
Figure 5. Decision trees produced by the CHAID algorithm
From the application of the algorithm, the generation of 15 grouping nodes and conglomerates by countries in similar index ranges is highlighted, where it is the intellectual capital that generates a differentiating factor for the countries with the highest sustainable competitiveness indexes, with which is possible to consider the analysis of public policies for the improvement of the indices by identifying characteristics for countries with similar indices. By applying multilayer perceptron neural network algorithms with hyperbolic tangent activation function to the regression values of the identified factors, a classification by predictor is obtained.
In Figure 5, Factor 1 and Factor 4 can be observed as main predictive factors, which agree in their variables with what is identified in the structural equation (see Figure 6).
Figure 6. Normalized importance of factors as predictors
The inclusion of the Country variable as the second most important predictor factor is highlighted, which is consistent with the organization in decision trees in Figure 5. It is worth noting that the seed to replicate the analysis is 123456789 and partitions 70 were used, 30, 10 for training, testing and validation. Regarding the predictive capacity, a relative error of 9.6% is obtained for training and 16.9% for validation. The graph that relates the predicted value to the real value can be identified in Figure 7. A direct relationship can be observed in line with an approximate inclination of 45°, which implies a good fit of the model.
In the algorithm, the country, direct investment, total population, and merchandise imports as main variables. The smallest contribution is presented for employment in agriculture, the year, and the export of merchandise. For this case, a higher prediction error is obtained: 11.3% and 16.4% error for the training and testing phases, respectively. The graph that relates the predicted value to the actual value has a good fit and has been obtained considering the predictive contribution of the variables changes.
Figure 7. Relationship between the predicted value and the index for the regressions of the obtained factors
The application of predictive models in aspects related to sustainability is relatively new in the academic context. Among the articles associated with this theme, the work of Seele [15] stands out first, in which reference is made to the possibility of preventing aspects related to corporate scandals, global warming or other aspects related to damage to society through the application of predictive models.
In this sense, the establishment of a sustainability policy through predictive control is the use of analytical techniques to identify issues for mutual deliberation, supervision, and intervention with the goal of preventing future damage related to environmental, social and governance aspects, solving scandals. past and identifying potential actors and corporations of unsustainable activities and their stakeholders in the near future.
Another work in the Colombian context is oriented towards the evaluation of territorial sustainability in Bogotá [16]. This article concludes that territorial sustainability evaluation models must make strong reductionisms of the complexity of urban events, but they can consider the best set of multidimensional variables that can be obtained, to make their explanatory, predictive and prescriptive power more efficient.
This model allowed to establish limits to the urban dynamics considering the cultural patterns that depend on variables of different nature and that are related to moral and political aspects of the cultural substratum, as it has been obtained in the model of the present investigation. It is important to identify how a good part of the analyzes consider aspects at the level of regions with very specific indicators, without discussing the integrality of the concept of sustainability, beyond the climatic, polluting or urban aspects, with the present model they have been integrated more general aspects by country. In fact, articles like the one by Giraud-Herrera and Morantes-Quintana [17] direct their actions towards aspects related to urban environmental sustainability.
In this sense, the application of the study to a specific case yielded a multiple linear regression model with 11 significant variables at the parcel level: parcel area, population, land uses (residential-commercial-office, multi-family residential, other varied uses), built-up area per inhabitant, height of the building, building condition, noise level, trees and soil permeability.
It was also possible to identify the article by Madu et al. [18] that makes comparisons by continents. In this sense, qualitative data analysis and deep learning models were generated that allowed identifying the importance of incentives, economic opportunities, emission reduction activities and incentive beneficiaries, as important aspects when establishing links between knowledge explicit and implicit for the support of policies on sustainability in cities, the foregoing could be considered complex to the extent that, as was well observed in the previous results, the country is an important variable that, if integrated at the continental level, entails a reductionism that limits the model.
Likewise, no literature has been found that works with neural networks in the field of sustainable competitiveness, which gives a novel approach to this research.
In relation to methodological approaches, the literature presents a primitive model called KDD (Knowledge Discovery Databases) [19], which is an interactive and iterative process for decision making; Generally speaking, the related sequential steps are data retrieval, selection resulting in target data retrieval, preprocessing resulting in preprocessed data, transformation resulting in transformed data, data mining resulting in patterns, and finally interpretation/evaluation whose result is knowledge, with the development of this research, it has contributed to the generation of knowledge using a similar methodology.
The index calculated by SolAbility effectively responds to the concepts of sustainable competitiveness when, by grouping similar variables, it has been possible to reach similar results in different models, with which it can be concluded that the index is robust and multidimensional enough to contribute to a better understanding of country dynamics.
The research has contributed to a better understanding of the goals of sustainable competitiveness and the direction that these entail in the framework of public policies, allowing to identify, for example, the impact of the implementation of strategies by those guided by the circular economy approach. within the framework of the reduction of environmental impacts and that far from trying to increase the GDP (which is a volatile and one-dimensional index, this aspect has already been seen in the current health crisis due to COVID-19) through macroeconomic policies, it should bet for increasing aspects such as intellectual capital, social capital, natural capital and governance in a virtuous spiral that would contribute to a more sustainable trend of growth and competitiveness, responding to the changes proposed by the technological paradigm in the framework of the fourth industrial revolution.
The present investigation, conceived from the Digital University Institution of Antioquia, aimed to identify behavior patterns in aspects related to sustainable development (SD), the latter aspect being a main challenge throughout the world, even more so today than due to the rapid progress of the globalized economy has increased the demand for natural resources, while many of these resources are not infinite and reproducible [20].
A change is necessary in the way of acting and thinking of the new generations, which require quality education and learning at all levels and in all areas and social contexts [21], education focused on sustainable development is the best way to help people develop their skills and knowledge, which people need [22].
[1] World Commission on Environment and Development (WCED). (1987). Our Common Future (Brundtland Report). Geneva: United Nations.Bejan, A. (2015). Constructal thermodynamics. Constructal Law & Second Law Conference, Parma, pp. S1-S8.
[2] Phillips, F. (2014). Toward a sustainable technopolis. In Technopolis, Springer, London, 5, 169-183.
[3] Connor, R. (2015). The United Nations World Water Development Report 2015: Water for a Sustainable World. (vol 1). UNESCO Publishing.
[4] García Arango, D., Aguirre Mesa, E.D., Gallego Quiceno, D.E. (2017). Risk measures in inventory models: determinism or uncertainty in sustainable production? Journal of Engineering and Technology, 6(1): 10-20.
[5] Bedoya-Corrales, L.I., Arango, D.A.G., Sepúlveda-Aguirre, J., Gutiérrez, C.A.E. (2018). Comparative study of germination percentage for Lactuca sativa varieties: Sustainable orchards in urban environments. Produción+ Limpia, 13(1): 83-91. https://doi.org/10.22507/pml.v13n1a10
[6] Samaja, J. (2012). Epistemology and Methodology: Elements for a Theory of Scientific Research. Buenos Aires: Eudeba.
[7] Shmueli, G. (2010). To explain or to predict? Statist. Sci., 289-310.
[8] SolAbility Sustainable Intelligence. (2020). The Global Sustainable Competitiveness Index. Zurich: SolAbility.
[9] Global Change Data Lab. (2018). Measuring progress towards the Sustainable Development Goals. https://sdg-tracker.org/cities.
[10] World Bank. (2018). Atlas of the Sustainable Development Goals 2018: Based on the World Development Indicators. World Bank Atlas. Washington, DC: World Bank. https://openknowledge.worldbank.org/handle/10986/29788.
[11] United Nations Development Program. (2019). General view. Human Development Report 2019. New York: UNDP.
[12] Fraser Institute. (2019). Economic Freedom of the World. Vancouver: Fraser Institute.
[13] Sancho, R. (2002). Bibliometric indicators used in the evaluation of science and technology. Universitat Oberta de Catalunya Barcelona.
[14] Arenas, J.L.R. (2002). Bibliometrics for what? University Library, 5(1): 3-10.
[15] Seele, P. (2017). A review assessing the potential to transfer big data driven 'predictive policing' to corporate sustainability management. Lugano: Journal of Cleaner Production, 153(4). https://doi.org/10.1016/j.jclepro.2016.10.175
[16] Martínez Rivillas, A., Barragán Zaque, W., Campos Orjuela, A. (2010). Evaluation model of the territorial sustainability of Bogotá: A multi-criteria proposal with a modeling approach to the mobility of cities. Engineering Journal, 16-29. https://doi.org/10.16924/revinge.31.2
[17] Giraud-Herrera, L.M., Morantes-Quintana, G.R. (2017). Application of multivariate analysis for urban environmental sustainability. Urban Territorial Log, 1-31.
[18] Madu, C.N., Kuei, C., Lee, P. (2016). Urban sustainability management: A deep learning perspective. Cities and Society, 30: 1-17. https://doi.org/10.1016/j.scs.2016.12.012
[19] Fayyad, U., Piatetsky-Shapiro, G., Smyth, P. (1996). From data mining to knowledge discovery in databases. American Association for Artificial Intelligence, 17(3): 37-54. https://doi.org/10.1609/aimag.v17i3.1230
[20] Zhao, L.L., Zha, Y., Zhuang, Y.L., Liang, L. (2019). Data envelopment analysis for evaluation sustainability in China: Tackling the economic, environmental, and social dimensions. European Journal of Operational Research, 275(3): 1083-1095. https://doi.org/10.1016/j.ejor.2018.12.004
[21] García Arango, D.A., Luján Rodríguez, G., Zemel, M.E., Gallego-Quiceno, D.E. (2018). Quality in higher education institutions: comparative analysis between models. Venezuelan Journal of Management, 23(1): 200-207.
[22] UNESCO. (2002). Education for sustainability from Rio to Johannesburg: Lessons learned from a decade of commitment.