Yuyu Kuang | Zhongwu Li*
© 2022 IIETA. This article is published by IIETA and is licensed under the CC BY 4.0 license (http://creativecommons.org/licenses/by/4.0/).
OPEN ACCESS
The sustainable development of higher vocational colleges meets the demand for technical skills talents in the market, and is also a great positive factor for the quality improvement of China's manufacturing industry. As the main force in the technical skill talent market, higher vocational college students are also the most important group in need of attention and support in the education system. Based on the real situation of sustainable higher vocational in China, the SEM equation structure model is used to study the relationship among choice behaviors of the students, the economic value orientation, social value orientation, independent choice ability, expectation and perceived value. The results of this research can put forward some enlightenment and suggestions for the development of higher vocational colleges. The empirical research results are of great practical significance and academic value, which can provide theoretical reference and basis for the future strategic decision-making of higher vocational education and government departments.
choice behavior, higher vocational, perceived value, value orientation
Into the 21st century, with the rapid expansion of higher education, the number of college graduates increases year by year, but in addition to bringing greater employment pressure, it is difficult to completely solve the problem of shortage of supply and demand for a large number of highly skilled personnel from the root [1]. Due to the adjustment of economic structure and the optimization and upgrading of industrial structure, the structure of talent demand in China has also undergone profound changes in the new era, which objectively requires China to accelerate the development of higher vocational education and train high-skilled talents [2]. Higher vocational colleges take the training of high-level technical and skilled personnel as their own responsibility, and the development of vocational education has been highly valued by the state, and various favorable policies for the development of vocational education, including the National Vocational Education Reform Implementation Plan, have been issued successively. The rapid expansion of the scale of higher vocational education has prompted higher vocational colleges to gradually move to the central position and undertake the important task of enrollment expansion [3, 4].
In the past five years, the number of students enrolled in higher vocational colleges has increased by 52.8%, while the number of high school graduates has decreased by 4.3%. Higher vocational colleges are facing not only the pressure of reducing the number of students, but also the pressure of competing for students among the same industry. How to enhance the attractiveness of higher vocational colleges and increase the probability of students choosing higher vocational colleges has become an urgent problem to be solved. Although China has introduced many policies to strengthen higher vocational education, it has not really played the role of higher vocational education itself, and the vocational education undertaken by higher vocational colleges is far from meeting the current needs of society. As a result, Chinese higher vocational colleges and universities have become the "low-level schools" in the society and have become less attractive to outstanding students and talents, and their development is very slow [3, 5].
As a key element for enterprises to participate in the market competition, the cultivation of technically skilled talents has become the focus of attention of academia and various fields of society, and a stable and high quality of students choosing to attend higher education institutions is the key to promote the sustainable and healthy development of higher education institutions [6, 7]. Therefore, under the dual background of declining student source and continuous expansion of enrollment plan, students' choice behavior towards higher vocational institutions has gradually become the basic problem faced by most of higher vocational institutions. For higher vocational institutions, how to make more and better students choose to study in our university under the background of student source crisis has become a problem that cannot be avoided and urgently solved when higher vocational institutions gain competitive advantages.
2.1 Economic value orientation
The core competitiveness of traditional universities lies in knowledge creation, rather than providing students with a large number of available resources. Most teachers are more concerned about knowledge creation than the quality of education. Quality inputs include students, faculty, and school infrastructure, quality processes include teaching activities, and quality outputs can be student outcomes at the time of graduation.
Providing quality services is an important task for higher education institutions [8]. Educational institutions may use other industry indicators to measure their service quality and customer satisfaction [9, 10]. Cheng and Tam [11] believe that with the development of society, higher education is increasingly classified as a service industry, which is regarded as an organization that emphasizes meeting customer expectations and needs. Educational institutions should maintain development and improve efficiency. It is inseparable from the support of funds and the number of customers. Education has five characteristics of service industry: intangibility, inseparability, heterogeneity, difficulty in preservation, lack of ownership and user participation process [12, 13].
Hong [14] investigated the satisfaction of six public and private vocational colleges in Fujian Province. Stakeholder theory was added to assist the investigation. Finally, it is found that the satisfaction of students in public schools is higher than that of private schools, and what students care most is tangibility, that is, the completeness and perfection of school facilities and equipment, that is, the degree of its economic value orientation.
This shows that students' quality requirements for higher education institutions focus on the degree of economic value orientation, and the quality requirements for higher education institutions are also students' pre-determined heart goals for the institutions, i.e., students' expectation [15, 16]. Therefore, the relevant hypothesis is proposed:
Hypothesis 1: Economic value orientation has a positive effect on student expectation.
Wang [17] set up a model for the satisfaction evaluation of foreign students in China and conducted a survey on university students in Hebei Province. He divided the perceived quality of foreign students into seven dimensions: reputation, teaching facilities, teaching services, logistics services, emotional factors, reliability and social life. Finally, he found that for the quality of education services for foreign students, and the differences in cultural background and economic needs have a significant impact on the satisfaction of educational service quality of international students.
Perceived quality is the value students place on seven dimensions that represent the quality of the school [18, 19], which have a significant impact on satisfaction while in school, and which are strongly linked to the cultural background (social influence) and economic strength (economic influence) of the school. Therefore, the following hypothesis was inferred:
Hypothesis 2: Economic value orientation has a positive effect on perceived value.
2.2 Student expectation
Scholars have studied social value orientation from the perspectives of psychology, social psychology and economics, and used it to guide practice [20-22]. Since then, the United States, Japan, France and other countries have established expected indicators at the economic level to monitor economic performance. This paper uses Liu’s work [23] for reference to measure the overall impression of the pre-purchase brand and the opinion of the pre-purchase brand feature significance. Among them, the overall impression variable of the brand before purchase measures the overall feeling of students to a college before they apply for the examination, and the significance variable of the brand characteristics before purchase reflects whether the higher vocational school is unique compared with other similar higher vocational schools in students’ minds.
Expected behavior is to obtain expected benefits, and social expectations are the influence of an individual's pursuit of future needs on his or her own social expectations, which in turn influence the occurrence of individual behavior through social expectations [24, 25]. The uniqueness of a school can be evaluated in terms of effective social influence. The maintenance and establishment of social influence can have a direct and significant impact on social expectations. Social expectations are reflected in the individual's pursuit of his or her own social values. Thus, the uniqueness of a school can directly affects the social expectations, or perceived value, felt by individual students. Therefore, the list of hypotheses is as follows:
Hypothesis 3: Social value orientation has a positive effect on perceived value.
When students have a certain perceived value of higher education institutions, they have corresponding expectations based on social expectations and their perception and planning of themselves. Students hope to get or feel the content of the pre-perceived value of teaching quality, campus environment and campus life in this higher education institution which is equal to or higher than their expectations. When students' expectations are high, students are more inclined to choose the school [26, 27]. Therefore, the following hypothesis is proposed in this paper:
Hypothesis 4: perceived value has a positive effect on student expectation.
The measurement of value orientation has been quantified in economics, and the same definition of quantification applies to the measurement of higher education institutions as the degree of social perception of the university brand and the level of teaching and research. Therefore, the measured variables of social value orientation are the overall impression of the university, the degree of social perception of the university brand, etc. College students have corresponding expectations of higher education institutions through the role of social values orientation [28, 29]. They use these quantifiable criteria to compare with their own expectations. Therefore, we propose the following hypothesis:
Hypothesis 5: Social value orientation has a positive effect on student expectation.
2.3 Expected confirmation
Olshavsky and Miller [30] research on customer expectation, product performance and customer perceived product quality. Expectation model holds that customer satisfaction is an emotional state obtained by comparing the expected service quality of customers with the actual perceived service quality [31, 32]. When the expectation is greater than the perception, the customer will feel dissatisfied, and when the expectation is less than the perception, the customer will feel satisfied. Expectations here may come from both objective experience and subjective wishes [33]. Similarly, introducing these ideas and expectation models into the higher education environment, customer expectations of service quality can be replaced with student expectations, and customer satisfaction is an emotional state obtained by comparing expectations with actual perceptions, and is the result obtained after comparison, that is, expectations are determined. Therefore, this paper makes the following inferences.
Hypothesis 6: perceived value has a positive effect on expected confirmation.
2.4 Choice behavior
Choice behavior includes emotional factors and evaluation factors. Emotional factors are based on people's subjective psychological state, while evaluation factors are judged by "expected value model". Since attitudes can be changed, students' behavioral attitudes may be influenced by educators and practitioners. Educators can change students' perceptions and feelings about entrepreneurship by fostering their attitudes of innovation, pursuit of achievement and self-esteem [34]. There is a high correlation between students' behavioral attitudes and students' behavioral intentions [35], there are few respondents with high individual behavioral attitudes and low behavioral intentionality for specific behaviors. Positive behavioral attitudes are a good starting point for stimulating students' behavioral intentions. The research on behavioral intention is more concentrated in the field of marketing, and the research on students' behavioral intention in the field of education is relatively small. The concept of students' behavioral intention can still judge whether students are loyal to the school from two aspects of attitude and behavior. From the perspective of students' emotional attitude towards school, students' behavioral intention is a psychological commitment based on students' satisfaction [36]. Higher satisfaction indicates more certain expectation confirmation and increases the occurrence of choice behavior. This paper wants to examine whether college students are more likely to choose online learning when they find it helpful. Therefore, this paper proposes the following hypothesis:
Hypothesis 7: Expectation confirmation has a positive effect on choice behavior.
3.1 Research sample
In this study, to study the current full-time higher vocational college students in China as the research object, according to the alumni association in 2022, the dominant disciplines of higher vocational colleges in China (engineering, science, humanities and social sciences) were classified and evaluated, and the top three nine higher vocational colleges in each category were comprehensively ranked. Including the Yellow River Water Conservancy Vocational and Technical College, Changsha Civil Affairs Vocational and Technical College, and Wuxi Vocational and Technical Institute, which ranked the top three in the engineering category; Shenzhen Polytechnic, Jiujiang Polytechnic, and Wuhan Polytechnic College, which ranked the top three in the science category; Shandong Business Polytechnic, Jiangsu Economic and Trade Polytechnic, and Jiangsu Agriculture and Forestry Polytechnic, which were ranked the top 3 in the humanities and social sciences category. The subjects of the survey are the freshmen, sophomores and juniors of higher vocational colleges, unless otherwise specified, generally referring to the students who are receiving education in higher vocational colleges.
According to the 2020 National Statistical Bulletin on the Development of Education published by the Ministry of Education of China, the number of full-time college and higher vocational college students in China is 14,595,488. The number of samples in this study is based on the sample calculation formula n = N/ [1 + N (e)2], where N is the total number of subjects in this study, e is the maximum acceptable error range (5%), and N is the number of samples. Therefore, the number of samples in this study is n = 14595488/ [1 + 14595488 (0.05)2] ≈ 400.
3.2 Data analysis method
This paper uses SPSS 26.0 and AMOS 24.0 software to analyze and interpret the collected questionnaire data. Firstly, data cleaning was performed on the collected data to eliminate the invalid questionnaires. Second, the reliability of the questionnaire was analyzed using SPSS software, while exploratory factor analysis was used to verify the correspondence between variables and measure models, and then aggregation validity and discrimination validity were analyzed. Then, confirmatory factor analysis was done using AMOS software to build a research model based on the hypothesized relationships. Finally, model fit was analyzed, and to verify the direct and mediating effects.
4.1 Reliability analysis
Table 1. Total Cronbach’s alpha
|
Reliability statistics |
||
|
Cronbach’s alpha |
Cronbach’s alpha based on normalized term |
Number of items |
|
.908 |
.918 |
22 |
Table 2. Cronbach’s alpha for each observed variable
|
Item total statistics |
|||||
|
|
Scaled Average After Deletion |
Scaled Variance after Deletion |
Corrected items and total correlation |
Squared multiple correlations |
Cronbach’s alpha after item deleted |
|
PV1 |
42.18 |
101.652 |
.409 |
.465 |
.905 |
|
PV2 |
42.00 |
94.242 |
.607 |
.492 |
.904 |
|
SE1 |
41.71 |
95.884 |
.512 |
.437 |
.906 |
|
SE2 |
41.77 |
90.596 |
.719 |
.758 |
.900 |
|
SE3 |
41.75 |
90.858 |
.688 |
.735 |
.901 |
|
SE4 |
41.61 |
90.655 |
.758 |
.770 |
.900 |
|
SE5 |
41.64 |
90.621 |
.732 |
.756 |
.900 |
|
SVO1 |
41.23 |
93.049 |
.528 |
.457 |
.904 |
|
SVO2 |
41.39 |
88.267 |
.788 |
.701 |
.898 |
|
SVO3 |
41.73 |
89.794 |
.652 |
.573 |
.901 |
|
SVO4 |
41.11 |
86.257 |
.652 |
.566 |
.902 |
|
EC1 |
41.67 |
95.295 |
.503 |
.457 |
.905 |
|
EC2 |
41.90 |
94.453 |
.645 |
.581 |
.904 |
|
ECO1 |
41.93 |
91.647 |
.394 |
.355 |
.909 |
|
ECO2 |
41.86 |
91.074 |
.461 |
.352 |
.907 |
|
ECO3 |
42.43 |
95.508 |
.341 |
.292 |
.908 |
|
ECO4 |
41.44 |
85.657 |
.571 |
.483 |
.906 |
|
ECO5 |
41.86 |
90.766 |
.504 |
.392 |
.905 |
|
ECO6 |
41.72 |
94.216 |
.557 |
.469 |
.904 |
|
ECO7 |
41.05 |
88.400 |
.565 |
.459 |
.904 |
|
CB1 |
42.27 |
95.391 |
.527 |
.460 |
.905 |
|
CB2 |
42.42 |
95.279 |
.578 |
.533 |
.905 |
The reliability and validity of the questionnaire data were analyzed for this research. In Table 1, the total Cronbach α value is 0.908, and in Table 2, the Cronbach α values of 22 factors ranges from 0.900 to 0.909, which are all greater than the reference value 0.7 [37]. The research data shows that the questionnaire was well designed for this study and it has good reliability.
4.2 Validity analysis
Exploratory factor analysis (EFA) was used to measure the construct validity of the questionnaire in this study. In Table 3, the KMO value equals to 0.945, which is bigger than 0.7, and the Bartlett spherical test value reaches the significance level of P-value is less than 0.000. Additionally, in Table 4, the cumulative solution difference of each variable is greater than 60%. The research result indicated that the content of the item can explain most of the information of this variable, and this study has good reliability. In addition, it can be seen in Table 4, the Factor loading of all Variables are greater than 0.5 [38], and the results present that the questionnaire designed in this study has good construct validity. It can be seen from Table 3, the cumulative percentage for the first ingredient is less than 50%, which expressed that the serious common method bias was not exist in questionnaire, and the research data is acceptable for this study.
Table 3. KMO and Bartlett sphericity test
|
KMO sampling appropriateness measure |
.907 |
|
|
Bartlett sphericity test |
Approximate chi-square |
1662.957 |
|
Degrees of freedom |
231 |
|
|
Significance |
.000 |
|
Table 4. Exploratory factor analysis
|
Rotated constituent matrixa |
||||||
|
|
Ingredient |
|||||
|
1 |
2 |
3 |
4 |
5 |
6 |
|
|
SVO3 |
.520 |
|
|
|
|
|
|
SVO1 |
.676 |
|
|
|
|
|
|
SVO4 |
.641 |
|
|
|
|
|
|
SVO2 |
.645 |
|
|
|
|
|
|
SE4 |
|
.574 |
|
|
|
|
|
SE5 |
|
.525 |
|
|
|
|
|
SE3 |
|
.606 |
|
|
|
|
|
SE2 |
|
.599 |
|
|
|
|
|
SE1 |
|
.647 |
|
|
|
|
|
CB1 |
|
|
.797 |
|
|
|
|
CB2 |
|
|
.755 |
|
|
|
|
EC1 |
|
|
|
.613 |
|
|
|
EC2 |
|
|
|
.530 |
|
|
|
ECO1 |
|
|
|
|
.761 |
|
|
ECO4 |
|
|
|
|
.658 |
|
|
ECO2 |
|
|
|
|
.642 |
|
|
ECO7 |
|
|
|
|
.611 |
|
|
ECO5 |
|
|
|
|
.521 |
|
|
ECO6 |
|
|
|
|
.687 |
|
|
ECO3 |
|
|
|
|
.740 |
|
|
PV1 |
|
|
|
|
|
.916 |
|
PV2 |
|
|
|
|
|
.534 |
|
Extraction method: principal component analysis Rotation method: Kaiser normalized maximum variance method. |
|
|||||
|
a. The rotation has converged after 7 iterations. |
|
|||||
Table 5. Common method bias test
|
Total variance interpretation |
|||||||||
|
Ingredient |
Initial eigenvalue |
Extract the sum of the load squares |
The sum of the squares of the rotating loads |
||||||
|
Total |
Percent variance |
Cumulative percentage |
Total |
Percent variance |
Cumulative percentage |
Total |
Percent variance |
Cumulative percentage |
|
|
1 |
8.845 |
40.206 |
40.206 |
8.845 |
40.206 |
40.206 |
4.529 |
20.585 |
20.585 |
|
2 |
1.693 |
7.694 |
47.900 |
1.693 |
7.694 |
47.900 |
3.313 |
15.057 |
35.642 |
|
3 |
1.193 |
5.421 |
53.321 |
1.193 |
5.421 |
53.321 |
2.606 |
11.844 |
47.486 |
|
4 |
1.114 |
5.063 |
58.384 |
1.114 |
5.063 |
58.384 |
2.259 |
10.267 |
57.753 |
|
5 |
1.008 |
4.581 |
62.965 |
1.104 |
5.002 |
59.452 |
2.001 |
10.021 |
58.795 |
|
6 |
.980 |
4.457 |
67.422 |
1.008 |
4.581 |
62.965 |
1.147 |
5.212 |
62.965 |
|
7 |
.845 |
3.840 |
71.262 |
|
|
|
|
|
|
|
Extraction method: principal component analysis |
|||||||||
In this study, confirmatory factor analysis (CFA) model was established to test the validity of data. The data in Table 5 shows that the value of GFI, CFI, IFI are bigger than 0.8, AGFI is higher than 0.9, and RMSEA is less than 0.08, which illustrated that the model fit of CFA is acceptable [39]. Then, in Table 6, The Composite Reliability (CR) of the six dimensions are between 0.837 and 0.952, which are greater than the reference value of 0.7, indicating that the CFA model has good convergent validity. In addition, the convergent validity of the model is reflected in Table 6, and the average variance Extracted (AVE) value of each dimension is greater than 0.5, which conforms to the reference value [40], Then, the square root value of AVE for each dimension is greater than the correlation value between this dimension and other dimensions, which reflects that this study has good discriminant validity of the research data (Table 7). In general, according to the relevant indicators, the research data in this study has good validity.
Table 6. Model fit of CFA
|
CMIN/DF |
GFI |
CFI |
RMSEA |
IFI |
AGFI |
|
1.866 |
0.816 |
0.884 |
0.076 |
0.887 |
0.916 |
Table 7. Discriminant validity analysis
|
|
AVE |
SVO |
ECO |
PV |
SE |
EC |
CB |
|
SVO |
0.832 |
0.912 |
|
|
|
|
|
|
ECO |
0.690 |
0.867 |
0.831 |
|
|
|
|
|
PV |
0.666 |
0.827 |
0.686 |
0.816 |
|
|
|
|
SE |
0.608 |
0.841 |
0.711 |
0.850 |
0.780 |
|
|
|
EC |
0.631 |
0.899 |
0.738 |
0.086 |
0.691 |
0.794 |
|
|
CB |
0.607 |
0.761 |
0.562 |
0.827 |
0.692 |
0.761 |
0.779 |
4.3 Mediating effect analysis
Table 8. Mediating analysis
|
Mediated Path Hypothesis |
Mediating effect value |
LLCI |
ULCI |
P |
|
ECO-SE-EC |
0.026 |
0.003 |
0.051 |
0.012 |
|
SVO-SE-EC |
0.016 |
0.001 |
0.032 |
0.021 |
|
ECO-PV-SE |
0.019 |
0.001 |
0.046 |
0.024 |
|
SVO-PV-SE |
0.036 |
0.012 |
0.064 |
0.033 |
|
ECO-PV-EC |
0.024 |
0.001 |
0.053 |
0.041 |
|
SVO-PV-EC |
0.033 |
0.001 |
0.056 |
0.038 |
|
SE-EC-CB |
0.042 |
0.002 |
0.041 |
0.035 |
|
PV-SE-EC |
0.073 |
0.039 |
0.111 |
0.001 |
|
ECO-SE-EC-CB |
0.011 |
0.003 |
0.022 |
0.003 |
|
SVO-SE-EC-CB |
0.059 |
0.032 |
0.088 |
0.001 |
|
ECO-PV-EC-CB |
-0.004 |
-0.029 |
0.024 |
0.808 |
|
SVO-PV-EC-CB |
0.014 |
-0.024 |
0.048 |
0.486 |
|
ECO-PV-SE-EC-CB |
0.013 |
0.002 |
0.028 |
0.038 |
|
SVO-PV-SE-EC-CB |
0.022 |
0.003 |
0.024 |
0.011 |
In this study, AMOS was applied to set the Bootstrap confidence interval to 95%, and all mediating effect paths were detected. When the interval between the lower LLCI and upper ULCI contained 0, it means the mediating path was insignificant [41]. It can be seen from Table 8 that the LLCI to ULCI interval of ECO-PV-EC-CB and SVO-PV-EC-CB mediating path paths contain 0, and the P-value of these two paths are greater than 0.05, indicating that the two indirect paths are insignificant. Among the other significant mediating paths, the path of PV-SE-EC shows the largest mediating effect value, while the remote mediating path of ECO-PV-SE-EC-CB has the smallest mediating effect value. It reveals the student expectation factor plays significant mediating role in students’ choice behavior.
4.4 Structural equation model
The SEM model helped this study analyze the paths of variables and clarify the relationship between factors. The model fit index of SEM showed that the model had a good fit. In Figure1, squared multiple correlation (SMC) of each observed variable, factor loading and path coefficient value between variables can be seen. For example, The SMC value of ECO1 was 0.51, indicating that the observed variable explained 51% of the potential variable economic value orientation. In addition, the factor loading value of all potential variables were greater than 0.5, which reached the reference value and support the analysis of the research model [42], and factor loading for some variables exceeded 0.7, which even reaching the ideal reference value. For instance, the factor loading values of the three potential variables for EC were 0.78, 0.83, 0.84 respectively.
Figure 1. Structural equation model
4.6 Standard path coefficient analysis
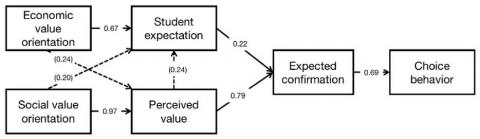
Figure 2. Path coefficient analysis
According to the data from SEM model, this study draws the path analysis chart of variables. The data shown are standardized results. It can be seen from Table 9 that there are three paths with P-values greater than 0.05, which are ECO to PV, SVO to SE, PV to SE. It indicates that the hypothesis of the three paths is not valid. Among the remaining five paths marked as dashed lines in the Figure 2, SVO shows the largest path coefficient for SE with the value of 0.97, denotes that the variable of SVO has a very strong positive impact on students' expectation factors. Additionally, the perceived value on expected conformation also shows high path coefficient of 0.79. Then, independent variable of economic value orientation presents strong Influence on student expectation with the value of 0.67. The mediating variable of expected conformation exhibits strong effect on choice behavior of 0.69. However, students’ expectation has the smallest influence on expected confirmation, showing a path coefficient strength of 0.22, and it is much less than the effect of PV on EC, which indicates that the less importance influence of student expectation on expected confirmation.
Table 9. Mediating effect analysis
|
|
|
|
Estimate |
S.Estimate |
S.E. |
C.R. |
P |
|
ECO |
<--- |
SVO |
.698 |
.972 |
.109 |
6.381 |
*** |
|
ECO |
<--- |
ECO |
-.037 |
.240 |
.096 |
-.382 |
.703 |
|
SE |
<--- |
ECO |
.636 |
.665 |
.098 |
6.512 |
*** |
|
SE |
<--- |
PV |
.046 |
.135 |
.231 |
.198 |
.843 |
|
SE |
<--- |
SVO |
.188 |
.200 |
.207 |
.909 |
.363 |
|
EC |
<--- |
SE |
.245 |
.222 |
.083 |
2.943 |
.003 |
|
EC |
<--- |
EC |
.142 |
.790 |
.139 |
8.239 |
*** |
|
CB |
<--- |
EC |
.810 |
.692 |
.069 |
11.724 |
*** |
Based on the expectation confirmation theory (ECT) model, this study combines the perceived value theory, theory of planned behavior, and the Expectation value Theory, to introduces two influencing factors, which were social value orientation and economic value orientation, and exploring students' choice behavior in higher vocational colleges. The research results show that students' social value orientation has a very strong influence on perceived value factors. The research data even present that the degree of students' value orientation means the students' perceived value towards the college. Further, students' perceived value to higher vocational colleges strongly affects their expectation confirmation to the college’s overall service. When students' expectation is high, students are more inclined to choose the college. Another independent variable of economic value orientation, which also has a great influence on student expectation dimension, but the impact of students' expectation of the college on expected confirmation is far less than that of students' perceived value. It is worth noting that the interaction exists between the economic value orientation dimension and the perceived value, otherwise the social value orientation only affects perceived value factor.
[1] Ji-Hyland, C., Allen, D. (2022). What do professional drivers think about their profession? An examination of factors contributing to the driver shortage. International Journal of Logistics Research and Applications, 25(3): 231-246. https://doi.org/10.1080/13675567.2020.1821623
[2] Liqin, S. (2022). Research on the cultivation strategy of higher vocational students' professional quality from the perspective of the world skills competition. Adult and Higher Education, 4(4): 26-34. https://doi.org/10.23977/aduhe.2022.040405
[3] Koo, A. (2016). Expansion of vocational education in neoliberal China: Hope and despair among rural youth. Journal of Education Policy, 31(1): 46-59. https://doi.org/10.1080/02680939.2015.1073791
[4] Xiong, W., Yang, J., Shen, W. (2022). Higher education reform in China: A comprehensive review of policymaking, implementation, and outcomes since 1978. China Economic Review, 72: 101752. https://doi.org/10.1016/j.chieco.2022.101752
[5] Liu, X., Chen, Y., Yang, Y., Liu, B., Ma, C., Craig, G. R., Gao, F. (2022). Understanding vocational accounting students’ attitudes towards sustainable development. Journal of Vocational Education & Training, 74(2): 249-269. https://doi.org/10.1080/13636820.2020.1760333
[6] Abad-Segura, E., González-Zamar, M.D. (2021). Sustainable economic development in higher education institutions: A global analysis within the SDGs framework. Journal of Cleaner Production, 294: 126133. https://doi.org/10.1016/j.jclepro.2021.126133
[7] Mok, K.H., Xiong, W., Ke, G., Cheung, J.O.W. (2021). Impact of COVID-19 pandemic on international higher education and student mobility: Student perspectives from mainland China and Hong Kong. International Journal of Educational Research, 105: 101718. https://doi.org/10.1016/j.ijer.2020.101718
[8] Russell, B. (2005). Analysis of mind. Routledge. https://doi.org/10.4324/9780203996515
[9] Abbas, J. (2020). HEISQUAL: A modern approach to measure service quality in higher education institutions. Studies in Educational Evaluation, 67: 100933. https://doi.org/10.1016/j.stueduc.2020.100933
[10] Purgailis, M., Zaksa, K. (2012). The impact of perceived service quality on student loyalty in higher education institutions. Journal of Business Management, 4(6): 138-152.
[11] Cheng, Y.C., Tam, W.M. (1997). Multi-models of quality in education. Quality assurance in Education, 5(1): 22-31. https://doi.org/10.1108/09684889710156558
[12] Porter, W.W., Graham, C.R., Spring, K.A., Welch, K.R. (2014). Blended learning in higher education: Institutional adoption and implementation. Computers & Education, 75: 185-195. https://doi.org/10.1016/j.compedu.2014.02.011
[13] Pucciarelli, F., Kaplan, A. (2016). Competition and strategy in higher education: Managing complexity and uncertainty. Business Horizons, 59(3): 311-320. https://doi.org/10.1016/j.bushor.2016.01.003
[14] Hong, C.Z. (2007). Research on SERVQUAL model of higher education service quality abroad and its enlightenment. Education and Examination, 2007(6): 67-74.
[15] Fan, W., Wolters, C.A. (2014). School motivation and high school dropout: The mediating role of educational expectation. British Journal of Educational Psychology, 84(1): 22-39. https://doi.org/10.1111/bjep.12002
[16] Ravindran, S.D., Kalpana, M. (2012). Student's expectation, perception and satisfaction towards the management educational institutions. Procedia Economics and Finance, 2: 401-410. https://doi.org/10.1016/S2212-5671(12)00102-5
[17] Wang, S. (2009). The construction of student satisfaction evaluation index system for foreign students' education in China-a case study of colleges and universities in Hebei Province. China Economic and Trade Guide, 2009(24): 116-116.
[18] Joung, H.W., Choi, E.K., Wang, E. (2016). Effects of perceived quality and perceived value of campus foodservice on customer satisfaction: Moderating role of gender. Journal of Quality Assurance in Hospitality & Tourism, 17(2): 101-113. https://doi.org/10.1080/1528008X.2015.1042620
[19] Sumaedi, S., Bakti, I.G.M.Y., Metasari, N. (2011). The effect of students’ perceived service quality and perceived price on student satisfaction. Management Science and Engineering, 5(1): 88-97. http://dx.doi.org/10.3968/j.mse.1913035X20110501.010
[20] Brizi, A., Giacomantonio, M., Schumpe, B.M., Mannetti, L. (2015). Intention to pay taxes or to avoid them: The impact of social value orientation. Journal of Economic Psychology, 50: 22-31. https://doi.org/10.1016/j.joep.2015.06.005
[21] Murphy, R.O., Ackermann, K.A. (2014). Social value orientation: Theoretical and measurement issues in the study of social preferences. Personality and Social Psychology Review, 18(1): 13-41. https://doi.org/10.1177/1088868313501745
[22] Murphy, R.O., Ackermann, K.A., Handgraaf, M. (2011). Measuring social value orientation. Judgment and Decision Making, 6(8): 771-781. http://dx.doi.org/10.2139/ssrn.1804189
[23] Liu, H. (2011). The value orientation of science education in Kindergarten. Research on Preschool Education, 2011(5): 64-66.
[24] Choma, B.L., Hanoch, Y., Hodson, G., Gummerum, M. (2014). Risk propensity among liberals and conservatives: The effect of risk perception, expected benefits, and risk domain. Social Psychological and Personality Science, 5(6): 713-721. https://doi.org/10.1177/1948550613519682
[25] Zhang, L., Zhang, C., Shang, L. (2016). Sensation-seeking and domain-specific risk-taking behavior among adolescents: Risk perceptions and expected benefits as mediators. Personality and individual differences, 101: 299-305. https://doi.org/10.1016/j.paid.2016.06.002
[26] Ansong, D., Chowa, G.A., Sherraden, M. (2015). Household assets, academic expectations, and academic performance among Ghanaian junior high school students: Investigating mediation. Children and Youth Services Review, 50: 101-110. https://doi.org/10.1016/j.childyouth.2015.01.016
[27] Shifrer, D. (2013). Stigma of a label: Educational expectations for high school students labeled with learning disabilities. Journal of Health and Social Behavior, 54(4): 462-480. https://doi.org/10.1177/0022146513503346
[28] Valeeva, R.A., Rybakova, L.A. (2014). The role of youth organization in the development of higher educational institutions students’ humanistic value orientations. Procedia-Social and Behavioral Sciences, 141: 817-821. https://doi.org/10.1016/j.sbspro.2014.05.142
[29] Amrai, K., Zalani, H.A., Arfai, F.S., Sharifian, M.S. (2011). The relationship between the religious orientation and anxiety and depression of students. Procedia-Social and Behavioral Sciences, 15: 613-616. https://doi.org/10.1016/j.sbspro.2011.03.150
[30] Olshavsky, R.W., Miller, J.A. (1972). Consumer expectations, product performance, and perceived product quality. Journal of Marketing Research, 9(1): 19-21. https://doi.org/10.1177/002224377200900105
[31] Bhattacherjee, A. (2001). Understanding information systems continuance: An expectation-confirmation model. MIS Quarterly, 25(3): 351-370. https://doi.org/10.2307/3250921
[32] Lee, M.C. (2010). Explaining and predicting users’ continuance intention toward e-learning: An extension of the expectation–confirmation model. Computers & Education, 54(2): 506-516. https://doi.org/10.1016/j.compedu.2009.09.002
[33] Klaaren, K.J., Hodges, S.D., Wilson, T.D. (1994). The role of affective expectations in subjective experience and decision-making. Social Cognition, 12(2): 77-101. https://doi.org/10.1521/soco.1994.12.2.77
[34] Robinson, P.B., Stimpson, D.V., Huefner, J.C., Hunt, H.K. (1991). An attitude approach to the prediction of entrepreneurship. Entrepreneurship Theory and Practice, 15(4): 13-32. https://doi.org/10.1177/104225879101500405
[35] Autio, E., Keeley, R.H., Klofsten, M., Parker, G.G.C., Hay, M. (2001). Entrepreneurial intent among students in Scandinavia and in the USA. Enterprise and Innovation Management Studies, 2(2): 145-160. https://doi.org/10.1080/14632440110094632
[36] Zhang, G., Yue, X., Ye, Y., Peng, M. (2021). Understanding the Impact of the Psychological Cognitive Process on Student Learning Satisfaction: Combination of the Social Cognitive Career Theory and SOR Model. Frontiers in Psychology, 12: 712323. https://doi.org/10.3389/fpsyg.2021.712323
[37] Carmines, E.G., Zeller, R.A. (1979). Reliability and validity assessment. Sage publications.
[38] Hair, J.F. (2005). Jr., anderson, re, tatham, rl & black, wc 1998. multivariate data analysis. Prentice-Hall lnc., New Jersey. XX, 730, 12-55.
[39] Bentler, P.M., Bonett, D.G. (1980). Significance tests and goodness of fit in the analysis of covariance structures. Psychological Bulletin, 88(3): 588. https://doi.org/10.1037/0033-2909.88.3.588
[40] Fornell, C., Larcker, D.F. (1981). Evaluating structural equation models with unobservable variables and measurement error. Journal of marketing research, 18(1): 39-50. https://doi.org/10.1177/002224378101800104
[41] Preacher, K.J., Hayes, A.F. (2008). Asymptotic and resampling strategies for assessing and comparing indirect effects in multiple mediator models. Behavior Research Methods, 40(3): 879-891. https://doi.org/10.3758/BRM.40.3.879
[42] Kaiser, H.F., Rice, J. (1974). Little jiffy, mark IV. Educational and psychological measurement, 34(1): 111-117. https://doi.org/10.1177/001316447403400115