Fikri Hasfita* | Emenda Sembiring | Enri Damanhuri
© 2022 IIETA. This article is published by IIETA and is licensed under the CC BY 4.0 license (http://creativecommons.org/licenses/by/4.0/).
OPEN ACCESS
The increasing number of city park waste / open spaces will contribute to increase the number of city park waste. This study aims to predict waste generation and analyze city park waste’s potential as biofuels. The observation was conducted on ten thematic parks in Bandung city. The waste generation model was developed based on the number of trees, season, and park area. The average waste generation is 0.44±0.24 tons/day/park. The seasonal changes’ effect in parks had a significant impact with a P-value of 0.02 < 0.05. The most significant variable of the city park’s waste generation is the number of trees in every park with a P-value = 0.0002 < 0.05 generation model = 0.5435(number of tree) - 0.6783. The characteristics of sulfur and moisture are 0.31% and 2.6% respectively, while carbon content is high as much as 40.45%. The heating value is 15.2 MJ/Kg, and fixed carbon is 72%, while the cellulose is 21.87%. The study concluded that the city parks’ waste is potential as raw material for biofuel or transformed into other energy materials.
city park waste, green open space, characterization, waste generation, bio fuel
Green open space biomass, which includes park waste, is an abundant but underutilized source of renewable energy raw materials [1, 2]. Accumulation of wastes without proper management leads to different environmental problems, such as the excessive release of greenhouse gases into the atmosphere. In addition, it has led to a shortage of available areas for waste disposal, resulting in [3] unsustainable waste management [4], and in most countries, these issues are of serious public health concern [5-7]. Therefore, an analysis of the generation and characterization of leaf waste biomass from the Bandung City Thematic Park was conducted to provide solutions for handling garden waste.
Bandung is one of the cities with the most well-known waste issues, and the accumulation of garbage has become a daily sight, decreasing environmental quality. The existence of green open spaces is an effort of the government to overcome environmental problems. There is an obligation to equip urban areas with 30% green open space based on the Regulation of the Minister of Public Works Number 05/PRT/M/2008. Undeniably, the amount of waste generated will also increase with the increasing number of green open spaces. Bandung City has a high volume of waste growth every year, with the generation reaching an average of 1,477 tons per day. Organic waste, such as urban solid from the city park, makes up the bulk, accounting for 63% or approximately 930 tons. (Data from DLHK Bandung City). There are many green open spaces in Bandung Indonesia, such as the trending thematic parks similar to city parks in functions. Geographic factors such as seasons and weather influence the types and number of wastes generated. The city park, which should be free of trash, is currently filled with leaves, plastics, snacks, and fabric trash. Leaf litter has the most significant volume compared to other types. The composition of the wastes was 11.6% in 2016 but reached the highest level in 2017 at 32.2%, equivalent to 515.2 m3/day compared with other waste types such as 19.2% food scraps, 10.8% paper, 11.8% plastics, 3.5% clothes, 1.9% rubber and leather, 3.6% glass, and others 21.3%. These increase in number as new parks and green open spaces are constructed (Data from the Bandung Sanitation Department, 2017). The increasing amount of park waste raises problems, especially regarding limited landfills and ineffective processing technology. Until now, the local government of Bandung city still has not found the best solution to the waste problem. The sanitation department has devised some alternatives however, there are still controversies since it is not entirely supported. Park waste management had been conducted by composting only 1%, some of it was burned, and the rest was dumped into the TPA.
The Generation, composition, and characteristics of waste are very supportive things in developing a management system for waste in an area, especially in residential areas. The problem must be available in order to develop an alternative good waste management system. Changes in seasonal rainfall patterns such as wetter winters and drier summers with a greater likelihood of drought can alter the overall hydrology of waste management. In summer it is drier but the concentration of organic waste streams is higher [8]. Research results reported that the highest values were found in summer for the organic waste from Astana city, Kazakhstan [9]. Waste generation for January was around half that for December in a traditional African city [10]. This information is supported by the results of research by Adeleke et al. [11] that the effective factor of generation is influenced and composition follows different patterns in different places at different locations at different times and seasons. Studies related to waste generation were reported by Shu et al. [12-14].
City park waste is complicated to analyze and characterize due to its significant seasonality and variation. However, environmental advantage estimation of differentiated management, such as using woody portions for energy and introducing home composting for tiny fractions of garden waste, requires a precise definition of the various material fractions of garden waste. Generation and characteristics are required to establish the availability of raw materials.
In sufficient numbers and the appropriate and sustainable technology. Furthermore, several studies have related to the conversion of park waste into energy in several countries. determined the amount of waste generated and analyzed the energy produced. Wastes collected from various gardens in the United States were examined five times in the spring and summer, at various composting facilities, for their physical and chemical characteristics as well as combustion values [15]. Furthermore, sampled wastes in Aarhus, Denmark, based on seasons, and studied them to learn about the gasification process, a significant component of park waste The considerable variation in the leaves' composition depends on the location, and the age of the trees, and the season [16].
Little data and statistics are available regarding city park waste generation. Studies related to the generation and characteristic park waste are still minimal. This study aims to predict a waste model generation and analyze the potential of city park waste as a biofuel feedstock based on its generation and characteristics. The waste generation variables are seasons, the number of trees, and the area of the park. The characteristic includes calorific value, FTIR, XRF, CHNSO analysis, and FTIR The results obtained can be developed in waste management in urban green open spaces and expand in many cities to realize a national energy policy while protecting the environment by reducing the greenhouse effect.
2.1 Study area
As one of the most developed cities in Indonesia, Bandung is the capital of the province of West Java. It was constructed 50,000 years ago by a volcanic explosion [17], and has 768 city parks, with an area of 2,032.21 Ha. The object of research is public open space in the form of city-scale thematic parks within the area of Bandung City. The public open spaces sampled were Lansia, Photo, Maluku, Inklusi, Cibeuying, Pranatayuda, Tongkeng, Pet, Musik, and Superhero Parks. Meanwhile, the city has a complete waste problem, especially the limited place for final disposal. The average age of the plants studied is 10 to 20 years with tall plants. The total generated produces 1,600 tons/day of solid waste daily, including waste from gardens. The map of Bandung City’s position is shown in Figure 1(a) and the Geographic location of the study area in Bandung City, West Java, Indonesia is shown in Figure 1(b). The area and number of tree plant information are shown in Table 1 and Type and age of Bandung city park plants shown in Table 2.
2.2 Equipment and material
The weight of waste samples was conducted using scales with a capacity of 50 kg, and heavy-weight tarps were used as containers for sorting and mixing waste. Box sampling size 20 x 20 x100 cm was used to measure the volume of waste, and a rolling meter is used to measure the area of the park, tools such as rubber gloves, brooms, and plastic bags are needed to collect and preserve waste samples for analysis.
Table 1. Number of trees and the park area with an average amount of waste generated
|
City park |
Park area (m2) |
Number of trees |
|
Lansia |
9461.2 |
270 |
|
Inklusi |
1187.4 |
134 |
|
Maluku |
3375.0 |
332 |
|
Cibeunying |
2892.3 |
40 |
|
Superhero |
1153.6 |
30 |
|
Tongkeng |
2030.6 |
18 |
|
Photo |
1004.0 |
15 |
|
Pet |
1000.0 |
126 |
|
Pranata Yuda |
1198.1 |
87 |
|
Musik |
1181.2 |
10 |
Table 2. Type and age of Bandung city park plants
|
City park name |
Plant type |
Plant age (years) |
|
Lansia |
Mahoni (Switenia mahagoni), Ganitri (Elaeocarpus sphaericus Schum), Pinus (Pinus merkusi) dan nusa indah (Mussenda frondose), kemiri (Cerbera odollam), beringin (Ficus benjamina), Damar (Agathis alba). |
±10-30 |
|
Inklusi |
Angsana (Pterocarpus indicus), Ki hujan (Albizia saman), Trembesi (Albizia saman). Saga (Denanthera pavonina L). |
±10-30 |
|
Maluku |
Ganitri (Elaeocarpus ganitrus), Cemara angin (Casuarina equisetifolia), Tanjung (Mimusops elengi), Kenari (Canarium commune), Damar (Agathis alba), Mahoni (Switenia mahagoni), Kaca piring (Gardeni ajasminoides). |
±10-30 |
|
Cibeunying |
Angsana (Pterocarpus indicus), Ki hujan (Albizia saman), Polyalthia longifolia (glodokan), Tanjung (Mimusops elengi). |
±10-30 |
|
Superhero |
Mahoni (Switenia mahagoni), tanjung (Mimusops elengi), Mahoni (Switenia mahagoni), Nangka (Artocarpuschampeden). |
±10-30 |
|
Tongkeng |
Mahoni (Switenia mahagoni), Trembesi (Albizia saman), Tanjung (Mimusops elengi). |
±10-30 |
|
Photo |
Mahoni (Switenia mahagoni), beringin (Ficus benjamina), Tanjung (Mimusops elengi), Ki hujan (Albizia saman). |
±10-30 |
|
Pet |
Sukun (Artocarpus altilis), Mahoni (Switenia mahagoni), Acacia mangium, Artocarpus heterphyllu, Eucalyptus alba (Ampupu/leda), Polyalthia longifolia (glodokan), Pinus merkusii. |
±10-30 |
|
Pranatayuda |
Angsana (Pterocarpus indicus), Ki hujan (Albizia saman), Mahoni (Switenia mahagoni), beringin (Ficus benjamina), Akasia (Acacia mangium Willd) |
±10-30 |
|
Musik |
Mahoni (Switenia mahagoni), Flamboyan (Delonix regia), trembesi (Albizia saman) |
±10-30 |
2.3 Methodology
2.3.1 Generation of park waste
Analysis of the generation and composition of ten waste samples was carried out from Bandung City Park. Measurements and sampling were conducted for four months during the rainy and dry seasons, from June to September. The measurement of waste generated from the different park locations was conducted using a digital scale (WeiHeng, China). Sampling was carried out five times a week and monitored for four months. The amount of park waste was analyzed based on the area (kg/m2/day), type of garden, seasons in dry and rainy seasons, and the number of plant species (kg/number of tree/day). Garden type is used as a waste generation variable, related to the number, area of the park, and types of plants based on the theme of the park. For example, Tongkeng Park, Superhero Park, Cibeunying, Musik Park, and Photo Park are designed for children's and youth's playgrounds with a small number of trees, medium-sized plants, and a relatively small park size. Lansia park, pet park, and Maluku park are designed as a nature park in the city designed with a varied number of plants, and a large garden design, consisting more of high-level plants such as Mahogany, Angsana, Banyan trees, and others. The pet park is designed as a pet playground with a large garden design, more trees, high-level plants, and others so that the type of park gives a different waste generation.
(a)
(b)
Figure 1. Research Location; (a) The map of Bandung City's position and (b) the Geographic location of the study area in Bandung City, West Java, Indonesia
2.3.2 Characterization of park waste
The samples were randomly taken in the different areas of the garden, stirred, and about 2 kg were stored in plastic to maintain the original moisture content before being subjected to the characterization tests. The leaves were crushed using a blender and sieved with a 20 mesh-screener 157 (425-850 µm). The samples were dried in an oven to below ten wt% moisture content at a temperature of 105℃ for 24 h. Furthermore, the characterization was conducted on ten mixed and treated city park waste examples. These were then subjected to proximate and ultimate analyses, characterized based on the cellulose, hemicellulose, and lignin contents before passing through XRF (X-ray fluorescence) and Fourier Transform Infrared (FTIR).
(1) Proximate, ultimate, and calorific value analysis
The proximate analysis calculated the moisture, ash, volatile solids, and carbon contents using the gravimetric method. These values were measured using an oven and furnace following the ASTM standard at the ITB. Environmental Engineering Hazardous Waste Laboratory before performing the ultimate analysis. C, H, N, and S's elemental composition was analyzed using a CHNS analyzer conducted at the Tekmira Bandung Laboratory. According to ASTM, the calorific values were calculated using a Bomb Calorimeter (Parr 1261, Volt: 230V50/60Hz).
(2) Cellulose, hemicellulose, and lignin analysis
The lignocellulosic biomass wt.% composition of cellulose, hemicellulose and lignin was determined by chemical methods at the Center for Pulp and Paper Laboratory, Bandung Regency, and the detailed procedure was described by Pasangulapati et al. [18]. Biomasses were previously sampled and prepared through TAPPI T257 and conditioned through TAPPI 264.
(3) FTIR and XRF analysis
The FTIR analysis was analyzed using an FTIR analyzer over 400-4,000 cm-1. Furthermore, the XRF (Rigaku supermini 200, Europe) analyses were conducted at the Geological Engineering Laboratory of ITB Bandung.
(4) Statistical analysis
Statistical analysis of park waste generation based on the number of trees, park area, and seasons. Analysis of variance (ANOVA) determined the relationship between the effect of season, the impact of the number of trees, the type of park, and the area on the generation, test criteria:
Fcount $=\frac{\text { KT treatment }}{\text { KT galat }}$ compared to F table
if, F0,05<Fcount<F0,05 then accept H1 at the 5% level of significance. Additionally, linear regression analysis obtained the model equation relationship between the number of trees and the park area to the generation of garden waste.
3.1 Generation of city park
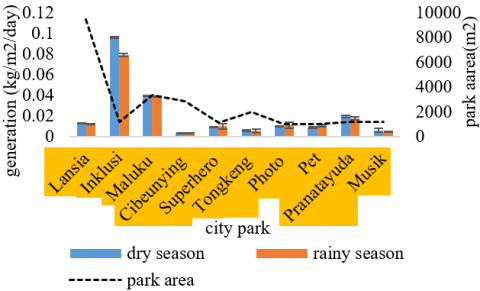
Generally, the bulk of waste generated was leaves from tall tree species with an average age of five years and 2 x 2 m. City park waste generation by season is shown in Figure 2. Figure shows the dry season, Maluku, Lansia, Inclusion, and Pranatayuda Parks generated 140 kg/day (0.14 tons/day), 130 kg/day (0.13 tons/day), 110 kg/day (0.11ton/day) and 20 kg/day (0.02 ton/day) of wastes. In addition, more leaves were generated in the dry season, the summer period, compared with the rainy session, and the average park waste generation was 447.5 ± kg/day/park or 0.44±0.24 tons/day/park. Based on Table 3, the significance level for the dry season and rainy season is 0.02 < 0.05, this indicates that there is a significant difference in the number of generations in the dry and rainy seasons. The results of this study are similar to other studies performed in the city of Astana, Kazakhstan. The highest values were found in summer for the organic waste [9]. The results of this study are also supported by eastern European countries, such as Russia and Ukraine [19]. The increase in waste generation in the dry season was reported by researchers in the city of Jammu, India Indian city [20].
City park waste generation with the garden area is shown in Figure 3, in the figure Lansia park, with an area of 9,461m2, was the largest, but with an average yield smaller than both Inklusi and Maluku due to the uneven distribution of trees in the garden. The most significant yield based on the area was found in the Inklusi park at 0.10 kg/m2/day, followed by Maluku at 0.04 kg/m2/day, and there was even distribution.
Figure 2. Garden waste generation by season
Table 3. t-test results of the generation of city park waste of seasonal variation
|
One-Sample Test |
|||
|
Component |
t |
df |
Sig. (2-tailed) |
|
Dry season |
2.641 |
9 |
0.027 |
|
Rainy season |
2.651 |
9 |
0.026 |
Figure 3. City park waste generation by season with the park area (kg/m2/day)
Figure 4 shows City park waste generation with the number of trees. The number of trees in Maluku Park was about 332 species composed of large and small trees, with a total waste generation of 136.6 kg/day (0.41 kg/ number of tree/day) during the dry season. A total waste generation of 121.43 kg/day (0.4 kg/ number of tree /day) placed Lansia Park as the second most polluted. Due to management factors, Pet Park followed this with 140 species and waste generation of 23.78 kg/day (0.16 kg/number of tree/day). Overall it can be concluded that the generation of Bandung city park waste will increase along with the increasing number of city parks. Factors that significantly affect the rate of increase in park waste generation are the number of trees and the influence of the weather. but it is undeniable that the effect of tree age and the number of leaves is thought to also affect the amount of park waste generation in the green open space of city parks. The amount of waste generated by city parks is so large and continues to increase that it has the potential to be developed and utilized in new energy sources and other forms. Therefore, the characteristics are very necessary.
Figure 4. City park waste generation by season with the number of trees (kg/ number of tree /day)
Figures 5 predicted waste generation from the regression model for the number of trees. The equation y=0.5435x-0.6783 and the value of R²=0.92 show that the relationship between the number of trees and the waste generation was very significant. The correlation of 92% and 8% is due to other factors such as seasons and weather. Model y=0.5435x-0.6783, where y=the rate of generation of city park waste and x=the number of trees. The model with the highest parsimony resulted in an adjusted coefficient of 0.92, showing a high influence on the phenomenon studied and a good predictive capacity. Figure 5 predicted waste generation from the regression model for the city park area. The equation y=0.0158x+18.237 and R²=0.4159. The coefficient of determination R = 0.419 shows a positive relationship between the city park area and the rate of generation of waste. It accounted for approximately 40% of waste generation, while the remaining 60% was due to other factors such as weather, season, and number of trees. The equation y=0.0158x+18.237 was not used to determine the number of city park waste generated based on the city park area.
Figure 5. Predicted city park waste generation from the regression model
Table 4 shows an analysis of variance for the generated model. Multiple Linear Regression was used to analyze the relationship between variables and the forecast model to determine the waste generation rate. Analysis of variance for the relationship between waste generation shows a significant level (F) 0.0001<0.05, meaning a significant influence of the city park area and the number of trees on the waste generation rate. The relationship is evident by the adjusted R Square value of 0.90, which indicates that it is also the most closely related variable to waste generation. Analysis of variance for the generated model base on park area is obtained a (p-value) of 0.66>0.05 from the t-test for the effect of two variables, indicating that generated model base on park area with equation y=0.0158x+18.237 does not significantly affect the generation rate. In contrast, the number of trees has a (P-value)=0.0002<0.05, implying that the equation y=0.5435x-0.6783 number of trees significantly determines the generation rate of the waste.
Table 4. Analysis of variance for regression of the generated model
|
|
Coefficients |
Standard Error |
t Stat |
P-value |
|
Intercept |
-2.03 |
9.45 |
-0.21 |
0.83 |
|
Park area |
0.001 |
0.003 |
0.45 |
0.66 |
|
Number of tree |
0.52 |
0.07 |
6.79 |
0.0002 |
3.2 City park waste characteristics
3.2.1 Ultimate analysis
The ultimate analysis determined the chemical composition of leaves waste samples such as ash, total sulfur, carbon, hydrogen, oxygen, and calorific value. Based on Table 5, the components of the city park waste include 40.45% carbon, 5.62% hydrogen, 0.30% sulfur, and 0.98% oxygen, with a calorific value of 3612 Cal/gram. A study conducted by Shah [21] using samples of leaves (Catappa) and pole Glodokan (Longifolia) resulted in carbon levels of 43% and 49%, respectively. Meanwhile, the hydrogen content of Catappa and Longifolia was 5.5% and 5.7%, while the oxygen contents were [22] the ultimate analysis of peanut shells. According to Shah [21], the volatility of substances with higher oxygen content is high with low heat [22, 23]. The C and H elements in the biomass bind to form volatile organic substances and fixed carbon, which significantly affect the energy content [24]. Studies conducted by Yin [24] and Sheng and Azevedo 25], also showed the relationship between elements such as C, H, O, and S to the heating value (HHV). However, stated that the effect of element O was not significant, as it played no role in the decrease in HHV [23]. The sulfur content in Table 5 was smaller at 0.31%, compared with other components. According to the Bureau of Energy Efficiency, the average content in fuel is around 0.5-0.8%, and when high, it causes corrosion and reduces quality. Furthermore, Shah [21] reported that lower sulfur content reduces SOx gas emissions, making biomass waste a potential raw material for renewable energy with the pyrolysis process. The ultimate analysis shows that Bandung city park waste has the potential to be developed as an alternative fuel, especially from the composition of low sulfur values and high carbon values. Although the calorific value of garden waste raw materials is lower than plastic waste, garden waste is included in the class of combustible materials so that the selection of the right technology is very possible to increase the calorific value.
3.2.2 Proximate analysis
The proximate analysis was used to estimate the fuel performance during combustion and determine the leaves characteristics of water and ash contents, volatility, fixed carbon, and heating value.
Table 5. Characteristics of waste in Bandung City Park
|
Ultimate analysis |
Total |
Proximate analysis |
Total |
|
Abu (%) |
16.54 |
Water content) |
2.6 |
|
Sulfur (%) |
0.31 |
Ash Content (%) |
14.1 |
|
Carbon(%) |
40.45 |
Fixed Carbon content (%) |
76.4 |
|
Hidrogen |
5.62 |
Volatile level (%) |
5.3 |
|
Oksigen |
0.96 |
Calorific value (cal/gram) |
3612 |
Table 5 shows a proximate analysis of waste in Bandung's thematic parks. The heating value is selected from the interactions of various chemical components from the biomass, such as its fixed carbon, volatile matter, ash, and water content [26, 27]. The higher the calorific value, the more efficient its combustion, and based on Table 4, the ten parks have different characteristics. This was due to the various locations and factors of plant species in each garden; therefore, the burning effect was also different. Similar results were obtained by Naik et al. [28] for wheat, barley straw, hemp straws, and timothy grass, with the moisture content in the range of 5.0-7.9% and 1.1-9.8% for ash content. According to Sasmal et al. [29], biomass from Areca catechu, Ziziphus rugosa, and Albizia Lucida showed water content of 6.6, 5.2, and 5.8% and ash content of 2.9, 1.3, and 1.5%, respectively. The differences were due to variations in structures, locations, and the analysis method used. In addition, the moisture content has a significant effect on the energy value and fuel performance. Since the water content is inversely proportional to the heating value, the higher it is, the lower the calorific value. A favorable humidity for thermal processing ranges from 8-12% [30] water content in the category <15% for the conversion process [31]. The upper heating value (HHV) of solid biomass is an essential factor in determining the energy content of the fuel. The calorific value reached 3612 cal/gram (16.2 MJ/Kg), above the World Bank-recommended value (6 MJ/Kg) for utilization in thermochemical conversion processes [32]. The amount of energy is obtained from the difference between the level of the products and reactants during a complete combustion process, expressed as Higher Heating Value (HHV) or Lower Heating Value (LHV). According to Saffe et al. [33], HHV and LHV are obtained when the water from combustion is in the form of liquid or steam. The LHV obtained from paper biomass was 2598 cal/gram [34]. This calorific value was relatively lower, but it is more reactive and easy to convert than coal. Biomass with higher ignition stability is easier to process into high-value fuels such as methanol or hydrogen [35].
3.2.3 Lignin, hemicellulose, and alpha cellulose analysis
Leaves are lignocellulosic biomass consisting of cellulose, hemicellulose, and lignin in 30-50%, 15-35%, and 10-20%, respectively. Lignin and extractive substances usually have higher calorific values than cellulose and hemicellulose. The heating value is directly proportional to the bonded carbon content, and lignin is a critical component of wood chemicals for determining the extent of the bond and the heating value. Therefore, increased content results in higher bonded carbon and biomass heating value [23]. Table 6 showed 10.20%, 10.17%, and 21.87% of lignin, hemicellulose, and Alpha Cellulose. Higher results were obtained in Ketapang leaves (Catappa) with 14% lignin, 12% hemicellulose, and 42% alpha-cellulose, while Pole Glodokan (Longifolia) leaves had 20% lignin, 13% hemicellulose, and 41% cellulose [21]. Research from rice husk waste and sawdust yields were 13.45% and 22.75% (w/w) of cellulose, respectively [36]. Differences in contents are strongly influenced by the structure of plant species, geographic location, climate, and the plant's taxonomic [31].
Table 6. The results of the lignin, hemicellulose, cellulose
|
Parameter analysis |
Unit |
Result |
Basic |
|
Lignin |
% |
10.20 |
SNI 0492-2008 |
|
Hemiselulosa |
% |
10.17 |
SNI 14-1304-1989 |
|
Alfa selulosa |
% |
21.87 |
SNI 8400: 2017 |
3.2.4 FTIR analysis
The FTIR analysis was performed to detect the changes in the biomass functional groups (Figure 6). The main characteristics were attributed to the different chemical groups such as cellulose, hemicellulose, and lignin components of the biomass, and a more significant percentage of transmission was observed within 3400-3000 cm-1 (area 456). This range is similar to the stretch band of hydrogen bonds in the OH group from cellulose or hydroxyphenyl glucoside bonds of lignin's guaiacyl and syringyl groups [17]. The subsequent transmission was observed in areas 7 and 8 within 2,923.56-2,854.13 cm-1, which is a single bond. Previous studies have shown axial deformation of aliphatic CH associated with phenols, alcohols, carboxylic acids [23], and aldehydes [24] functional group. Additionally, transmission deformations were observed in areas 12 and 13 within 1619.91-1724.05 cm-1, with a double bond associated with C = O hemicellulose stretching and H - O - H deformation vibrations [25]. Areas 14,15,16,17, and 18, within the 1,442.49, 1,380.78, and 1,319.07 cm-1, were with deformation of C-H in cellulose and hemicellulose. In comparison, 1,241.93 - 1,199.51 cm-1 showed the release of C - O, and stretches of lignin and xylan [17]. In area 19, the transmission of 1,052.94 cm-1 was associated with the vibrational stretching of C - O in cellulose and hemicellulose [26].
Figure 6. The results of FTIR analysis
3.2.5 X-Ray Fluorescence Spectrometry (X-RF)
The X-RF test was conducted to determine the constituent elements of the leaves, which were converted into bio-allergenic compounds. XRF analysis is shown in Table 7 Results showed that the most significant component was Ca (calcium) at 51.6%, followed by Fe (iron) at 15.8%, Si (Silica) at 12.2%, and K (potassium) at 8.91%, while others were in small quantities, as shown in Table 7. Composition of Ketapang leaves and Pole Glodokan research by Shah [21] include Al, B, Ba, Ca Na, K, Ca Co, Cr, Cu, Fe, K, Li, Mg, Mn, Na, Ni, Pb, Sr, and Zn. Meanwhile, the dominant element in both samples was K at 64,795 ppm. During autumn, Constituents of dry leaves in Central Europe were Ca, Mg, K, Mn, Fe, P, and Zn, while Ca was the highest at 43.3 grams/Kg. Pnakovic and Dzurenda [37] reported that the elemental composition of biomass is influenced by environmental conditions. The mineral constituents are vital parameters for secondary pyrolysis reactions and affect the reactivity of charcoal during pyrolysis. Mineral substances can decrease the amount of tar and increase the formation of charcoal and gas because inorganic materials accelerate dehydration and charring reactions during pyrolysis. The variation in the distribution of products depends on the composition and type of minerals, such as the content of inorganic substances like K, Cl, Na, P, Ca, Mg, causing environmental problems [31].
Table 7. The components mineral of leave waste park from Bandung thematic parks
|
No |
Component |
Result |
Unit |
|
1 |
Al |
2.49 |
mass % |
|
2 |
Si |
12.2 |
mass % |
|
3 |
P |
1.15 |
mass % |
|
4 |
Si |
1.75 |
mass % |
|
5 |
Cl |
1.41 |
mass % |
|
6 |
Ti |
8.91 |
mass % |
|
7 |
Ca |
51.6 |
mass % |
|
No |
Component |
Result |
Unit |
|
8 |
Ti |
1.62 |
mass % |
|
9 |
Mn |
0.79 |
mass % |
|
10 |
Fe |
15.8 |
mass % |
|
11 |
Zn |
0.2 |
mass % |
|
12 |
Sr |
0.5 |
mass % |
|
13 |
Ag |
1.5 |
mass % |
This study highlights two important issues. The first is how much municipal park waste is generated every day in the park. Information about the generation of garden waste is very limited, especially the effective factor that determines the amount of garden waste generation. Therefore, in this study, a simple mathematical model was developed that relates the seasonal factors, the number of trees, and the area of the park to the generation. These results can be used to predict the waste generated in different areas and park areas. The second is shows the characteristics of city park waste with a low sulfur composition and water content of 0.31% and 2.6%, respectively, with a high carbon content of 40.45%. The calorific value is 15.2 MJ/Kg, and the fixed carbon value is 72%, while the chemical composition contains 21.87% cellulose, provide information that city park waste can be developed as one of the raw materials for renewable energy. This information is very important in the management of city park waste originating from green open spaces so it is recommended that the city park waste management system, especially the city of Bandung, be developed into an energy source. It is estimated that there are three types of bioenergy products that can be produced by garden waste in the form of bio-oil, bio-chart and gas produced by simple pyrolysis technology. In future developments, this system can be implemented by means of all municipal park waste being collected centrally in an area where pyrolysis facilities are available to process waste into biofuel. The biofuel products are then sold as added value from the facility.
The generation of urban park waste is increasing due to the increasing number of green open spaces in urban areas. Waste generation in Bandung city park reaches 0.44±0.24 tons/day/park. This indicates that sufficient quantities are available for biofuel production. The most generation of city park waste is obtained in the dry season, so seasonal factors affect generation. The number of trees determines the rate of city park waste generation reaching 90%, and the area of the city park only affects 40%, so these two components can be used as effective factors in determining the prediction of municipal waste generation. Characteristics show a calorific value of 3612 cal/gram (16.2 MJ/Kg), above the WorlBank recommendation of (6 MJ/Kg) so that it meets the requirements for thermochemical conversion processes. The low sulfur content at 0.31% reaches the standard set by the Bureau of Energy Efficiency for biofuel production (0.5-0.8%). Meanwhile, the water content in the category <15% is efficient for the thermal conversion process.
The results prove that the city park was the potential for converting waste to biofuel feedstock production and other energy products. The findings of this study provide some detailed information that can help in designing a city solid waste management system from green open spaces as an energy source. The next step is needed for the development of information obtained from the results of this research, namely the application of technology applications that are practical, economical and environmentally friendly to obtain energy products that can practically be used to replace fossil fuels. Further research should emphasize several perspective considerations such as possible recovery, technology feasibility, economic accounting and environmental impact assessment. Methodology that has been carried out in this study can be used as a guide for future work to identify the magnitude of the energy and nutrient recovery potential and can also help decision makers to achieve sustainable development in this case for Indonesia and other countries that have similar condition.
The authors are grateful to the BPP-DN Program (Grant No. 525/11.B13/P.P./2017), Ministry of Research, Technology and Higher Education of The Republic of Indonesia, for supporting this research.
|
cm |
Centimeters |
|
kg |
Kilogram |
|
Number of trees |
number of plants |
|
m2 |
Square centimeter |
|
Tons/day |
tonnes per |
[1] Shi, Y., Ge, Y., Chang, J., Shao, H., Tang, Y. (2013). Garden waste biomass for renewable and sustainable energy production in China: Potential, challenges and development. Renewable and Sustainable Energy, 22: 432-437. https://doi.org/10.1016/j.rser.2013.02.003
[2] Tayeh, R.A., Alsayed, M.F., Saleh, Y.A. (2021). The potential of sustainable municipal solid waste-to-energy management in the Palestinian Territories. Journal of Cleaner Production, 279: 123-753. https://doi.org/10.1016/j.jclepro.2020.123753
[3] Shafy, A., H.I., Mansour, M.S.M. (2018). Solid waste issue: Sources, composition, disposal, recycling, and valorization. Egyptian Journal of Petroleum, 27(4): 1275-1290. https://doi.org/10.1016/j.ejpe.2018.07.003
[4] Ayeleru, O.O., Okonta, F.N., Ntuli, F. (2018). Municipal solid waste generation and characterization in the City of Johannesburg: A pathway for the implementation of zero waste. Waste Management, 79: 87-97. https://doi.org/10.1016/j.wasman.2018.07.026
[5] Matsakas, L., Gao, Q., Jansson, S., Rova, U., Christakopoulos, P. (2017). Green conversion of municipal solid wastes into fuels and chemicals. Electronic Journal of Biotechnology, 26: 69-83. https://doi.org/10.1016/j.ejbt.2017.01.004
[6] Faruque, M.O., Razzak, S.A., Hossain, M.M. (2020). Hheterogeneous catalysts for biodiesel production from microalgal oil—A review. Catalysts. 10(9): 1-25.
[7] Cheng, Z., Nitoslawski, S., van den Bosch, C.K., Sheppard, S., Nesbitt, L., Girling, C. (2021). Alignment of municipal climate change and urban forestry policies: A Canadian perspective. Environmental Science & Policy, 122: 14-24. https://doi.org/10.1016/j.envsci.2021.04.005
[8] Boldrin, A., Christensen, T.H. (2010). Seasonal generation and composition of garden waste in Aarhus (Denmark). Waste Management, 30(4): 551-557. https://doi.org/10.1016/j.wasman.2009.11.031
[9] Abylkhani, B., Aiymbetov, B., Yagofarova, A., Tokmurzin, D., Venetis, C., Poulopoulos, S., Sarbassov, Y., Inglezakis, V.J. (2019). Seasonal characterisation of municipal solid waste from Astana city, Kazakhstan: Composition and thermal properties of combustible fraction. Waste Management & Research, 37(12): 1271-1281. https://doi.org/10.1177/0734242X19875503
[10] Abel, A. (2007). An analysis of solid waste generation in a traditional African city: The example of Ogbomoso, Nigeria. Environment and Urbanization, 19(2): 527-537. https://doi.org/10.1177/0956247807082834
[11] Adeleke, O.A., Akinlabi, S.A., Jen, T.C., Dunmade, I. (2021). An overview of factors affecting the rate of generation and physical composition of municipal solid waste. In IOP Conference Series: Materials Science and Engineering, 1107(1): 012096. https://doi.org/10.1088/1757-899x/1107/1/012096
[12] Shu, T., Tong, L., Guo, H., Li, X., Bai, B., Chen, Y., Nie, X. (2021). Research status of generation and management of garden waste in China: A case of Shanghai. In IOP Conference Series: Earth and Environmental Science, 766(1): 012074. https://doi.org/10.1088/1755-1315/766/1/012074
[13] Islam, K.M. (2016). Municipal solid waste to energy generation in Bangladesh: possible scenarios to generate renewable electricity in Dhaka and Chittagong city. Journal of Renewable Energy, 2016: 1712370. http://dx.doi.org/10.1155/2016/1712370
[14] Eades, P., Kusch-Brandt, S., Heaven, S., Bank, C.J. (2020). Estimating the generation of garden waste in England and the differences between rural and urban areas. Resources, 9(1): 8. https://doi.org/10.3390/resources9010008
[15] Bary, A.I., Cogger, C.G., Sullivan, D.M., Myhre, E.A. (2005). Characterization of fresh yard trimmings for agricultural use. Bioresource Technology, 96(13): 1499-1504. https://doi.org/10.1016/j.biortech.2004.11.011
[16] Edjabou, M.E., Boldrin, A., Astrup, T.F. (2018). Compositional analysis of seasonal variation in Danish residual household waste. Resources, Conservation and Recycling, 130: 70-79. https://doi.org/10.1016/j.resconrec.2017.11.013
[17] Tarigan, A.K.M., Sagala, S., Samsura, D.A.A., Fiisabiilillah, D.F., Simarmata, H.A., Nababan, M. (2016). Bandung City, Indonesia. Cities, 50(10): 100-110. https://doi.org/10.1016/j.cities.2015.09.005
[18] Pasangulapati, V., Ramachandriya, K.D., Kumar, A., Wilkins, M.R., Jones, C.L., Huhnke, R.L. (2012). Effects of cellulose, hemicellulose and lignin on thermochemical conversion characteristics of the selected biomass. Bioresource Technology, 114: 663-669. http://dx.doi.org/10.1016/j.biortech.2012.03.036
[19] Denafas, G., Zavarauskas, K., Martuzevičius, D., Vitkauskaitė, L., Ludwig, C.H., Hoffman, M., Marin, S., Mykhaylenko, V., Chusov, A., Romanov, Negulyaeva, E., Lednova, Y., Turkadze, T.S., Bochoidze, I., Butskhrikidze, B., Karagiannidi, A., Antonopoulos, J., Kriipsalu, M., Horttanainen, M. (2019). Seasonal characterisation of municipal olid waste from Astana city, Kazakhstan, Composition and thermal properties of combustible fraction. Waste Management and Research, 37(12): 1-11. http://dx.doi.org/10.1177/0734242X19875503
[20] Alam, P., Mazhar, M.A., Khan, A.H., Khan, N.A., Mahmoud, A.E.D. (2021). Seasonal characterization of municipal solid waste in the city of Jammu, India. In IOP Conference Series: Materials Science and Engineering, 1058(1): 012061. http://dx.doi.org/10.1088/1757-899X/1058/1/012061
[21] Shah, S.A.G. (2017). Physico-chemical evaluation of leaf litter biomass as feedstock for gasification. International Journal of Engineering Research and Technology, 10(1): 227-231.
[22] Ozyuguran, A., Yaman, S. (2017). Prediction of calorific value of biomass from proximate analysis. Energy Procedia, 107(3): 130-136. https://doi.org/10.1016/j.egypro.2016.12.149
[23] Xing, J., Luo, K., Wang, H., Gao, Z., Fan, J. (2019). A comprehensive study on estimating higher heating value of biomass from proximate and ultimate analysis with machine learning approaches. Energy, 188: 116077. https://doi.org/10.1016/j.energy.2019.116077
[24] Yin, C. (2011). Prediction of higher heating values of biomass from proximate and ultimate analyses. Fuel, 90(3): 1128-1132.
[25] Sheng, C., Azevedo, J.L.T. (2005). Estimating the higher heating value of biomass fuels from basic analysis data. Biomass and Bioenergy, 28(5): 499-507. https://doi.org/10.1016/j.biombioe.2004.11.008
[26] Huang, M., Xu, J., Ma, Z., Yang, Y., Zhou, B., Wu, C., Ye, J., Zhao, C., Liu, X., Chen, D., Zhang, W. (2021). Bio-BTX production from the shape selective catalytic fast pyrolysis of lignin using different zeolite catalysts: Relevance between the chemical structure and the yield of bio-BTX. Fuel Processing Technology, 216: 106792. https://doi.org/10.1016/j.fuproc.2021.106792
[27] Liu, L., Zhuang, D.F., Jiang, D., Fu, J.Y. (2013). Assessment of the biomass energy potentials and environmental benefits of Jatropha curcas L. in Southwest China. Biomass and Bioenergy, 56: 342-350. https://doi.org/10.1016/j.biombioe.2013.05.030
[28] Naik, S., Goud, V.V, Rout, P.K., Jacobson, K., Dalai, A.K. (2010). Characterization of Canadian biomass for alternative renewable biofuel. Renewable Energy, 35(8): 1624-1631. https://doi.org/10.1016/j.renene.2009.08.033
[29] Sasmal, S., Goud, V.V., Mohanty, K. (2012). Characterization of biomasses available in the region of North-East India for production of biofuels. Biomass and Bioenergy, 45: 212-220. https://doi.org/10.1016/j.biombioe.2012.06.008
[30] Onochie, U.P., Obanor, A.I., Aliu, S.A., Ighodaro, O.O. (2017). Proximate and ultimate analysis of fyel pellets from oil palm residues. Nigerian Journal of Technology, 36(3): 987-990.
[31] Akhtar, N., Goyal, D., Goyal, A. (2016). Physico-chemical characteristics of leaf litter biomass to delineate the chemistries involved in biofuel production. Journal of the Taiwan Institute of Chemical Engineers, 62: 239-246. https://doi.org/10.1016/j.jtice.2016.02.011
[32] Zhen, Z., Zhang, H., Yan, M., Wu, A., Lin, X., Susanto, H., Samyudia, Y., Huang, Q., Li, X. (2020). Experimental study on characteristics of municipal solid waste (MSW) in typical cities of Indonesia. Progress in Energy and Fuels, 8(1): 13. https://doi.org/10.18282/pef.v8i1.716
[33] Saffe, A., Fernandez, A., Mazza, G., Rodriguez, R. (2019). Prediction of regional agro-industrial wastes characteristics by thermogravimetric analysis to obtain bioenergy using thermal process. Energy Exploration and Exploitation, 37(1): 544-557. https://doi.org/10.1177/0144598718793908
[34] Novita, D.M., Damanhuri, E. (2010). Heating value base on composition and characteristics of municipal solid waste Indonesia in waste to energy. Environmental Engineering Journal, ITB, 16(2): 103-114.
[35] Ismaila, A., Abdullahi, I., Garba, N.N. (2013). Investigation on biomass briquettes as an energy source in relation to their calorific values and measurement of their total carbon and elemental contents for efficient biofuel utilization. Pelagia Research Library Advances in Applied Science Research, 4(4): 303-309.
[36] Andalia, R., Helwati, H. (2020). Isolation and characterization of cellulose from rice husk waste and sawdust with chemical method. Jurnal Natural, 20(1): 6-9. https://doi.org/10.24815/jn.v20i1.12016
[37] Pnakovic, L., Dzurenda, L. (2015). Combustion characteristics of fallen fall leaves from ornamental trees in city and forest parks. BioResources, 10(3): 5554-5562. https://doi.org/10.15376/biores.10.3.5554-5562