Dwi Sartika Adetama* | Akhmad Fauzi | Bambang Juanda | Dedi Budiman Hakim
© 2022 IIETA. This article is published by IIETA and is licensed under the CC BY 4.0 license (http://creativecommons.org/licenses/by/4.0/).
OPEN ACCESS
Currently, Indonesia has adopted Low Carbon Development (LCD) in its Medium-Term Development Plan (RPJMN) 2020-2024. One of the priority activities is agriculture, which accounts for 12.21% of total greenhouse gas emissions. The agricultural sector is the victim affected by CO2 emissions, such as degradation, shrinkage of agricultural resources, land and water, shifting planting seasons, crop failures, decreased food production due to rising air temperatures, floods, and droughts. Greenhouse gas emissions are predicted to continue to increase along with the increasing demand for food. The purpose of this study is to predict and find an alternative policy framework for low-carbon development in the agricultural sector in Indonesia. This study uses a quantitative and qualitative approach by Artificial Neural Network (ANN), and multicriteria policy (MULTIPOL) analysis. The data were obtained through secondary data in 2014-2018, and the primary data are in-depth interviews, Focus Group Discussions (FGD), and field observations. The results of ANN show that the predictions of provinces that need to adopt low-carbon development in Indonesia are dominated in production centers such as Java Island, so an alternative policy framework using MULTIPOL is needed. Furthermore, this research establishes three scenarios, eight policies, twenty-six actions, and nine evaluative criteria in analyzing the LCD of the agricultural sector. The results indicate that LCD can be conducted by integrating the speed scenario (S2) with a value ranging from 6.3 (policy to increase capacity and quality of human resources) to 18.7 (circular economy). This scenario accommodates policies related to low carbon reduction and agricultural production increase, such as a circular economy, co-benefit adaptation strategies, low carbon technology innovation, and strengthening low carbon networks.
low carbon development, ANN, MULTIPOL, agriculture, greenhouse gas emissions
Climate change is a development challenge faced by several countries, including Indonesia. Increased global temperature may raise the chances of famine and poverty. Low carbon development (LCD) is viewed as a possible solution to the current climate crisis. The Indonesian government has shown its commitment by ratifying the Paris Agreement to the United Nations Framework Convention on Climate Change. Many countries agreed to strengthen their obligations to decrease carbon emissions as part of a successful global negotiation to combat climate change and adopt LCD.
Indonesia is prone to the impacts of climate change which at the same time can play an important role in overcoming this global issue. Its agricultural land use has contributed about 15% of all greenhouse gas emissions. Rice fields are one source of greenhouse gas emissions that cause global warming, namely methane (CH4). Methane is the second-largest contributor to global warming, and it comes primarily from animal activity. One of the factors that cause large CH4 emissions is the presence of organic matter in the soil. The use of fertilizers and processing of agricultural residues by burning are activities that cause emissions from the agricultural sector.
The agricultural sector’s contribution to national greenhouse gas emissions in 2017 was 12.21% but has experienced a fairly large impact. Furthermore, CO2 emissions from the agricultural sector in Indonesia increased by 1.64% from 2000 to 2017. N2O emissions from the managed land account for 37.14% of the sector’s greenhouse gas, with rice cultivation accounting for 35.07%. Agricultural sources of greenhouse gases are peatland burning, enteric fermentation, livestock waste management, agricultural lime use, urea fertilization, N2O, and CH4 emissions. These gases are obtained from the decomposition process of organic matter in anaerobic conditions of flooded rice fields and released into the atmosphere through plants.
Fertilizer application is essential to boost rice yield because of the current agricultural crisis. However, the application has the potential to produce GHG emissions. Its use has increased by 1.38% yearly, with the largest percentage in Urea, NPK, ZA, and SP 36 at 43.86%, 28.27%, 10.77%, and 9.15%. The Chinese government has carried out a policy for the agriculture LCD by reducing excessive N fertilizers by 30-50% on plants because it can endanger food safety and increase the attack of pests and diseases. The different fertilizers have been replaced with organic and green manures [1].
Several studies are more focused on predicting the trend of GHG emissions in the agricultural sector in each province, such as in Jiangsu Province [2], Guiyang Province [3], Henan Province [4], Yantze river economic zone [5], there is no study to predict whether all provinces need undertake low-carbon development or not, especially at the national level. The low-carbon development strategy, especially the agricultural sector carried out by several other countries is more about actions, such as emphasizing the action of efficient use of fertilizers [6], then the adoption of low-carbon technology [7], low-emission varieties [8], some of these actions are not linked with scenarios. Action with the right innovation, investment, and policy incentives, low GHG emission agricultural practices can help reduce climate change impacts, reduce emissions while contributing to food security [9]. This research is also strengthened [10] where the Government and donors must ensure that the shift to low GHG emission technologies and practices.
The future low-carbon development of the agricultural sector is largely determined by various action scenarios prepared by policy makers at various levels. The study of policy implementation scenarios with various programs using foresight analysis has never been carried out so that an integrated policy is needed between scenarios, policies and actions.
LCD in the agricultural sector by promoting the transition of high-carbon to low-carbon agriculture, good schemes, mechanisms and policies, and effective measures for the development of low-carbon agriculture play the role of market mechanisms. Therefore, other policies such as increasing agricultural inputs and land cultivation, wetlands protection, as well as carbon-sink development should be conducted [9].
The future LCD of the agricultural sector is largely determined by various action scenarios prepared at various levels. However, analysis of policy implementation scenarios with various programs using foresight analysis has not been performed. As a result, this study presents a fresh approach to analyzing future trends based on criteria and objectives. It also aims to discover the best policy solution for Indonesia’s agricultural LCD. The results are expected to serve as the foundation for future decision-making by stakeholders involved in planning, implementing, monitoring, and evaluating LCD in the agricultural sector.
2.1 Data collection
This study uses a quantitative and qualitative approach with primary and secondary data collection methods. A quantitative approach is used to predict low-carbon development in the agricultural sector using secondary data for 2014-2015 sourced from BPS, Ministry of Agriculture, Bappenas, Ministry of Finance, Ministry of Environment and Forestry, and previous research literature studies. The analytical tool used is an Artificial Neural Network (ANN).
This research used qualitative analysis, which analyzed variables in their natural settings by attempting to understand or interpret phenomena regarding the meanings. In addition, it used primary data through a Focus Group Discussion (FGD), consisting of academics, the Ministry of Environment and Forestry, the Directorate General of Food Crops, the Ministry of Agriculture, the Center for Agriculture Land Resources, Center for Socio-Economic and Agricultural Policy, Center for Food Crops Research, National Food Agency, Department of Food and Agriculture Security, politicians, businessmen, Non-Governmental Organizations, as well as farmer representatives from the Agricultural and Rural Self-Help Training Center, Bogor Regency. FGD was held to discuss: (1) evaluation criteria for measurable aspects based on the assessment of stakeholders; (2) scenarios for future developments structured to achieve goals; (3) policies such as strategies; and (4) potential interventions aimed at policy implementation. The discussion results obtained a variety of inputs and views on LCD in the agricultural sector.
2.2 Data analysis
2.2.1 Artificial neural network (ANN) method
The ANN method with back propagation in this study uses three layers, namely: 1). The input layer is the liaison between the neural network and the external network. The output of the input layer is connected to all other neurons in the next layer; 2) the hidden layer is the layer that lies between the input layer and the output layer. The input of each hidden layer is the output of the previous layer and the output of the previous layer is the input for the layer in front of it; and 3) the output layer is the outermost layer as a result of the process.
Back propagation is the development of a single layer network (single screen network) which has two layers, namely the input layer and the output layer. The existence of a hidden layer in back propagation causes the error rate in back propagation to be smaller than the error rate in a single layer network. This happens because the hidden layer in back propagation functions as a place to update and adjust the weights, so that a new weight value is obtained that can be directed closer to the desired output target. The advantage of the ANN method is that it can solve complex problems with analytical and numerical solutions. This research uses Visual Gene Developer V1.9 software.
In this study, the ANN structure used to model the relationship between ten input variables in a number of provinces. The number of layers and the number of nodes in each layer in each ANN model used are as follows:
(1) The input layer in this study is only one input layer with ten input nodes in it, namely:
rice production (X1) Tons
rice productivity (X2) Quintal/Ha
rice planting area (X3) Ha
rice consumption (X4) Kg/cap/year
amount of urea fertilizer use (X5) Ton
area of degraded/critical land (X6) Ha
Gross Regional Domestic Product (GDP) (X7) Rupiah
total CO2 emission eq (X8) giga gram
population growth rate (X9) percent
number of agricultural workers (X10) man
(2) Hidden layer, in this study using 3 hidden layers, the number of nodes in the hidden layer has an impact on accuracy in predicting output. In this study using 14 nodes in each layer.
(3) Output layer, in this study there is only one output layer with one output node (Y), namely the Low Carbon Development Index (LCDI) supporting food security.
In the processing of the ANN model, the input data will be processed by multiplying the normalized input data by the weight for processing in the hidden layer. Then the weight will be optimized and activated with sigmoid. Likewise the process to get to the output layer. The value in the hidden layer will be multiplied again by the weight and then reactivated with sigmoid. After that, the values in the output layer will be normalized again to get the actual emission data. To get the appropriate value or close to the calibration value, it is necessary to optimize the weights so that the resulting output value is close to the desired value. The number of hidden layers greatly determines the success of ANN in solving multilayer perceptron problems. The output value is the Low Carbon Development Index for the agricultural sector, then the ANN is formulated using a structure like (Figure 1).
Figure 1. Ten input and one output multilayer ANN structure
The ANN model uses the feedforward method with backpropagation [11] as Eq. (1), as follow:
$b j=f\left(\sum_{i=1}^n(w i j . a i)-T j\right)$ (1)
where, ai is the input vector, bj is the output vector, wij is the weight factor between two nodes. Tj is the internal threshold, and f is the transfer function. Among the various types of transfer functions that can be used is the hyperbolic tangent function. Weight factor and internal threshold value can use Eq. (2) dan (3).
$w_{i j}^{\text {new }}=w_{i j}^{\text {old }}+\eta \cdot \sum_p \delta_{p j} O_{p i}+\alpha \cdot \Delta w_{i j}^{\text {old }}$ (2)
$T_j^{\text {new }}=T_j^{\text {old }}+\eta \cdot \sum_p \delta_{p j}+\alpha \cdot \Delta T_j^{\text {old }}$ (3)
where, η is the learning rate; α is the momentum coefficient; Δw is the change in weight factor; ΔT is the change in threshold value; O is output; δ is the gradient-descent correction term, and p is the pattern. Before training, all initial data must be normalized first. To evaluate the suitability of the ANN method using Root Mean Square Error (RMSE), Efficiency Index (EI), and Mean Absolute Percentage Error (MAPE) each on Eq. (4), (5), dan (6).
$\mathrm{RMSE}=\sqrt{\frac{1}{\mathrm{~N}} \sum_{\mathrm{i}=1}^{\mathrm{N}}\left(\mathrm{X}_{\mathrm{i}}-\mathrm{Y}_{\mathrm{i}}\right)^2}$ (4)
$\mathrm{EI}=\frac{\sum_{\mathrm{i}=1}^{\mathrm{N}}\left(\mathrm{X}_{\mathrm{i}}-\overline{\mathrm{X}}\right)^2-\sum_{\mathrm{i}=1}^{\mathrm{N}}\left(\mathrm{X}_{\mathrm{i}}-\mathrm{Y}_{\mathrm{i}}\right)^2}{\sum_{\mathrm{i}=1}^{\mathrm{N}}\left(\mathrm{X}_{\mathrm{i}}-\overline{\mathrm{X}}\right)^2}$ (5)
$\mathrm{MAPE}=\sum_{\mathrm{t}=1}^{\mathrm{n}}\left|\frac{\mathrm{X}_{\mathrm{i}}-\mathrm{Y}_{\mathrm{i}}}{\mathrm{Y}_{\mathrm{i}}}\right| \times 100 \%$ (6)
2.2.2 MULTIPOL method
A Multicriteria-based Prospective Analysis was conducted using MULTIPOL method [12, 13]. MULTIPOL analyzes policies that support food availability and security in LCD. It adheres to the multicriteria rule, which uses scores and weights in determining the hierarchy or the best choice. Kelebihan penggunaan MULTIPOL dibandingkan multiciriteria yang lain, yaitu mengintegrasikan pendekatan partisipatif melalui keterlibatan stakeholder dalam penilaian multicriteria. Selain itu juga melakukan evaluasi terhadap pilihan tindakan tidak hanya terhadap kriteria, namun juga terhadap interaksi antara action, policy, and scenario.
Furthermore, it evaluates the choice of actions or program alternatives that are not only based on the criteria used. It is also an interaction of three components: actions, policies, and scenarios. MULTIPOL integrates a participatory approach into multicriteria principles. Therefore, its framework is based on mutual information gathering (Figure 1). The FGD phase 1 will be used as input in the MULTIPOL software, based on key questions. Phase 2 FGD results can be verified when the essential input components have been processed, resulting in the expected outcomes [14].
The MULTIPOL framework consists of several stages, including:
(1) The first stage is the formulation of the evaluation problem using a participatory approach such as scenarios (Si), policies (Pj), actions (Ak), and criteria (Kn). This research uses (1) gradual, (2) speed, and (3) moderate scenarios.
The stakeholders also developed eight policies, including (1) LCD innovation; (2) support for low-carbon agricultural input and output fiscal incentives; (3) optimization of agricultural productivity; (4) co-benefit adaptation strategy; (5) increasing the capacity and quality of human resources in the agricultural sector; (6) agricultural land management; (7) circular economy; and (8) strengthening low-carbon agricultural networks.
The twenty-six actions taken in this research are collaborations with research institutions, water-saving irrigation, low-carbon emission varieties, prescription farming technology, organic fertilizers, subsidized seeds for low-emission varieties, low-carbon insurance, utilizing abandoned land, agricultural infrastructure, agricultural land governance regulations, low carbon product price guarantees, low carbon agricultural product education, marketing assurance, organic fertilizer education and advocacy, training for low carbon farmers human resources, biogas livestock manure, vegetable pesticides and biological insecticides, farmers in prisons IPM (P4), service post for biological agents and APH, farming system, animal feed quality, livestock crop integration system, low carbon farmer certificate, low carbon agricultural extension certificate, central and regional regulations, as well as ameliorant. Meanwhile, the nine criteria used are agricultural economic growth, farmers’ income, greenhouse gas emissions, agricultural production, land degradation, environmental and community health, local wisdom, affected actors, and climate-friendly community education.
(2) The second stage is determining the score or weight on scenarios (Si), policies (Pj), and actions (Ak). The participatory approach aims to understand priorities and the weights of interactions or agreements between planners, decision-makers, and the community. Weights for scenarios are set between 1-6, while policies and actions are set between 0-100 [15].
(3) The third stage, the research conducted an impact assessment for scenarios (Si), policies (Pj), and actions (Ak) on criteria (Kn). The preparation is carried out by inputting the data from the FGD participants using the MULTIPOL software.
(4) The fourth stage is the implementation of the MULTIPOL using (1) evaluation of actions on policies to determine more efficient policies and prioritize actions based on performance on different policies, as well as (2) policy evaluation on scenarios to determine policies that perform better in each scenario. Meanwhile, the fifth stage is to produce a policy strategy formulation, including a framework, a set of scenarios, and specific actions in the form of potential policy pathways. These include policy options that support the objective achievement in each scenario (Figure 2).
The outputs of processing using MULTIPOL are (1) a score table for evaluation of scenarios (Si), policies (Pj), and actions (Ak) on the criteria with the assessment method. The higher the score, the better; (2) the profile map shows the best policies and actions with high values and low standard deviations; (3) from the sensitivity map, the best policy/action has a high average value, and a low standard deviation; (4) closeness map describes the closeness between action and policy as well as policy and scenario.
Figure 2. MULTIPOL framework
3.1 Prediction of low carbon development of agriculture sector
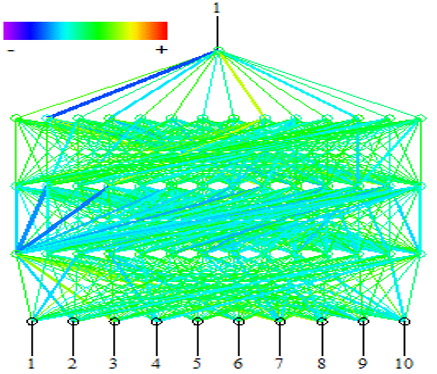
The output used is the low-carbon development index of the agricultural sector, then a model simulation is carried out by linking the input, hidden layer and output in order to obtain a simulation model that is close to the actual results, which is useful for predicting low-carbon development that can support national food security. In this study, using the 10-14-14-14-1 model limit simulation, the simulation was obtained after several experiments. The unit of analysis used is 34 provinces with 10 inputs, 3 hidden layers, and 1 output. The training setting parameters in the Visual Gene Developer software, namely learning rate 0.001, momentum coefficient 0.05, transfer function: hyperbolic tangent, and target error 0.00001. The data used in this simulation is divided into two types, namely training data which is the average data for the 2014-2016 period, and the validation data is the average data for the 2017-2018 period.
Number 10 column 1 is the number of inputs as much as 10, namely agricultural production (Tons), rice productivity (Quintal/Ha), rice planted area (Ha), rice consumption (Kg/Kap/Year), the amount of urea fertilizer use (Tons), area of degraded/critical land (Ha), Gross Regional Domestic Product (Rupiah), total CO2 emissions eq (giga gram), population growth rate (percent), and number of agricultural workers (people). In column 2-4, there are 3 hidden layers with 14, 14, and 14 nodes in each. The number 1 in column 5 represents the number of outputs as much as 1, namely the low-carbon development index of the agricultural sector. Before the run process is carried out, the data is normalized first. The simulation results show a thick light blue line at input 1 (rice production), and input 10 (amount of agricultural labor) connected to 3 hidden layers, then there is a thick blue line in hidden layer 1 at node 1 leading to hidden layer 2 node 2 and 4 (Figure 3).
Figure 3. Simulation of 10-14-14-14-1
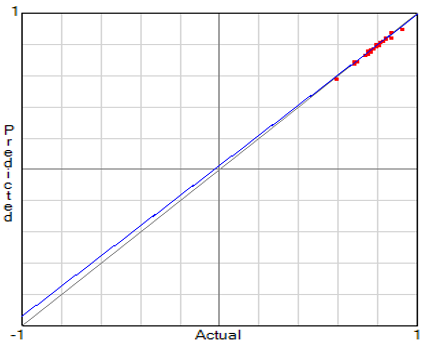
The evaluation results produce an R2 value of 98.2 percent, meaning that the correlation level is very strong. In addition, the resulting error rate is very small, MSE = 0.00007. The RMSE result of 0.008416 indicates that the accuracy of the prediction results is very good, this can be seen from the relatively small error rate. The value of Efficiency Index (EI) <1 is 0.98, so the proposed simulation is better. The MAPE value of 0.72 indicates the smaller the error in the estimation results and the predictive ability is very good with the MAPE value <10% of 0.72% very small indicating the accuracy. Simulation 10-14-14-14-1 can make predictions that are close to the true value with the best level of accuracy, and the smallest error.
The comparison of the actual and predicted low carbon development index values in the agricultural sector can be seen in Figure 4. Prediction accuracy is an important thing for prediction, namely how to measure the suitability between existing data and predicted data [16]. The output results above are predictions from the ANN model using training data, to test how accurate the results of the model with the ANN are using data testing. The output above shows that the actual variable is the actual data taken from the testing data, while the prediction variable is the prediction result of the ANN model obtained. The ANN pattern using machine learning generated is intended if there is a similar case then it can be used.
Figure 4. Actual and predicted LCDI values in 34 provinces
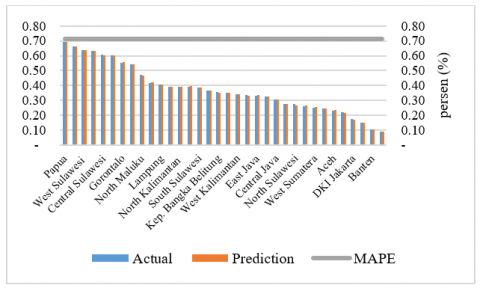
Based on LCDI projections for 2014-2018, the average province in Indonesia (Figure 5) produces a downward trend, this should be a concern from the government that low-carbon development has an impact on sustainable development and the government's commitment to reducing low-carbon emissions, government policies need to be more focusing on low-carbon development, the implementation that has been carried out by the government through the 2020-2024 RPJMN can be a solution to overcome problems, especially in the agricultural sector, coordination with local governments, the role of the private sector and the community needs to be carried out, the best strategy will be discussed in processing using MULTIPOL data.
Figure 5. Forecasting LCDI in Indonesia
3.2 A policy framework LCD of the agricultural sector
The determination of the criteria used in the LCD of the agricultural sector is based on the results of the FGD agreement. The nine criteria used are as follows:
Agricultural sector economic growth
Increasing farmers’ income and profits
Carbon emission reduction
Increase in agricultural production
Decreasing agricultural land degradation
Improved environmental and community health
Utilization of local wisdom
Actors affected by low carbon agriculture
Increasing climate-friendly society
Moreover, eight policies were carried out in this research, namely:
Low Carbon Technology Innovation Policy (P1)
Policy Support for low carbon agricultural inputs and outputs fiscal incentives (P2)
Optimization of agricultural productivity (P3)
Co-benefit adaptation strategy (P4)
Capacity building and quality of agricultural human resources (P5)
Improvement of agricultural land governance (P6)
Circular Economy (P7)
Strengthening the network related to low carbon agriculture (P8)
Another input component needed for implementing MULTIPOL is an action for LCD in the agricultural sector. Some of the actions in the form of programs offered are shown in Table 1.
This research uses three scenarios related to agricultural LCD, namely the gradual (S1), the speed (S2), and the moderate (S3). The gradual scenario (S1) implements LCD by balancing carbon emissions and increasing agricultural production. The speed scenario (S2) quickly implements the LCD by prioritizing the reduction of carbon emissions. Meanwhile, the moderate scenario (S3) applies the implementation in the agricultural sector by increasing agricultural production. The interaction between the three components of the analysis results (action, policy, and scenario) consist of (1) action-based and (2) policy-based evaluation of scenarios.
3.2.1 Action-based evaluation of policies
Based on the results of the analysis, the actions with the highest scores are applying subsidized organic fertilizers (A4), utilizing abandoned land (A19), developing low-emissions and high-production varieties (A2), livestock crop integration system/SITT (A10), and cooperating with research institute (A1), as in Table 2.
The evaluation results in Table 2 show that the action of applying subsidized organic fertilizer (A4) is superior to circular economy policies (P7), adaptation strategies of co-benefits (P4), and low-carbon technological innovations (P1). This aligns with Indonesia’s vision for 2045 and the 2020-2024 RPJMN by adopting the circular economy concept. Besides reducing carbon emissions, a circular economy is also beneficial for the environment by increasing agricultural waste recycling from post-harvest, distribution in the supply chain, and consumption. Previous research showed that the circular economy significantly impacts agricultural development through the reduce-reuse-recycle principle. This includes bio gasification of straw and enhancement of scientific planting capacity [17]. Moreover, Japan and South Korea governments are also designing and implementing policies for a circular economy and achieving carbon neutrality [18].
Table 1. Action in LCD of the agricultural sector
|
No |
Code |
Action |
|
1 |
Cooperation (A1) |
Cooperating with research institutes related to low carbon technology |
|
2 |
Variety (A2) |
Developing low emission and high production varieties |
|
3 |
PerceptFarm (A3) |
Developing prescription farming technology |
|
4 |
PukOrg (A4) |
Applying subsidized organic fertilizer |
|
5 |
SubsdSeed (A5) |
Applying seed subsidies for low-emission varieties |
|
6 |
PriceGuar (A6) |
Implementing low emission agricultural product price guarantee |
|
7 |
Insurance (A7) |
Low carbon-based agricultural insurance |
|
8 |
Watering (A8) |
Water-saving and intermittent irrigation system |
|
9 |
P4 (A9) |
Empowering Farmers in IPM Correctional (P4) |
|
10 |
SITT (A10) |
Livestock crop integration system |
|
11 |
InfraAgr (A11) |
Improving agricultural infrastructure |
|
12 |
PestInsect (A12) |
Utilizing plant-based pesticides and biological insecticides |
|
13 |
Feed (A13) |
Improving the quality of animal feed |
|
14 |
EduPukorg (A14) |
Education and advocacy on the use of organic fertilizers for environmental and community health |
|
15 |
EduPLE (A15) |
Education of low carbon agricultural products |
|
16 |
Training (A16) |
Farmer HR training related to LCD in the agricultural sector |
|
17 |
FarmerCert. (A17) |
Low carbon farmer professional certificate |
|
18 |
SertfPluh (A18) |
Low carbon agricultural extension professional certificate |
|
19 |
LandBnft (A19) |
Utilizing abandoned land for agriculture |
|
20 |
RegPusDae (A20) |
Central and local regulations that support low-carbon agriculture |
|
21 |
RegTKLP (A21) |
Law enforcement in agricultural land management |
|
22 |
Biogas (A22) |
Utilizing livestock manure biogas |
|
23 |
SUT (A23) |
Implementing a clean and healthy farming system |
|
24 |
Amelioran (A24) |
Reducing hay burning, replacing with ameliorant |
|
25 |
MarketGuar (A25) |
Marketing Guarantee of low carbon agricultural products |
|
26 |
PosAPH (A26) |
Empowering Biological Agency Service Posts and APH Development |
Table 2. Action-based evaluation of policies
|
Action |
Policy |
Mean |
Deviation Standard |
Rank |
|||||||
|
P1 |
P2 |
P3 |
P4 |
P5 |
P6 |
P7 |
P8 |
||||
|
A1 |
10.60 |
10.20 |
11.80 |
10.60 |
7.90 |
10.00 |
11.60 |
11.20 |
10.50 |
1.10 |
22 |
|
A2 |
12.50 |
10.10 |
12.70 |
10.90 |
6.80 |
9.80 |
11.00 |
11.80 |
10.70 |
1.80 |
24 |
|
A3 |
6.20 |
6.20 |
7.10 |
6.40 |
4.20 |
8.20 |
7.70 |
7.20 |
6.70 |
1.10 |
4 |
|
A4 |
12.90 |
12.70 |
11.40 |
13.40 |
11.30 |
12.00 |
14.20 |
12.20 |
12.50 |
0.90 |
26 |
|
A5 |
10.30 |
6.60 |
10.60 |
7.10 |
3.10 |
7.10 |
5.50 |
8.90 |
7.40 |
2.30 |
8 |
|
A6 |
8.90 |
7.10 |
10.90 |
6.60 |
4.80 |
7.60 |
5.00 |
8.90 |
7.50 |
1.90 |
9 |
|
A7 |
4.20 |
2.80 |
3.90 |
3.00 |
1.60 |
2.20 |
1.90 |
3.30 |
2.80 |
0.90 |
1 |
|
A8 |
7.50 |
7.70 |
10.10 |
8.10 |
5.10 |
9.60 |
10.60 |
9.60 |
8.50 |
1.70 |
15 |
|
A9 |
9.40 |
10.30 |
10.40 |
9.60 |
13.20 |
10.80 |
9.10 |
10.10 |
10.40 |
1.20 |
21 |
|
A10 |
10.40 |
10.80 |
10.00 |
10.60 |
10.50 |
10.20 |
11.90 |
10.20 |
10.60 |
0.60 |
23 |
|
A11 |
11.60 |
9.30 |
12.70 |
8.90 |
7.20 |
10.60 |
8.80 |
11.10 |
10.00 |
1.70 |
20 |
|
A12 |
7.90 |
7.70 |
6.20 |
9.10 |
7.20 |
7.00 |
9.40 |
7.30 |
7.70 |
1.00 |
11 |
|
A13 |
9.80 |
7.00 |
10.00 |
8.10 |
3.30 |
7.10 |
8.10 |
9.00 |
7.80 |
2.00 |
12 |
|
A14 |
7.40 |
8.90 |
8.20 |
8.90 |
8.20 |
9.60 |
11.70 |
8.70 |
8.90 |
1.20 |
17 |
|
A15 |
9.10 |
10.10 |
10.10 |
9.30 |
10.50 |
9.60 |
9.80 |
9.60 |
9.80 |
0.40 |
19 |
|
A16 |
9.50 |
10.00 |
10.00 |
9.50 |
11.30 |
8.40 |
7.80 |
9.40 |
9.50 |
1.00 |
18 |
|
A17 |
6.20 |
5.30 |
6.30 |
5.60 |
2.10 |
6.10 |
6.00 |
6.10 |
5.50 |
1.30 |
2 |
|
A18 |
8.50 |
7.50 |
9.30 |
7.40 |
7.80 |
8.10 |
8.10 |
8.60 |
8.20 |
0.60 |
13 |
|
A19 |
12.70 |
10.20 |
13.40 |
10.50 |
7.00 |
11.50 |
10.40 |
12.20 |
11.00 |
1.90 |
25 |
|
A20 |
5.70 |
6.40 |
7.00 |
6.70 |
5.00 |
8.00 |
9.20 |
7.20 |
6.90 |
1.20 |
6 |
|
A21 |
6.00 |
6.30 |
6.10 |
6.90 |
3.50 |
8.50 |
9.30 |
6.90 |
6.70 |
1.60 |
5 |
|
A22 |
8.60 |
8.10 |
8.40 |
9.10 |
5.80 |
7.40 |
10.10 |
8.60 |
8.20 |
1.20 |
14 |
|
A23 |
9.40 |
8.30 |
10.40 |
8.10 |
7.50 |
9.60 |
8.10 |
9.50 |
8.90 |
0.90 |
16 |
|
A24 |
5.60 |
6.90 |
6.30 |
7.30 |
5.00 |
8.10 |
9.90 |
7.10 |
7.00 |
1.40 |
7 |
|
A25 |
7.60 |
5.50 |
9.10 |
5.70 |
3.90 |
5.30 |
4.90 |
7.40 |
6.20 |
1.60 |
3 |
|
A26 |
7.60 |
6.90 |
7.70 |
8.40 |
6.90 |
6.60 |
7.80 |
8.00 |
7.50 |
0.60 |
10 |
It is necessary to carry out low-carbon technological innovations that support organic fertilizer production from agricultural waste to manage agricultural abundance. Therefore, it can help avoid land degradation and reduce opportunities to open new land to pursue fertile agricultural land and biogas production. This is also in line with the co-benefit adaptation strategies of the National Development Planning Agency to establish an Organic Fertilizer Management Unit (UPPO) and a balanced fertilization system for rice plants.
The policy of low-carbon technology innovation with zero-waste supports the action of applying organic fertilizers and utilizing agricultural waste, feed, and biogas. This technology innovation cannot be separated from policies that form the development foundation, which contributes to low carbon reduction [19, 20]. Farmers generally use chemical fertilizers with high nitrogen levels. Organic fertilizers are still rarely used because the costs are very high. Hence, subsidies from the government can help farmers and reduce dependence on chemical fertilizers and GHG emissions.
The action of utilizing abandoned land (A19) excels in the policy of optimizing agricultural productivity (P3), low-carbon technology innovation (P1), and strengthening networks related to low-carbon agriculture (P8). The policy should be supported by utilizing abandoned land. Many research indicated that most reserve land for future agricultural development is sub-optimal or degraded and neglected, spreading over Sumatra, Kalimantan, and Papua. Utilization of abandoned land can help deal with increasing food needs along with the increase in population, while also increasing agricultural production.
There are benefits of low-carbon technology innovation on potential sub-optimal land for agriculture. About 15% of the existing rice fields and 60% of other agricultural lands are also potential and productive sub-optimal lands which have contributed significantly to food security and national economic growth. This consists of dry land and wetland (swamp), and 30% is degraded/abandoned caused by deforestation and sub-optimal exploitation.
Peatlands used for the expansion of plantation areas have the status of abandoned. However, further development efforts have drawn criticism and led to polemics that have prompted the government to take land and forest governance policies, such as Presidential Instruction No. 10/2011 and No. 06/2013. These have implications for the direction and strategies for expanding agricultural land. Moreover, network strengthening is also needed to utilize abandoned land.
The action of developing superior low-emission and high-production (A2) excels in agricultural productivity optimization policies (P3), low-carbon technology innovation (P1), and strengthening networks related to low-carbon agriculture (P8). It is possible to implement a policy of increasing agricultural productivity in Indonesia by employing high emission and production varieties to meet the food requirements. Furthermore, low-emission varieties can also help reduce GHG emissions due to agricultural activities.
The selection of rice varieties planted in an area is determined by the potential for yields, ecosystem conditions, and resistance to endemic pests, diseases, and extreme conditions. Therefore, using high-yielding and low-emission rice varieties is a promising approach to reducing GHG emissions without demanding major land management changes. The low-carbon technology innovation policy used supports stability and increases productivity.
The Ministry of Agriculture has developed climate-smart agriculture/CSA technology to increase crop and livestock productivity as well as preserve soil fertility. As a result, farmers’ revenue and value can be increased while still being environmentally benign and resistant to climate change. Strengthening the network between the government, private sector, NGOs, and farmers needs to be conducted to develop low-emission and high-productivity varieties.
Based on Figure 6, the results of the MULTIPOL analysis are obtained in the form of a profile map therefore, the relevant relationship between action and policy can be seen. With an average score of 12.5, the practice of using subsidized organic fertilizer stands out among the other eight programs. GHG emissions from chemical fertilizers in the grain production process are the largest contributor to the potential impact of global warming, with an average of 20.94% [21]. According to data from the Ministry of Agriculture, in 2019, organic fertilizer subsidies have only been allocated 8.74%, and chemical fertilizer subsidies dominate the allocation of funds. The use of chemical fertilizers increases and negatively impacts the environment. There was a decrease in the productivity of rice fields according to BPS in 2018 from 52.03 Ku/Ha to 2019 of 51.14 Ku/Ha. Meanwhile, there was a 7.46 million ha increase in the area of raw rice fields in 2019 over the previous year by 7.11 million ha. Organic fertilizers affect soil by reducing acidification and achieving LCD in the agricultural sector [22, 23].
Figure 6. Profile map actions-policies
The policy that supports the action of subsidized organic fertilizer is the circular economy, with an average score of 14.2. This is appropriate with using organic fertilizers to reduce chemicals. Organic waste can be converted into fertilizer to boost soil nutrient levels and promote a circular economy in the zero-waste concept.
The circular economy policy is efficient when applied to collaborative actions with research institutions and water-saving irrigation. Figure 6 shows that maximizing agricultural productivity dominates the use of abandoned land, the development of low-emission and high-production varieties, the improvement of agricultural infrastructure, and seed subsidies for low-emission varieties.
Figure 7. Actions-policies closeness map
Based on Figure 7, the closeness map between action and policy can be explained as follows:
(1) Low Carbon Technology Innovation Policy (P1). The closest and most relevant actions are cooperation with research institutes (A1), developing low emission and high production varieties (A2), developing prescription farming technology (A3), water-saving irrigation (A8), improving agricultural infrastructure (A11), improving animal feed quality (A13), low carbon agricultural extension professional certificate (A18), utilizing abandoned land (A19), and clean and healthy farming system (A23).
(2) Policy Support fiscal incentives for low-carbon agricultural inputs and outputs (P2). The closest and most relevant actions are cooperation with research institutions (A1), developing low-emissions and high-production varieties (A2), applying subsidized organic fertilizers (A4), implementing subsidies for low-emission varieties (A5), implementing low-emission agricultural product price guarantees (A6), low-carbon-based agricultural insurance (A7), improving agricultural infrastructure (A11), utilizing abandoned land (A19), clean and healthy farming systems ( 23), guaranteeing the marketing of low-carbon agricultural products (A25), and empowering the Service Post for Biological Agencies and APH Development (A26).
(3) Optimization of agricultural productivity (P3). The closest and relevant actions are developing low-emissions and high-production varieties (A2), implementing seed subsidies for low-emissions and high-production varieties (A5), implementing price guarantees for low-emissions agricultural products (A6), low-carbon agricultural insurance (A7), livestock crop integration system/SITT (A10), improving agricultural infrastructure (A11), improving animal feed quality (A13), education on low carbon agricultural products (A14), professional certificate of low carbon agricultural extension (A18), utilizing abandoned land (A19), clean and healthy farming system (A23), and guarantee of marketing of low carbon agricultural products (A25).
(4) Co-benefit adaptation strategy (P4). The closest and most relevant actions are collaborating with research institutions (A1), developing low emission and high production varieties (A2), developing prescription farming technology (A3), applying subsidized organic fertilizers (A4), water-saving irrigation (A8), improving the quality of animal feed (A13), utilizing abandoned land (A19), central and local regulations that support low carbon agriculture (A20), and utilizing biogas from animal manure (A22).
(5) Increasing the capacity and quality of human resources (P5). The closest and most relevant actions are empowering Farmers in IPM/P4 (A9) Correctional, implementing the livestock crop integration system/SITT (A10), education on low carbon agricultural products (A15), HR training for low carbon farmers (A16), agricultural extension certificates low carbon (A18), and empowering the Biological Agency Service Post and APH Development (A26).
(6) Improvement of agricultural land governance (P6). The closest and most relevant actions are developing prescription farming technology (A3), water-saving irrigation (A8), low-carbon farmer professional certificates (A17), central and local regulations that support low-carbon agriculture (A20), agricultural land governance regulations (A21), and utilizing biogas from animal manure (A22).
(7) Circular Economy (P7). The closest and most relevant actions are developing prescription farming technology (A3), applying subsidized organic fertilizers (A4), water-saving irrigation (A8), utilizing plant-based pesticides and biological insecticides (A12), education and advocacy on the use of organic fertilizers (A14), central and local regulations that support low-carbon agriculture (A20), regulations for agricultural land management (A21), utilizing livestock manure biogas (A22), and using ameliorants (A24).
(8) Strengthening the network related to low carbon agriculture (P8). The closest and relevant actions are cooperation with research institutions (A1), developing low-emissions and high-production varieties (A2), implementing guaranteed low-emission agricultural products (A6), improving agricultural infrastructure (A11), improving animal feed quality (A13), low carbon agricultural extension certificate (A18), utilizing abandoned land (A19), utilizing livestock manure biogas (A22), and clean and healthy farming system (A23).
3.2.2 Policy-based evaluation of scenarios
Based on Table 3, the highest policy is in the gradual scenario (S1), namely the circular economy (P7) and improving agricultural land governance (P6). The highest speed scenario (S2) is the circular economy (P7), and the strategy adaptation co-benefits (P4). Meanwhile, the moderate scenario is low carbon technology innovation policy (P1) and optimization of agricultural productivity (P3) scores. The policy score on the scenario with the highest average value is the circular economy (P7) of 15.7, the adaptation strategy of co-benefit (P4) of 13, and the strengthening of the low-carbon agricultural network (P8) of 12.4. Furthermore, the results of the analysis show that the speed scenario (S2) obtains a higher score than the gradual (S1) and moderate scenarios (S3).
Table 3. Policy scores against scenarios
|
Policy |
Scenario |
Mean |
Deviation Standard |
Rank |
||
|
S1 |
S2 |
S3 |
||||
|
P1 |
10.10 |
14.20 |
12.90 |
12.40 |
1.70 |
5 |
|
P2 |
12.00 |
12.10 |
12.10 |
12.10 |
0 |
4 |
|
P3 |
11.60 |
10.90 |
12.90 |
11.80 |
0.80 |
2 |
|
P4 |
12.20 |
14.40 |
12.20 |
13.00 |
1.00 |
7 |
|
P5 |
10.40 |
6.30 |
10.00 |
8.90 |
1.80 |
1 |
|
P6 |
12.60 |
11.60 |
11.50 |
11.90 |
0.50 |
3 |
|
P7 |
16.20 |
18.70 |
12.40 |
15.70 |
2.60 |
8 |
|
P8 |
12.20 |
12.60 |
12.40 |
12.40 |
0.10 |
6 |
Figure 8. Profile map policies- scenarios
According to Figure 8, the highest score in the gradual scenario is on circular economy policies and improving agricultural land governance. This shows that the circular economy policy is in line with reducing GHG emissions while improving land management is also very important to avoid the conversion of agricultural land. Furthermore, the large-scale clearing of agricultural land also needs to be reckoned with the environmental impacts. It increases knowledge of farmers and the community regarding the importance of reducing GHG emissions. It can also provide awareness of the impact on health, and the role of extension workers is very important because they are in the upstream low-carbon agricultural sector. Therefore, the gradual scenario for LCD is carried out in stages by balancing the reduction of GHG emissions and increasing agricultural production.
The speed scenario can be used in circular economy policies, co-benefit adaptation strategies, and strengthening networks related to low-carbon agriculture. This policy has a higher average score than the gradual and moderate scenarios. In the speed scenario, the policy for optimizing agricultural productivity and increasing the capacity and quality of human resources gets the lowest average score compared to others, therefore, the policy is not relevant. This is also in line with the description of the speed scenario, which prioritizes the reduction of GHG emissions in the agricultural sector. This policy is in line with the 2020-2024 RPJMN set by the government.
In the moderate scenario, the policy with the highest score is seen to optimize agricultural productivity by minimizing the use of chemical fertilizers and pesticides, optimizing the use of agricultural land while maximizing production, as well as low-carbon technology innovation policies, efforts made in collaboration with research institutions, developing low-emission varieties, applying prescription farming technology to minimize the impact of emissions while increasing agricultural production.
This is consistent with the description that the moderate scenario of agricultural LCD prioritizes agricultural production. The MULTIPOL analysis shows that the highest score in the gradual scenario (S1) is circular economy policy (P7) of 16.2 and agricultural land governance improvement (P6) of 12.6. For the speed scenario (S2), the highest is circular economy (P7) of 18.7 and adaptation strategy of co-benefit (P4) of 14.4. In the moderate scenario, low-carbon technology innovation policy (P1) and optimization of agricultural productivity (P3) have the same score of 12.9. The closeness map between scenarios and policies can be seen in Figure 9.
Figure 9. Policies-scenarios closeness map
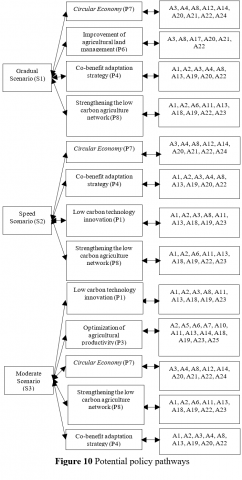
The close relationship between scenarios and policies shows that circular economy policies (P7), improving agricultural land governance (P6), co-benefit adaptation strategies (P4), and strengthening low-carbon agricultural networks (P8) are more relevant in gradual scenarios (S1). In the speed scenario (S2), circular economy (P7), a co-benefit adaptation strategy (P4), low-carbon technology innovation (P1), and strengthening low-carbon agricultural networks (P8) can be implemented. For the moderate scenario (S3), there are five relevant policies, consisting of low-carbon technology innovation (P1), optimization of agricultural productivity (P3), circular economy (P7), strengthening of low-carbon agricultural networks (P8), and co-benefit adaptation strategies (P4).
Figure 10. Potential policy pathways
According to Figure 10, Circular Economy (P7), Co-benefit adaptation strategy (P4), and strengthening low-carbon agricultural networks (P8) are included in S1, S2, and S3. A circular economy is an economic idea that is not linear but also considers the environment [24]. This is in line with the National Development Planning Agency’s policy that the implementation of the Circular Economy can support a green economy and LCD through the creation of green jobs and process efficiency improvements. This is achieved by optimizing resource use, and reducing material consumption, waste, and GHG emissions. Therefore, the Circular Economic concept aligns with Indonesia’s 2045 vision as a long-term policy. It can achieve about 15% and 11% of its lowest and highest target to reduce GHG emissions by 2030, thereby supporting low-carbon development.
Co-benefit adaptation strategies are very important in dealing with climate change risks. The adaptation resulting from the parties’ actions and economic diversification plans can contribute to mitigation outcomes, making finance flows consistent with a pathway toward low greenhouse gas emissions and climate-resilient development [25].
The result of the 23rd Conference of Parties United Nations Framework Conference on Climate Change (COP-UNFCCC) in Bonn was the Koronivia Joint Work on Agriculture (KJWA). KJWA emphasizes the importance of adaptation, co-benefits, and resilience of agricultural systems in the face of climate change. The strategy is also a priority, as indicated in the Ministry of Agriculture’s Strategic Plan 2020-2024. Therefore, adaptation programs and actions are expected to provide benefits and co-benefits.
The added value is the benefit of adaptation activities in reducing GHG emissions. Therefore, actions to strengthen the low-carbon agricultural network need to be conducted with the role of the provisional government by including LCD in the RPJMD. The goal is to curb the pace of climate change and network with other countries, NGOs, and related partners to exchange information related to reducing GHG emissions.
The prediction results of low-carbon development in the agricultural sector using machine learning ANN show that provinces that need to adopt low-carbon development in the agricultural sector are dominated by agricultural production centers such as Java, Kalimantan and Sumatra islands. The results of the training and testing show the accuracy of the regional prediction pattern with the highest and highest level of accuracy in the simulation with the inputs that affect the production of rice, the area of degraded/critical land, and the number of agricultural workers. This needs to be a concern of the government because the agricultural sector is a sector that is a national priority, especially in food production as a support for food security. To increase rice production and maintain it without harming the environment is a big challenge. For this reason, a strategy is needed to ensure a food production system that is able to increase production by maintaining sustainable ecosystems, strengthening adaptive capacity to climate change, extreme weather, drought, flooding, and other disasters, as well as improving soil and land quality progressively.
This study shows that a policy framework for low carbon development in the agricultural sector using the MULTIPOL method provides alternative solutions for selected scenarios along with the necessary policy directions for low carbon development in the agricultural sector along with proposed actions or programs. The evaluation results show that the speed scenario is the best scenario, which has the highest mean score compared to others. In this scenario, the lowest and highest scores are 6.3 and 18.7 on human resources and circular economy quality. The policy alternatives with the highest scores are circular economy, co-benefit adaptation strategies, and strengthening low-carbon agricultural networks. Priority actions needing to be implemented to follow this policy are programs for substituted organic fertilizers, utilizing abandoned land, developing low-emissions and high-production varieties, integrating livestock crops/SITT, and cooperating with research institutions.
Organic fertilizer substitution programs/actions to replace chemical fertilizers are very appropriate, this agrees with [26] that in an effort to achieve sustainable agriculture, efforts are made to reduce inputs in the form of factory-produced chemicals (fertilizers and pesticides) and even eliminate them if possible and replace them with inputs. organic. Organic fertilizers can provide important nutrients for plants and can increase crop productivity, but the use of organic fertilizers can leave a residual effect in the soil that can benefit plants [26]. Empowerment efforts related to organic fertilizers are by providing training and skills to farmers to produce their own organic fertilizers from natural materials (biological raw materials), livestock manure and plant residues that are composted using microbes, motivating farmers to manage organic materials, especially on dry land. Farmers need to be empowered to be able to independently make and provide their own organic fertilizer for their paddy fields. The zero-waste farming system obtained by implementing crop-livestock integration agriculture needs to be developed in rice production centers.
A policy framework that is offered provides the possibility of decision-making flexibility on several possible changes in situations and conditions that occur in the future so that the expected low-carbon development can be achieved. This research shows that the integration between scenarios, policies and actions results in a combination of policies with several supporting actions, no one policy is only influenced by one action.
The limitation of this research is that the involvement of the private sector needs to be analyzed further in relation to the low carbon development of the agricultural sector. Further research can include indicators of the main commodities of each province, linked to the non-agricultural sector so that it can enrich the analysis of low carbon development policies as a whole.
[1] Norse, D. (2012). Low carbon agriculture: Objectives and policy pathways. Environmental Development, 1: 25-39. https://doi.org/10.1016/j.envdev.2011.12.004
[2] Tang, D., Ma, T., Li, Z., Tang, J., Bethel, B.J. (2016). Trend prediction and decomposed driving factors of carbon emissions in Jiangsu Province during 2015-2020. Sustainability, 8: 1018. https://doi.org/10.3390/su8101018
[3] Qiao, Q. (2021). Simulation and prediction of carbon emissions from land use in Guiyang under the background of low carbon economy. Guizhou University of Finance and Economics, Guizhou, China. https://doi.org/10.21203/rs.3.rs-1726918/v1
[4] Pan, Y., Wang, C., Yu, B., Yang, Z., Ren, K. (2022). Prediction model of total agricultural carbon emissions in Henan Province based on neural network and non-linear surface fitting. Research Square. https://doi.org/10.21203/rs.3.rs-1726918/v1
[5] Huang, H.F., Wu, X.M., Cheng, X.F. (2021). The prediction of carbon emission information in Yantze River Economic Zone by deep learning. Land, 10(12): 1380. https://doi.org/10.3390/land10121380
[6] Borychowski, M., Grzelak, A., Popławski, L. (2021). What drives low carbon agriculture? The experience of farms from the Wielkopolska region in Poland. Environmental Science and Pollution Research, 29: 18641-18652. https://doi.org/10.1007/s11356-021-17022-3
[7] Vinholis, M., Saes, M., Carrer, M., Filho, H. (2021). The effect of meso-institutions on adoption of sustainable agricultural technology: A case study of the Brazilian Low Carbon Agriculture Plan. Journal of Cleaner Production, 280: 124334. https://doi.org/10.1016/j.jclepro.2020.124334
[8] Chirinda, N., Arenas, L., Katto, M., Loaiza, S., Correa, F., Ishthitani, M., Loboguerrero, A., Baron, D., Graterol, E., Jaramillo, S., Torres, C., Arango, M., Guzman, M., Avila, I., Hube, S., Kurtz, D., Zorilla, G., Terra, J., Irisarri, P., Tarlera, S., Lahue, G., Scivittaro, W., Noguera, A., Baye, C. (2018). Sustainable and low greenhouse gas emitting rice production in Latin America and the Caribbean: A review on the transition from ideality to reality. Sustainability. 10(3): 671. https://doi.org/10.3390/su10030671
[9] Fan, S., Ramirez, A. (2012). Achieving food security while switching to low carbon agriculture. Journal of Renewable and Sustainable Energy, 4(4): 041405. https://doi.org/10.1063/1.3670412
[10] Tan L, Liu C. (2012). Decision-making model of low-carbon economy. Procedia Engineering. 37: 96-100. https://doi.org/10.1016/j.proeng.2012.04.209
[11] Graupe, D. (2007). Principles of Artificial Neural Networks. Volume 6, 2nd Edition. Advanced Series on Circuits and Systems. World Scientific, Singapore.
[12] Godet, M. (2001). Creating futures: Scenario planning as a strategic management tool. Economica, Paris, France.
[13] Godet, M., Monti, R., Meunier, F., Roubelat, F. (2004). Scenarios and Strategies: A Toolbox for Problem Solving. Paris: Cahiers du LIPSOR, Laboratory for Investigation in Prospective and Strategy, Paris, France.
[14] Fauzi, A. (2019). Teknik Analisis Keberlanjutan. PT. Gramedia Pustaka Utama, Jakarta, Indonesia.
[15] Panagiotopoulou, M., Stratigea, A. (2014). A participatory methodological framework for paving alternative local tourist development paths—The case of Sterea Ellada Region. European Journal of Futures Research, 2: 44. https://doi.org/10.1007/s40309-014-0044-7
[16] Sheela, K.G., Deepa, S.N. (2014). Review on methods of hidden neurons in neural networks. Mathematical Problems in Engineering, 2013: 425740. https://doi.org/10.1155/2013/425740
[17] Wang, Q.S., Liu, M.Q., Tang, Y.Z., Yuan, X.L., Ma, Q. (2020). Evaluation and advancement of the integrated circular economy model of farming and stock raising. Chinese Journal of Population, Resources, and Environment, 18(4): 350-360. https://doi.org/10.1016/j.cjpre.2021.04.012
[18] Herrador, M., de Jong, W., Nasu, K., Granrath, L. (2022). Circular economy and zero-carbon strategies between Japan and South Korea: A comparative study. Science of the Total Environment, 820: 153274. https://doi.org/10.1016/j.scitotenv.2022.153274
[19] Lai, X., Shi, Q. (2020). Green and low carbon technology innovations. Innovation Strategies in Environmental Science, 7: 209-253. https://doi.org/10.1016/B978-0-12-817382-4.00007-1
[20] Li, W.C., Xu, J., Ostic, D., Yang, J.L., Guan, R.D., Zhu, L. (2021). Why low-carbon technological innovation hardly promote energy efficiency of China? – Based on spatial econometric method and machine learning. Computers and Industrial Engineering, 160: 107566. https://doi.org/10.1016/j.cie.2021.107566
[21] Ministry of National Development Planning/, National Development Planning Agency, Kementerian PPN/Bappenas. (2019). Low carbon development: A paradigm shift towards a green economy in Indonesia. Full Report. Badan Perencanaan Pembangunan Nasional, Jakarta, Indonesia.
[22] Han, Z., Lin, H., Xu, P., Li, Z., Wang, J., Zou, J. (2022). Impact of organic fertilizer substitution and biochar amendment on net greenhouse gas budget in a tea plantation. Agriculture, Ecosystems and Environment, 326: 107779. https://doi.org/10.1016/j.agee.2021.107779
[23] Clark, S. (2020). Organic farming and climate change: The need for innovation. Sustainability, 12(17): 7012. https://doi.org/10.3390/su12177012
[24] Galvao, G., Nadae, J., Clemente, D., Chinen, G., Carvalho, M. (2018). Circular economy: Overview of barriers. Procedia CIRP, 73: 79-85. https://doi.org/10.1016/j.procir.2018.04.011
[25] Gaskell, M., Mitchell, J., Smith, R., Koike, S. (2002). Soil fertility management for organic crops. University of California, California, USA.
[26] Ghosh, P.K., Ajay, K.K., Bandyopadhyay, M.C., Manna, K.G., Mandal, A.K., Hati, K.M. (2004). Comparative effectiveness of cattle manure, poultry manure, phospho- compost and fertilizer-NPK on three cropping system in vertisols of semi-arid tropics. II. Dry matter yield, nodulation, chlorophyll content andenzymeactivity. Bioresource Technology. 95(1): 85-93. https://doi.org/10.1016/j.biortech.2004.02.012