Olumide S. Adesina* | Adedayo F. Adedotun | Daniel S. Oladepo | Tolulope F. Adesina
© 2022 IIETA. This article is published by IIETA and is licensed under the CC BY 4.0 license (http://creativecommons.org/licenses/by/4.0/).
OPEN ACCESS
There have been concerns globally as to whether taking COVID-19 vaccination is harmful or not. In this study, we conducted an online survey to measure the knowledge and attitude of people, first about COVID-19, and second about COVID-19 vaccination—various analyses such as descriptive statistics, logistic regression, and support vector regression with k-fold cross-validation. The support vector machine and tuned support vector machine suggest a better fit based on cross-validation error. The results show that immigration requirements significantly explain why an individual would accept the COVID-19 vaccine. This study suggests that people in authority should look into people's concerns regarding taking the COVID-19 vaccine and address them accordingly. The study aims to draw the attention of the people to the concern that surrounds taking COVID-19 vaccination and explored various statistical techniques to draw inference.
COVID-19, vaccination, logistic regression, support vector machine, machine learning
The human coronavirus was first discovered in 1965, responsible for a significant proportion of upper respiratory tract infections in humans. The study also showed that no fewer than five mutations of new human coronaviruses have been discovered, which has resulted in illness and mortality [1, 2]. Severe Acute Respiratory Syndrome (SARS) outbreak started in southern China in 2002-2003 as a form of coronavirus and spread worldwide. The outbreak of SARS was found in twenty-nine (29) countries in Asia, North America, South America, and Europe. 774 SARS-related mortalities were reported during this period, while 8098 individuals have infected altogether [1]. Sometime in late 2019, an acute respiratory disease caused by SARS emerged named COVID-19. It was first discovered in Wuhan, China, and has claimed thousands of lives since it was first discovered.
In late 2021 deadly respiratory diseases were discovered, which have mutated from SARS called delta and Omicron variant. In the light of this, the World Health Organisation warns that the variants should not be trivialised as they can be equally deadly as or more than COVID-19 [3]. There are measures to avoid the spread of the COVI-19 virus, including social distancing, wearing nose masks, and washing of hands.
Vaccination is known to be a preventive measure against infectious diseases. Infectious diseases have become a threat to people’s lives for many years, and controlling the spread of these infectious diseases has become essential [4]. Vaccination against infectious diseases has been broadly used to reduce the rate of spread or eliminate their spread [5-8].
History has it that Edward Jenner was the founder of vaccinology in 1796, in a way to inoculate against smallpox. Ever since, other vaccines to inoculate against epidemics such as polio, Cholera Vaxchora, Human Papillomavirus (HPV), Hepatitis B, Yellow fever, and many more.
The COVID-19 vaccines, on the other hand, is said not to prevent contracting the SARCOV virus but it helps a vaccinated person not to feel the impact of the virus as much as a person who is not vaccinated.
According to Rahman and Zou [9], vaccines teach one’s immune system to recognise and fight against the COVID-19 virus, thereby preventing illness should one contract the virus. COVID-19 vaccines such as AstraZeneca, Moderna, and Pfizer are being taken as more vaccines are being developed. The associated side effects of the COVID-19 vaccines that may occur include but are not limited to pain and swelling on the spot (usually the left shoulder), tiredness, headache, mild fever, and severe rare side effects. The study of ref. [10-15] are related studies to the attitude and practises of health-workers can towards COVID-19 vaccination.
In this study, a survey on the knowledge and attitude of people towards COVID-19 vaccination and analysed using descriptive statistics, logistic regression, and support vector regression. The remaining part of the study includes the methodology in section 2, results in section 3, summary and conclusion in section 4, recommendation in section 5.
The logistic regression and support vector machine technique is used to analyse the data. The procedures are highlighted as follows:
2.1 Logistic regression
The response variable in this study is binary, codes as (vaccinated=1, not vaccinated=0), and binary response variable cannot be modelled using linear regression. If the response variable is binary, the binary logit model applies to the model an outcome's probability. Consider a linear probability model:
$P(X)=\beta_0+\beta_1 X$ (1)
Logistic regression uses the logistic function
$P(X)=\frac{e^{\beta_0+\beta_1 X}}{1+e^{\beta_0+\beta_1 X}}$ (2)
From (2) we obtain the odd ratio is expressed as
$\frac{P(X)}{1-P(X)}=e^{\beta_0+\beta_1 X}$ (3)
Further workings give
$\log \left(\frac{P(X)}{1-P(X)}\right)=\beta_0+\beta_1 X$ (4)
The left hand side of (4) is known as logit or log-odds.
The parameters $\beta_0+\beta_1$ in Eq. (2) to (4) can be obtained using the maximum likelihood estimation approach.
2.2 Support vector classifier
The support vector classifier (SVC) classifies observations into hyperplanes. The idea of determining a hyperplane that separates observations distinguishes the SVC from classical techniques such as logistic regression. SVC classifies observations based on the side of the hyperplane it falls on. If we have parameters $\beta_0, \beta_1, \beta_2 \ldots, \beta_p$, a $p$ -dimensional hyperplane can be described expresses as:
$\mathrm{Ң}=\beta_0+\beta_1 X_1+\beta_2 X_2+\cdots+\beta_p X_p$ (5)
If a point $X=\left(X_1, X_2, \ldots, X_p\right)^T$ in $p$ -dimensional space satisfies $\mathrm{Ң}=0$ then X lies on the hyperplane. If $Ң>0$, then X lies to one side of the hyperplane, and $Ң<0$ then X lies on the other side of the hyperplane. So, the sign of Ң in (5) after calculating would determine the side of the hyperplane a point falls.
SVC is the solution to the optimization problem
$\max. _{\beta_0, \beta_1, \ldots, \beta_p, \epsilon_1, \ldots, \epsilon_n} M$ (6)
Subject to
$\sum_{j=1}^p \beta_j^2=1$ (7)
$y_i\left(\beta_0+\beta_1 x_{i 1}+\beta_2 x_{i 2}+\cdots, \beta_p x_{i p}\right) \geq M\left(1-\epsilon_i\right)$ (8)
$\epsilon_i \geq 0, \sum_{i=1}^n \epsilon_i \leq C$ (9)
where, M the width of the margin of the optimization problem, and the aim is to make M large as possible, and C is a non-negative tuning parameter. C is important in the statistical learning technique because it helps in the bias-variance trade-off [16].
2.3 Support vector regression
The support vector machine (SVM) is an extension of the support classifier to include non-linear class boundary. Support vector classifier suitable if the boundary between two classes is linear and not suitable in the case of non-linear boundaries. The support vector machine uses kernels to enlarge the feature space to give room for a non-linear boundary between the classes. If we have two observations $x_i$, and $x_i^{\prime}$ then their inner products can be expressed as
$\left(x_i, x_i^{\prime}\right)=\sum_{j=1}^p x_{i j} x_{i j}^{\prime}$ (10)
The linear SVC can be expressed as
$f(x)=\beta_0+\sum_{i=1}^p \alpha_i\left(x, x_i\right)$ (11)
$K\left(x_i, x_i^{\prime}\right)=\left(1+\sum_{j=1}^p x_{i j} x_{i j}^{\prime}\right)^d$ (12)
where, $\left(x_i, x_i^{\prime}\right)$ is the inner product of two observation $x_i, x_i^{\prime}$ and K is known as the kernel. The function of K is to compare the similarity of two observations. If $d>1$ in Eq. (12), we have an SVC algorithm with a significantly flexible decision boundary, if d=1 , we have a support vector classifier. The combination of support vector classifier with a non-linear kernel such as that of (12) results in a support vector machine.
$f(x)=\beta_0+\sum_{i=1}^n \alpha_i K\left(x, x_i\right)$ (13)
The output of the support vector regression follows the Eq. (13), just as we have in the general linear model, and there are n parameters $\alpha_i, i=1,2, \ldots, n$ one for each training observation. It follows that $\alpha_i\in\mathbb{R}\backslash\{0\}$ apply only to support vectors in the solution. That is, $\alpha_i$ would only zero if a training observation is not a support vector.
2.4 The data
An online survey was conducted between 30th November 2021 and 4th January 2022. The participants include people residents in Nigeria (88.3%) and non-Nigerian residents (16.7%). Table A1 comprises of the respondents' demography characteristics, "Vaccination Status," and the "Type of COVID-19 Vaccine taken". Table A1 contains the abridged questions; complete questions can be accessed online [17].
2.5 Method of analysis
The Statistical Package for the Social Sciences (SPSS) was used to obtain the frequencies in Tables A1, Table A2, Table A3, Table A4, and Table A5, while Figure B1 was obtained from the Google form completed by respondents. A software package by R Core Team [18] was used to fit the regression model and the Support Vector Regression model. Packages such as “e1071” by Meyer et al. [19], “hydroGOF” by Zambrano-Bigiarini [20], and “boot” by Canty and Riple [21]. Functions in the package “e1071” were used to fit the Support Vector Regression (SVR) model, the functions in the “hydroGOF” package were used to obtain the errors, while the functions in the boot were used to obtain the cross-validation error. 10-fold cross-validation was used for SVR and the logistic regression. It means that data was divided into ten folds, 90% training set, and 10% testing set in each of the ten iterations.
Table A1 in the appendix reveals that the respondents are more non-health workers than health workers. There were also more males than females, with five respondents. Christians are significantly more than Muslims. Table A1 also shows that more people who have been vaccinated (56.8) were more than those who have yet to be vaccinated (43.2%). Table A1 also revealed that the respondents took more AstraZeneca Vaccine more than any other vaccine. The results show that 155 (83.60%) health workers have been vaccinated, while 118 (50.48%) of Non-Health Workers have been vaccinated, shown in Table A4.
Table A1 to Table A5 in the appendix contains the detailed tabulation of the responses. Responses relating to reasons why people would not like to take the vaccine are tabulated in Table A5 sought to identify why people would not want to take the COVID-19. Table A5 reveals that 79 (28.9%) believed it was due to a lack of correct information about the vaccine. 3 (1.1%) opined that it was due to religious reasons, 45 (16.5%) said it was due to the side effect. 7(2.6%) said it was because of an underlying ailment, 99 (36.3%) could not give any reason in particular, and 40 (14.7%) mentioned other reasons.
Other reasons people would not take the vaccine include:
As mentioned under section 2.4, k-fold cross-validation was used to determine the cross-validation error. The results are presented in section 3.1 and 3.2 respectively.
3.1 Logistic regression
From Table 1, each one-unit change in the number of people who would take the COVID-19 vaccine based on travel requirements will decrease the log odds vaccination status by 0.9467, and its p-value indicates that it is significant in determining vaccination status. The response variable for vaccination status was coded (Not Vaccinated=0, vaccinated=1). V.trav.Req in Table 1 stands for “vaccinated based on travel requirements,” was coded as (N0=0, may be=1, and Yes=2). V.NRA stands for not vaccinated due to unavailability of vaccines was not significant.
Table 1. Logistic regression output
|
|
Estimate |
Std. Error |
z value |
Pr(>|z|) |
|
(Intercept) |
1.3514 |
0.3648 |
3.704 |
0.000212 |
|
V.trav.Req |
-0.9467 |
0.1656 |
-5.717 |
1.08e-08 |
|
V.NRA |
-0.1470 |
0.1170 |
-1.257 |
0.208902 |
Since V.trav.Req is significant; from Eq. (2), we calculate the probability as follows:
$\operatorname{Pr}(C . V=Y e s \mid T R=Y e s)=\frac{e^{1.3514-(0.9467 \times 2)}}{1+e^{1.3514-(0.9467 \times 2)}}$
$=\frac{0.58158}{1.58158}=0.3677$
$\operatorname{Pr}(C . V=Y e s \mid T R=N o)=\frac{e^{1.3514-(0.9467 \times 0)}}{1+e^{(1.3514-0.9467 \times 0)}}$
$=\frac{3.8628}{4.8628}=0.7943$
Therefore, the probability that an individual would take COVID-19 vaccination based on immigration requirements is 0.3677, while the likelihood that an individual would take COVID-19 vaccination based unconditionally is 0.7943. The results suggest that most COVID-19 vaccinated individuals did not get vaccinated based on travel or immigration conditions; they took it for preventive purposes.
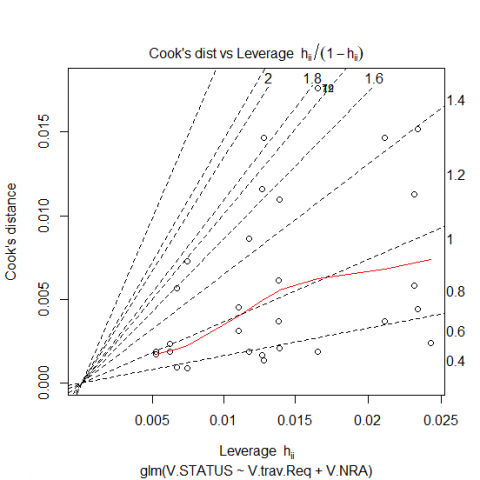
Figure 1. Cook’s distance versus Leverage
Figure 1 shows Cook’s distance versus the Leverage plot; the points towards the top right shows that large leverage and are potentially influential points in the logistic regression estimation.
3.2 Support vector regression
Table 2 shows the estimated parameter using logistic regression, support vector regression (SVR), and tuned SVR with their corresponding The Root Mean Square Error (RMSE) and Mean Square Error (MSE). The RMSE measures how spread out the residuals are from the regression line. The MSE assesses the mean squared difference between the observed and predicted values. A model with a lower RMSE and MSE suggest a better fit. The tuned SVR produced the least SVR, suggesting the most reliable model among the trained models.
Table 2. SVR, tuned SVR and logistic regression parameters
|
|
Logistic Reg |
SVR |
Tuned SVR |
|
Intercept |
1.3514 |
0.19333 |
0.11758 |
|
V.trav.Req |
-0.9467 |
-5.46892 |
-4.94196 |
|
V.NRA |
-0.1470 |
-0.33048 |
-0.3864 |
|
RMSE |
0.8086 |
0.50421 |
0.49670 |
|
MSE |
0.6539 |
0.25423 |
0.24671 |
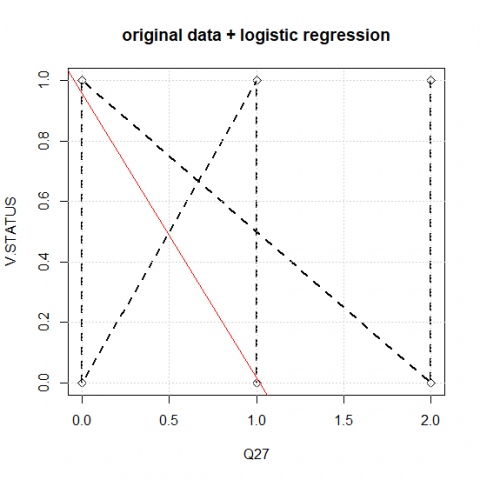
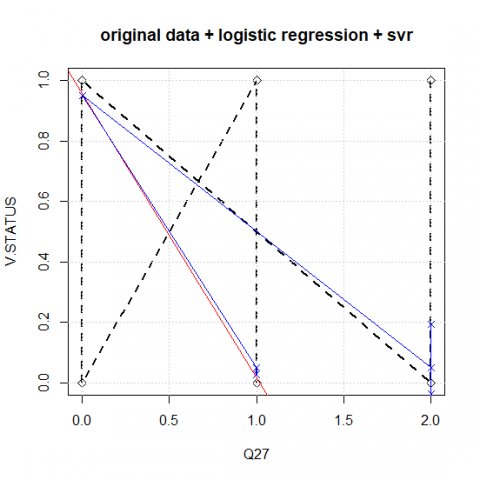
(a)
(b)
Figure 2. (a) Plot of original, logistic regression; (b) Plot of original, logistic regression, and support vector regression
Figure 2a shows the plot of Original and logistic regression; the black dotted zigzag lines represent the original data, while the red line shows the logistic regression fit. Figure 2b shows the plot of actual data, logistic regression, and support vector regression. The logistic regression and support vector regression almost overlap, which indicates that there is not too much difference in the estimated results, such as mentioned by Odekina et al. [14], due to similarity in their loss function. The most preferred model would be determined based on estimation error.
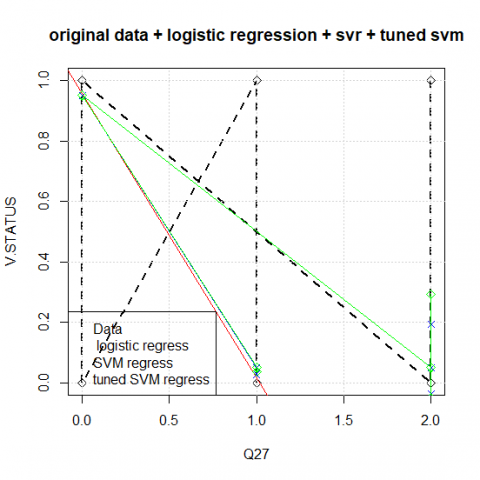
Figure 3. Plot of original, logistic regression, support vector regression, and tuned support vector regression
Figure 3 shows the original data plot, logistic regression, support vector regression, and tuned support vector regression. The logistic regression, support vector regression, and tuned SVR almost overlap, which indicates that there is not too much difference in the estimates of the results. However, the choice model is the tuned SVR based on the RMSE values. The tuned SVR has an RMSE value of 0.49671 relative to the SVR and logistic regression of 0.5042 and 0.8086, respectively.
Figure 4. Performance of SVM
Figure 4 shows the performance of SVM. The figure shows that SVM's best performance is 0.250, following the tuned SVR to identify the best model. The best model can be identified with the lowest MSE (0.24671) in Table 2, approximately 0.2500. The lower part of the plot, which is also the darker region, provides the best model from trained models.
To measure the Knowledge, Perception, and Attitude of Respondents on COVID-19 Vaccination, we conducted a T-test and presented it in Table 3.
Table 3. T- test for the significance of knowledge, perception and attitude of respondents on COVID-19 vaccination
|
|
T |
df |
Sig. (2-tailed) |
Mean difference |
95% L-C.I |
95% U-C.I |
|
Knowledge |
9.322 |
272 |
0.000 |
.637 |
.50 |
0.77 |
|
Perception |
-46.50 |
272 |
0.000 |
-2.293 |
-2.39 |
-2.20 |
|
Attitude |
5.220 |
272 |
0.000 |
0.601 |
0.37 |
0.83 |
Table 3 present shows the results on the knowledge of the subject of COVID-19 Vaccination. The 95% L-C.I stand for a 95% lower confidence interval of the difference while 95% U-C.I stand for a 95% upper confidence interval of the difference. The null hypothesis that the respondents do not have significant knowledge of the issue of Vaccination was rejected at a T-value of 9.322, 272 degrees of freedom, p-value (0.000). We then conclude that the respondents are knowledgeable about COVID-19 Vaccination.
In perception, the null hypothesis of the respondents having conservative ideas on the subject of Vaccination was rejected at the T-value of -46.50, 272 degree of freedom, and p-value (0.000). We then conclude that the respondents are not conservative about the idea of COVID-19 Vaccination. Finally, on attitude, the null hypothesis of the respondents having a repulsive attitude towards COVID-19 Vaccination was rejected at the T-value (5.220), degree of freedom 272, p-value (0.000). We then conclude that the respondents do not have repulsive attitudes towards COVID-19 Vaccination.
In this study, a survey was conducted to sample respondents' knowledge, attitude, and perception on COVID-19 and COVID-19 vaccination. An online survey was conducted, and responses were analysed. The results show that 155 (83.60%) of health workers have been vaccinated, while 118 (50.48%) of Non-Health Workers have been vaccinated. The study aims to determine the factors contributing to people's decision to either take the COVID-19 vaccine or not. Therefore, question 23 and question 27 were used for this purpose; question 23 was used to determine if people take COVID-19 was due to immigration compulsory requirements. At the same time, question 27 helped determine if a low supply of the vaccine was the reason why some people have not been vaccinated. Logistic regression analysis was first conducted on the data using 10-fold cross-validation. The results show that immigration requirements significantly explain why an individual would accept to take the COVID-19 vaccine with the probability of 0.3448. In contrast, without immigration requirements, people would naturally take the vaccine with the probability of 0.7775. The second variable which relates to why people have not taken the vaccine was that the unavailability of the vaccine was not significant. Therefore, it was not processed further.
The support vector regression (SVR) and tuned SVR were further used for the analysis, with 10-fold cross-validation. The MSE and RMSE of the support vector regression (SVR) and tuned SVR were lower than the logistic regression. The plots relating to the three models show that the model does not differ much from each other, just as was stated by Odekina et al. [14].
The responses obtained from the questionnaire show that people have diverse reasons why they would not like to take the COVID-19 vaccine aside from the reasons outlined in the questionnaire. The reasons against taking the vaccines were outlined in this study, and they are rational because lives are involved. The limitations encounter in this study is inability cover many countries in the survey. Future study should endeavor to strategically extend the coverage to Continents such as Asia, Antarctica, and Oceania.
This study therefore recommends the following
Table A1. Demographic characteristics of respondents
|
|
|
Frequency |
Percentage |
|
Work Classification |
Health worker Non-health worker Total |
67 206 273 |
24.5 75.5 100.0 |
|
Sex |
Male Female Total |
134 139 273 |
49.1 50.9 100.0 |
|
Religion |
Christianity Muslim Other Total |
246 25 2 273 |
90.1 9.2 0.7 100.0 |
|
Location |
Nigeria Outside Nigeria Total |
241 33 273 |
88.3 16.7 100.0 |
|
COVID-19 Vaccination Status |
Vaccinated Not Vaccinated Total |
155 118 273 |
56.8 43.2 100.0 |
|
Type of COVID-19 Vaccine taken |
AstraZeneca Moderna Pfizer Other Not Applicable Total |
84 33 23 13 120 273 |
30.8 12.1 8.4 4.8 44.0 100.0 |
Table A2. Knowledge of COVID-19
|
|
Strongly agree |
Agree |
Neutral |
Disagree |
Strongly disagree |
|||||
|
Count |
% |
Count |
% |
Count |
% |
Count |
% |
Count |
% |
|
|
Knowledge on symptoms of COVID-19. |
111 |
40.7 |
110 |
40.3 |
44 |
16.1 |
3 |
1.1 |
5 |
1.8 |
|
Knowledge on cure for COVID-19, |
113 |
41.4 |
111 |
40.7 |
33 |
12.1 |
13 |
4.8 |
3 |
1.8 |
|
Knowledge on ways of contracting COVID-19 virus. |
15 |
5.5 |
26 |
9.5 |
78 |
28.6 |
101 |
37.0 |
53 |
19.4 |
|
Knowledge on spread of COVID-19 |
126 |
46.2 |
112 |
41.0 |
28 |
10.3 |
7 |
2.6 |
- |
- |
|
Knowledge on prevention of COVID-19 virus. |
81 |
29.7 |
147 |
53.8 |
27 |
9.9 |
12 |
4.4 |
6 |
2.2 |
|
Knowledge on supposed action if COVID-19 symptoms are suspected. |
108 |
39.3 |
123 |
45.1 |
28 |
10.3 |
11 |
4.0 |
3 |
1.1 |
|
Knowledge on hygiene measures in reducing the risk of contracting COVID-19. |
68 |
24.9 |
77 |
28.2 |
13 |
4.8 |
10 |
3.7 |
105 |
38.5 |
|
Knowledge on social distancing practises |
46 |
16.8 |
100 |
36.6 |
20 |
7.3 |
8 |
2.9 |
99 |
36.3 |
|
Knowledge on consumption of certain nutrition and vitamins to prevent COVID-19 |
92 |
33.7 |
124 |
45.4 |
40 |
14.7 |
11 |
4.0 |
6 |
2.2 |
Table A3. Knowledge of COVID-19 Vaccination
|
|
Strongly Agree |
Agree |
Neutral |
Disagree |
Strongly Disagree |
||||||||||||
|
Count |
% |
Count |
% |
Count |
% |
Count |
% |
Count |
% |
||||||||
|
Vaccination helps to prevent from contracting infectious diseases |
69 |
25.3 |
98 |
35.9 |
55 |
20.1 |
40 |
14.7 |
11 |
4.0 |
|||||||
|
Vaccines have serious side effect |
22 |
8.1 |
58 |
21.2 |
109 |
39.9 |
78 |
28.6 |
6 |
2.2 |
|||||||
|
Government should enforce compulsory vaccination. |
14 |
5.1 |
59 |
21.6 |
75 |
27.5 |
78 |
28.6 |
47 |
17.2 |
|||||||
|
The COVID-19 vaccine is not readily available |
19 |
7.0 |
41 |
15.0 |
77 |
28.2 |
94 |
34.4 |
42 |
15.4 |
|||||||
|
|
Yes |
No |
May be |
Not Applicable |
|||||||||||||
|
|
Count |
% |
Count |
% |
Count |
% |
Count |
% |
|||||||||
|
vaccinated on one or two occasions |
187 |
68.5 |
74 |
27.1 |
12 |
4.4 |
- |
- |
|||||||||
|
I would take COVID-19 Vaccine only because of immigration requirements |
62 |
22.7 |
142 |
52.0 |
69 |
25.3 |
- |
- |
|||||||||
|
COVID-19 vaccination due to immigration requirements |
32 |
11.7 |
182 |
66.7 |
28 |
10.3 |
31 |
11.4 |
|||||||||
Table A4. Reasons why people would not like to take the vaccine
|
|
Frequency |
Percent |
|
Lack of correct information about the vaccine |
79 |
28.9 |
|
Religious Reasons |
3 |
1.1 |
|
Side effects |
45 |
16.5 |
|
underlying ailment |
7 |
2.6 |
|
Other |
40 |
14.7 |
|
Not aware |
99 |
36.3 |
|
Total |
273 |
100.0 |
Table A5. Nature of work * COVID-19 vaccination status
|
|
COVID-19 vaccination status |
Total |
||
|
Vaccinated |
Not vaccinated |
|||
|
|
Health Worker |
51 |
16 |
67 |
|
Non-Health Worker |
104 |
102 |
206 |
|
|
Total |
155 |
118 |
273 |
|
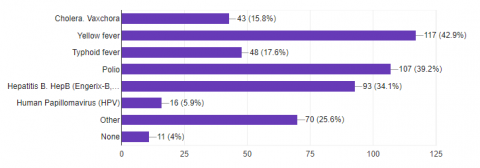
Figure B1. Response to question 26 on any other vaccine(s) taken apart from COVID-19 vaccine
[1] Kahn, J.S., McIntosh, K. (2005). History and recent advances in coronavirus discovery. The Pediatric Infectious Disease Journal, 11(24): S223-S227. https://doi.org/10.1097/01.inf.0000188166.17324.60
[2] Taiwo, A.I., Adedotun, A.F., Olatayo, T.O. (2022). Nigerian COVID-19 Incidence Modeling and Forecasting with Univariate Time Series Model. In: Hassan, S.A., Mohamed, A.W., Alnowibet, K.A. (eds) Decision Sciences for COVID-19. International Series in Operations Research & Management Science, vol 320. Springer, Cham. https://doi.org/10.1007/978-3-030-87019-5_8
[3] UNICEF. What we know about the Omicron variant, https://www.unicef.org/coronavirus/what-we-know-about-omicron variant?gclid=Cj0KCQiA8ICOBhDmARIsAEGI6o3klc2JbsfNnilr5Go8Iq-MAmoN7gVVZ5EoZV8yDuurq5qYSn01XfAaAl1rEALw_wcB, accessed on Dec. 12, 2021.
[4] Odekina G.O., Adedotun A. F., and Ogbu F. Imaga (2022). Modeling and forecasting the third wave of COVID-19 incidence rate in Nigeria using vector autoregressive model approach. Journal of the Nigerian Society of Physical Sciences, 4(1): 117-122. https://doi.org/10.46481/jnsps.2021.431
[5] Xu, F., Cressman, R. (2014). Disease control through voluntary vaccination decisions based on the smoothed best response. Computational and Mathematical Methods in Medicine, Hindawi Publishing Corporation, 1-14. http://dx.doi.org/10.1155/2014/825734
[6] Arino, J., Brauer, F., van den Driessche, P., Watmough, J., Wu, J. (2008). A model for influenza with vaccination and antiviral treatment. Journal of Theoretical Biology. 253(1): 118-130. http://dx.doi.org/10.1016/j.jtbi.2008.02.026
[7] Bauch, C.T., Szusz, E., Garrison, L.P. (2009). Scheduling of measles vaccination in low-income countries: Projections of a dynamic model. Vaccine, 27(31): 4090-4098. http://dx.doi.org/10.1016/j.vaccine.2009.04.079
[8] Wagner, B.G., Earn, D.J.D. (2010). Population dynamics of liveattenuated virus vaccines. Theoretical Population Biology, 77(2): 79-94. https://doi.org/10.1016/j.tpb.2009.08.003
[9] Rahman, S.M.A., Zou, X. (2011). Flu epidemics: A two-strain flu mode with a single vaccination. Journal of Biological Dynamics, 5(5): 376-390. https://doi.org/10.1080/17513758.2010.510213
[10] Ministry of Health, Ontario, COVID-19 Vaccine Information Sheet (age 12+). https://www.health.gov.on.ca/en/pro/programs/publichealth/coronavirus/docs/vaccine/COVID-19_vaccine_info_sheet.pdf, accessed on April 10, 2022.
[11] Angelo, A.T., Alemayehu, D.S., Dachew, A.M. (2021). Health care workers intention to accept COVID-19 vaccine and associated factors in southwestern Ethiopia. PLOS O, 16(9): e0257109. https://doi.org/10.1371/journal.pone.0257109
[12] Gagneux-Brunon, A., Detoc, M., Bruel, S., Tardy, B., Rozaire, O., Frappe, P., Botelho-Nevers, E. (2021). Intention to get vaccinations against COVID-19 in French healthcare workers during the first pandemic wave: A cross-sectional survey. Journal of Hospital Infection, 108: 168e173. pmid:33259883. http://dx.doi.org/10.1016/j.jhin.2020.11.020
[13] Guidry, J., Laestadius, I.L., Vraga, E.K., Miller, C.A., Perrin, P.B., Burton, C.W., Ryan, M., Fuemmeler, B.F., Carlyle, K.E. (2021). Willingness to get the COVID-19 vaccine with and without emergency use authorization. American Journal of Infection Control, 49(2): 137-142. http://dx.doi.org/10.1016/j.ajic.2020.11.018
[14] Odekina, G.O., Adedotun, A.F., Odusanya, O.A. (2021). Vector autoregressive modeling of COVID-19 incidence rate in Nigeria. International journal of Design and Nature and Ecodynamics, 16(6): 665-669. http://dx.doi.org/10.18280/ijdne.160607
[15] Manning, M.L., Gerolamo, A.M., Marino, M.A., Hanson-Zalot, M.E., Pogorzelska-Maziarz, M. (2021). COVID-19 vaccination readiness among nurse faculty and student nurses. Nurs Outlook, 69(4): 565-573. https://doi.org/10.1016/j.outlook.2021.01.019
[16] James, G., Witten, D., Hastie, T., Tibshirani, R. (2013). An introduction to statistical learning with applications in R. Statistical Theory and Related Fields, 6(1). https://doi.org/10.1080/24754269.2021.1980261
[17] Adesina, O.S. (2022). Vaccination Questionnaire. https://docs.google.com/forms/u/1/d/1ulK1RssWUUXXJ0SqT2SzVS1hK4Nncb9J7OcXcL68jU/edit?usp=forms_home&ths=true.
[18] R Core Team (2021). R: A language and environment for statistical computing. R Foundation for Statistical Computing, Vienna, Austria. https://www.R-project.org/.
[19] Meyer, D., Dimitriadou, E., Hornik, D., Weingessel, A., Leisch, F. (2020). Misc Functions of the Department of Statistics, Probability Theory Group (Formerly: E1071), TU Wien. R package version 1 (2020) 7-4 https://CRAN.R-project.org/package=e1071.
[20] Zambrano-Bigiarini, M. (2020). Hydrogof: Goodness-of-fit functions for comparison of simulated and observed hydrological time seriesR package version 0.4-0. https://doi.org/10.5281/zenodo.839854
[21] Canty, A., Riple, B. (2020). Boot: Bootstrap R (S-Plus) Functions R Package Version 1.3-25.