Mahmoud Mohamed Badawy* | Ebtehal Ahmed Abd Elmouety | Mostafa Monir Mahmoud
© 2022 IIETA. This article is published by IIETA and is licensed under the CC BY 4.0 license (http://creativecommons.org/licenses/by/4.0/).
OPEN ACCESS
In recent years, regional cohesion policies have received increasing attention worldwide. Therefore, international organizations, governments, and researchers have sought to assess the vulnerability in lagging regions. However, most studies have focused on exposure to a particular risk, with little work to examine overall interactions or adaptability from a multidimensional perspective. This study aims to fill the current research gap by developing a multidimensional composite index using the IPCC approach and a Delphi survey to define the criteria and specify the weights of the variables by the AHP method. The results showed that the municipality, which has an adaptive capacity through physical and economic capabilities, has overcome environmental, social, and demographic risks. On the other hand, some municipalities have been affected by their isolation, resulting in a high sensitivity to economic, social, and demographic challenges. A quantitative assessment of the various aspects of vulnerability and adaptability assists experts in mitigating the effects of vulnerability through management, planning, and decision-making; developing appropriate strategies; and serving as a manual for governments in managing vulnerability decrease to achieve sustainable development.
adaptive capacity, analytical hierarchy process (AHP), remoteness, sensitivity, sustainable development goals (SDGs)
The phenomenon of lagging regions is widespread in developed and developing countries. However, the definition used to classify areas as (lagging), (less developed), (backward), or weakly integrated is different according to the policy objectives and strategies of national governments [1]. There seems to be some conceptual ambiguity surrounding the term "lagging" Academic literature concentrating on less developed regions often refers to them as lagging regions, leading to the exchangeable use of the concepts [2]. For example, in the context of the European Union, lagging regions are classified into two specific types (low-income regions), which cover all areas with a GDP per head in PPS below 50% of the EU average. And (Low-growth regions) cover the less developed and transition regions (low productivity and high unemployment) [3]. Although the importance of economic outcomes is to describe what counts in the lived affairs of societies and is also used to categorize the regions, social dimensions (health, teaching, access to information, justice, and voice, among others) are important targets for development. Additionally, the growth potential of an area depends on a combination of location-specific factors and how densely populated it is. So-called peripherality (low proximity, as determined by access to the market, the relationships the area has with other regions through flows of people, labor, finance, goods, services, and resources) is a defining feature of lagging regions [4].
As a result of the global economic shocks in recent years, vulnerability and poverty are widespread in lagging regions where the limited resources and hazards of the COVID-19 pandemic's impact on health could push the economies into significant financial difficulties [5]. According to the United Nations, COVID-19 has led to 119-124 million people being pushed back into extreme poverty in 2020 [6]. Hazard, risk, exposure, adaptive capacity, sensitivity, adaption baseline, and coping range are varied terminologies used in vulnerability literature. As a result, various disciplines have diverse ideas about what vulnerability means [7]. In this paper, we accept the definition that vulnerability is the extent of exposure to one or more external pressures or natural disasters that harm the resilience of the system and its ability to withstand, cope with, or recover from these disturbances within an acceptable time frame [8]. The lagging regions share a collection of vulnerabilities that impede their capacity to perform the SDGs. Structural variables, including their size, isolation, low productivity land, rugged terrain, scarce resources, market size, exposure to poor climatic conditions, natural disasters, and the effects on socioeconomic results, such as complex issues in physical infrastructure, health, education, and labor market sectors [9]. In addition, they usually have low economic diversity and lower productivity, depending on higher shares of employment in agriculture or natural resources, which are the lowest wage sectors. These sectoral structures reflect the loss of competitiveness and profitability of (usually low-tech) manufacturing [10].
Over the past two decades, a large diversity of scholars and institutions have created vulnerability indices that address one or more different vulnerability aspects. Recently, there has been an increasing interest in the environmental dimensions to understand how they change and control the quality of life [11], as human life is closely related to the surrounding environment. The Social Vulnerability Index was proposed to measure human exposure to environmental hazards, and this method is applied to measure vulnerability to other disasters like floods and droughts [12]. There has also been some research on identifying Egypt's vulnerabilities and adaptation measures, including assessment of vulnerability risks and adaptation measures to climate change caused by sea-level rise along the Mediterranean coast [13] and predicting the vulnerabilities caused by sea level rise in Greater Alexandria [14]. Other research examines the effects of climate change, hazards, and adaptation measures in the Nile Delta [15], but a multidimensional vulnerability assessment is still lacking, particularly for lagging regions. In addition, vulnerability assessment is absent at local levels in Egypt (municipalities).
The fundamental difficulty in conducting spatial assessments of vulnerability in developing nations is the lack of socioeconomic data and the difficulty in linking them to sets of biophysical data, particularly at the local level [16]. This data's accessibility will allow evaluating vulnerability in the context of the many high-resolution global datasets linked to remote sensing-based temperature, topography, and other biophysical factors that are freely accessible [17]. Utilizing regionally representative areas and composite methodologies to evaluate human vulnerability to climate change is the way to get around the lack of social and economic data. This approach, which mainly relies on the Livelihoods Vulnerability Index (LVI), has been used in several places, including the Mabote and Moma districts of Mozambique [18], the index was also applied in a comparative study of wetland communities in Trinidad and Tobago [19]. A similar approach was used to assess the vulnerability of seven blocks in Bhagalpur district in Bihar, India [20], and to assess risks in the Sukoharjo Regency and Klaten Regency, Indonesia [21]. The Multidimensional Livelihood Vulnerability Index is used to analyze household-level vulnerability in different parts of the Hindu Kush Himalayas [22]; measuring the degree of vulnerability and resilience to natural hazards in rural communities of the Jamuna River in Bangladesh [23]; and an assessment of communities' vulnerability to drought in semi-arid regions of northern Cameroon [24]. The LVI approach, which integrates natural, social, physical, and human capital to design development programs at the community level, has been presented as a modified version of the sustainable livelihoods approach formerly employed by the United Nations [25]. Multiple indicators are used to assess disaster risks and climate variability, as well as sociodemographic and economic factors that affect family resilience and the vulnerability of livelihoods, health, social networks, food, and water to the effects of climate change [26].
Despite a proliferation of academic contributions about vulnerability indexes, as sustainable development goals have gained momentum, this concept of building composite indexes raises some issues [27]:
This study proposes a methodology to provide an evidence-based index, the Multidimensional Vulnerability Index (MVI), a new index consisting of various criteria that achieve the SDGs selected by an expert survey using the Delphi method. Even though the vulnerability dimensions are distinct, they are frequently combined to calculate the overall composite vulnerability of a region. The MVI was created in rural, arid, and mountainous areas to study the multidimensional vulnerability of environmental, demographic, social, and economic change. These regions are characterized by a lack of resources, drought, topographical difficulties, remoteness, and isolation. It stands for three aspects of vulnerability, including exposure to remoteness and natural hazards; sensitivity to social and demographic factors; and adaptability due to physical and economic potential.
The study highlights the development of appropriate vulnerability indices for the lagging regions to provide a more robust yet flexible tool that would have suitability for international comparison. That would allow for the inclusion of broader criteria and require a more holistic approach that reflects current vulnerabilities and diverse challenges. It provides an evaluation system that is free from the prejudices of the decision maker and makes it simpler to determine specific disaster management policies.
The study emphasizes that strategies for building resilience into development planning, particularly to environmental, economic, climatic, and socio-geospatial challenges across the lagging regions, are not homogenous, although there are cross-cutting issues such as poverty, access to services, and gender equity. Additionally, the MVI separates dimensions for structural resilience and structural vulnerability, allowing a ranking of a country’s ability to rebuild and realize economies of scale through a regional effort to mainstream vulnerability reduction. It also enables the fair and more just allocation of development finance.
The MVI focuses on numerous issues that impact population well-being, such as livelihoods, education, social protection, health, and water. Additionally, it produces the data required for efficient resource allocation and policy development. The analysis demonstrates how swiftly accelerating progress and moving the region nearer to achieving the Sustainable Development Goals (SDGs) in the coming decade can be accomplished by making immediate, crucial, targeted investments in the most vulnerable communities.
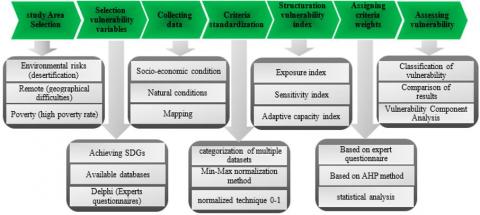
From the discussion of extensive literature, we assume that efficient vulnerability assessment requires an appropriate methodology or framework. In addition, to design a new vulnerability framework, it is necessary to reformulate the various components of structural vulnerability for lagging regions (economic, climatic, social, political, etc.) by specifying the criteria that vulnerability indicators have to meet for their expected use. Therefore, the framework was designed through a set of methodological steps to derive a multidimensional vulnerability index to assess the lagging regions, as shown in Figure 1.
Figure 1. Framework of a multidimensional vulnerability index
2.1 Study area
Egypt is the third most populous country in Africa and the most inhabited in the Middle East. It also has a population of 102 million in 2020. Despite being classified as a middle-income country, poverty rates increased from 16.7% in 2000 to 32.5% in 2018 [28], as shown in Figure 2.
Figure 2. Egypt poverty rate according national poverty muserment (1999/2000-2017/2018)
Accordingly, the New Valley Governorate was chosen as a study area because it has 52.6% of the population living below the poverty line and lags far behind the country in economic growth, job creation, high dependency, connectivity, and access to services. It is also the most vulnerable to isolation and remoteness (landlocked and relatively far from the country's main ports and markets) as it has difficulty accessing downtown Cairo at travel time, as shown in Figure 3.
Additionally, the New Valley Governorate has the lowest population density (2 people/km2) and the largest area in Egypt, comprising about 440,098 km2, equivalent to 44% of the total area of Egypt. New Valley's climate is very arid. The highest temperature in the summer is around 40℃ to 45℃, and the land, in general, is deserted except for the oases (El Kharga, El Dakhla, El Farafra, Paris, and Balat), where some agricultural activities are practiced depending on the underground water aquifer. Sand drifts are a common feature in the New Valley. The predominant north winds drive fine sand southward in Kharga, and it moves north of 30 degrees west in El Farafra at a rate of movement of 20 to 100 meters per year, drifting across roads, agricultural areas, and sometimes covering homes [29].
Figure 3. Study area (travel-time index to Central Cairo)
The government of Egypt has recognized the need for a differentiated strategy for lagging regions and an integrated approach. In this context, the Sustainable Development Strategy "SDS 2030" was launched in 2015 and is aligned with the global SDG agenda and focuses not only on rapid economic growth but also on improving social justice. Additionally, there was the Inclusive Economic Development Program for Lagging Regions (IEDLR), an alternative and integrated approach to address the fundamental development challenges. New Valley Governorate was selected in the first phase of this program due to high levels of poverty. The main objective of the local policy was to reduce the proportion of the population living below the poverty line by 3.23% annually on average until 2030 through the development of local economic development strategies to create job opportunities and improve income, thus building community resilience and adaptability.
2.2 Selecting criteria of vulnerability
The definition of vulnerability must relate to one or more specific hazards [30], so in this case, isolation (topography), climate change (drought), socio-demographic factors (low population density), and economic pressures (market size) are the driving forces for the vulnerability of lagging regions. In addition, the criteria were chosen through a comprehensive literature review and empirical studies of regional cohesion and sustainable urban development policies for each vulnerability dimension.
Accordingly, the Delphi survey was employed to select the components of a multidimensional vulnerability index (MVI). The Delphi technique is a research approach used to gain consensus through rounds of questionnaire surveys of relevant experts [31], where 20 experts from diverse backgrounds were surveyed to cover the dimensions of development in the lagging regions. Five experts in sustainable desert agriculture, five experts in urban economics, five experts in rural development, and five experts in environmental planning.
The experts who took part in the Delphi survey came to an understanding regarding the need to choose criteria that are compatible with the local environment and achieve sustainable development objectives while also taking into account the data resources needed to calculate the indicator. Based on the Delphi survey, the MVI index in the lagging regions consisted of six components (remoteness, environmental, social, demographic, physical, and economic) and 49 indicators, as shown in Table 1.
The study uses equal weighting for six dimensions, which means that each index has the same impact on the outcome. Separate indices were calculated for six dimensions for each municipality in the New Valley Governorate using Equations 1 to 6: the Remoteness Vulnerability Index (RVI) (consists of 9 indicators), the Environmental Vulnerability Index (EVI) (consists of 7 indicators), the Social Vulnerability Index (SVI) (consists of 9 indicators), the Demographic Vulnerability Index (DVI) (consists of 8 indicators), the Physical Vulnerability Index (PVI) (consists of 9 indicators), and the Economic Vulnerability Index (ECVI) (consists of 7 indicators).
(RVI)=∑9i=1RWi/n(n=9) (1)
(EVI)=∑7i=1Ei/n(n=7) (2)
(SVI)=∑9i=1SWi/n(n=9) (3)
(DVI)=∑8i=1DWi/n(n=8) (4)
(PVI)=∑9i=1PWi/n(n=9) (5)
(ECVI)=∑7i=1EWi/n(n=7) (6)
where, Wi represents the subcomponent index and n is the number of sub-component.
Table 1. Multidimensional vulnerability index sub components
|
SDGs |
The concept of indicators and linking them to achieving sustainable development goals 2030 |
Indicators |
|
Remoteness vulnerability |
||
|
11 10 8 |
Transportation infrastructure is essential to provide safe, sustainable, and affordable access to major business and financial centers. |
Distance to the Capital (Cairo) |
|
Time |
||
|
Cost |
||
|
11 3 4 |
We should support socio-economic links between urban and rural areas by facilitating access to advanced levels of health and educational services. |
Distance urban center 500,000 people |
|
Time |
||
|
Cost |
||
|
11 1 2 |
The quality of roads should be improved, especially in remote rural areas where access to essential services is hampered by geographical restrictions. |
Distance urban center 100,000 people |
|
Time (Hour) |
||
|
Cost (Pound) |
||
|
Environmental vulnerability |
||
|
15 1 |
Rehabilitation of degraded lands and soils affected by desertification and drought has a significant impact on poor communities. |
Desertification- sand dunes |
|
good land area (Topography) |
||
|
6 11 |
Improving water quality by reducing pollution and the sustainable withdrawal of aquifer water contributes to avoiding drought. |
water quality |
|
Annual amount of rain |
||
|
13 1 2 |
Rising temperatures and successive droughts threaten to reduce agricultural production, leading to high levels of poverty and hunger, especially in remote areas. |
intensity of hot months over 40c |
|
Average annual max. temperature |
||
|
Aridity index |
||
|
Social vulnerability |
||
|
4 5 8 |
Providing free and high-quality educational opportunities leads to efficient and relevant educational outcomes in the labor market, reducing unemployment and poverty rates. |
Illiteracy rate |
|
Illiteracy rate for women |
||
|
School dropout rate |
||
|
Unemployment rate |
||
|
3 |
Achieving universal health coverage and access to quality health care services is essential, especially for poor communities. |
Number of hospital beds |
|
number of doctors |
||
|
11 16 17 |
Civil society organizations help to guarantee that the general population has access to essential services and housing that is suitable, safe, and cheap. |
Homes need renovation |
|
Houses without a private bathroom |
||
|
NGOs / 1000 People |
||
|
Demographic vulnerability |
||
|
11 |
Strengthening the economic ties that connect rural and urban communities through participatory, integrated, and long-term Human settlement planning increases the capacity for inclusive and sustainable urbanization. |
population |
|
Population of the city center |
||
|
Rural Population Ratio |
||
|
1 |
It is necessary to identify demographic groups protected by social protection systems by gender and age, such as the elderly, people with disabilities, and infants. |
Population aged >60 years |
|
Ratio of children (under 5 years) |
||
|
Dependency ratio |
||
|
11 1 |
Housing that is adequate, safe, and cheap must be made available, with a focus on protecting the vulnerable and underprivileged. |
Average family size |
|
crowding rate |
||
|
Physical vulnerability |
||
|
12 15 |
Mountains, drylands, and terrestrial and inland freshwater ecosystems should be used sustainably and economically. |
Agricultural land flat |
|
Soil quality rate |
||
|
aquifer volume |
||
|
6 7 |
· Everyone has access to safe and affordable drinking water. · Easily accessible and reliable energy services. · Adequate sanitation and hygiene standards. |
connected to the water network |
|
connected to the electricity network |
||
|
connected to the sewage network |
||
|
12 |
Achieving sustainable management of tourism resources that enhance culture, local products, and job opportunities. |
Generated power capacity |
|
Number of tourist facilities |
||
|
Number of hotel rooms |
||
|
Economic vulnerability |
||
|
8 |
Improve resource efficiency in consumption and production to decouple economic growth from environmental degradation. |
Agricultural Economic Size |
|
Mining economic volume |
||
|
8 |
Support productive activities, and create decent job opportunities by encouraging small and medium-sized enterprises. |
Average commercial registrations |
|
9 |
Increase the number of researchers and the amount of money spent on R&D, both officially and privately, to foster equitable and sustainable industrialization, modernize the technological capabilities of the industrial sectors, and encourage innovation. |
Workers in non-agricultural |
|
people with secondary education |
||
|
people with technical education |
||
|
people with university education |
||
2.3 Data collection
Economic, social, and demographic data were collected by relying on the Central Agency for Public Mobilization and Statistics (CAPMAS), which is the official statistics body in Egypt that collects, processes, analyzes, and publishes all statistical data and censuses periodically every ten years. Additionally, the study used the data of the local administration of the New Valley Governorate to fill the data gaps that are not available in the official census.
As for the biophysical data (topography, climate, precipitation, temperatures, etc.), it was collected through the database of the meteorological station in ELKharga city and the Environmental Affairs Agency. Other data was gathered using the Agricultural Research Center's databases to obtain information on the quality of agricultural land, the size of the aquifer, and the speed and direction of sand dune movement.
2.4 Criteria standardization
After selecting and preparing the variables, the next step will be data standardization. This research uses a widely used approach to data standardization similar to the one used in calculating the HDI [32]. This step is necessary because we have worked with multiple data sets of different dimensions, and each component consists of several indicators. Each of those is measured with different numerical scales and units and belongs to various fields [33].
There are two different methods for data normalization, Eq. (7) was employed with positive variables, while Eq. (8) was employed with negative variables.
index Sw=Sw−SminSmax−Smin (7)
index Sw=1−Sw−SminSmax−Smin (8)
where, Sw is the average data of a particular variable for a ward, Smin and Smax are the minimum and maximum values, respectively.
The composite vulnerability index values have been classified according to Table 2.
Table 2. Degree of vulnerability according to Min-Max normalization method
|
< 0.2 |
0.2-0.4 |
0.4-0.6 |
0.6-0.8 |
> 0.8 |
|
Low vulnerability |
Medium vulnerability |
High Vulnerability |
Very high vulnerability |
Extreme vulnerability |
2.5 Structuration vulnerability index
There are many emerging best practices and methods for measuring vulnerability. According to the UK Department for International Development (DFID), the concept of vulnerability consists of three components exposure, sensitivity to risk, and adaptability [34].
Exposure measures the capacity of stress on a system. Environmental hazards (desertification and drought) and remoteness (geographically isolated) are the main risks in the study area, so they were chosen as exposure variables [35]. Sensitivity is the extent to which a system is affected by pressure or disruption [36]. It is an inherent effect of the human ecological system before a disturbance occurs and is influenced by environmental, demographic, and social conditions. Adaptive capacity is the ability of the region to deal with existing or expected stress, including the system's ability to create measures to prevent future deterioration or to expand the scope of requirements to which it is adapted [37]. It may also be due to several factors, including physical (resource availability and access to infrastructure) and economic (activities, education, human resources, and skills).
Remoteness (R) and Environmental (E) components were used to calculate the exposure index (EI), the resultant sum is divided by 16, sum of the weights different sub components.
Exposure Index (EI)=9∗Rw+7∗Ew16 (9)
Social (S), and Demographic (D) components were used to derive the sensitivity index (SI), The resultant sum is divided by 17, sum of the weights of the different sub components.
Sensitivity Index (SI)=9∗Sw+8∗Dw17 (10)
while Physical (P), and Economic (EC) were used to calculate adaptive capacity index (AI), The resultant sum is divided by 16, sum of the weights of the different sub components.
Adaptive capacity Index (AI)=9∗Pw+7∗ECw16 (11)
According to the IPCC definition of vulnerability, it is a function of the nature climate change to which the system is exposed, its sensitivity, and its ability to adapt [38], as shown in Figure 4, a vulnerability was composed of two positively impacted dimensions (exposure and sensitivity) and one negatively mitigating factor (adaptive capacity). The multidimensional vulnerability index (MVI) of lagging regions can be defined as follows Eq. (12) [39].
MVI = ((EI) + (SI)) - (AI) (12)
where, (EI) is Exposure index, (SI) is Sensitivity index, and (AI) is Adaptive capacity index.
2.6 Criteria weights (AHP method)
It is recognized that when constructing a multidimensional composite index, the vulnerability criteria have different levels of significance [40], especially when there is a diversity of variables. As in the case of our research, there are six dimensions and 49 variables of vulnerability. Therefore in this study, we used the multi-criteria AHP (analytical hierarchy process) method to elicit experts' preferences about criteria weights.
AHP is one of the most widely adopted methods for efficient multi-criteria structuring and decision-making (MCDM) because it has mathematical properties and allows the aggregate classification of qualitative and quantitative criteria into a hierarchical structure [41].
In AHP, a reciprocal pair matrix is constructed by comparing criteria and assigning a relative priority weight to their relationship according to a nine-point scale [42] (Table 3). This reduces the complexity of the problem as only two criteria are compared at a time. Once these comparisons are made, the weights of the criteria are obtained by the main eigenvector of the matrix [43].
In the second phase of the Delphi survey, we prepared an electronic questionnaire for experts to emphasize the six main dimensions and 49 variables selected from the first questionnaire. Then, each participant was requested to complete the questionnaire by giving weights to criteria from the comparison matrices using a nine-point scale (Table 3).
After collecting the questionnaire results, hierarchical conceptual models of criteria were created in the IDIRSI SELVA 17 software, automatically generating a list containing the pairwise comparisons required to display the weights in the spreadsheet with the consistency ratio (CR). The CR measures the probability that the matrix ratings were randomly generated. If the inconsistency was higher than 10%, the experts were asked to revise their judgments.
Table 3. Fundamental AHP judgment scale
|
Numerical rating |
1 |
3 |
5 |
7 |
9 |
|
Verbal judgement |
Equal |
Moderate |
Strong |
Very strong |
Extreme |
Source: Saaty [41].
Figure 4. Concept of Multidimensional vulnerability index of lagging regions
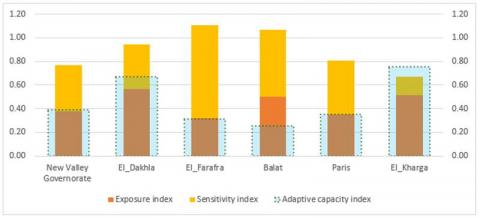
The indexes were calculated for each dimension based on the methodological steps outlined in the previous section. As a result of the collection and analysis of expert data on the importance of variables and method-based weights extraction (AHP), statistical analyses were performed to understand the level of vulnerability, as shown in Table 4 and Figure 5. The findings for each dimension (exposure, sensitivity, and adaptive capacity) are described separately, followed by a detailed explanation of the multidimensional vulnerability.
Table 4. Vulnerability Component Index values for different municipalities
|
Dakhla |
Farafra |
Balat |
Paris |
Kharga |
Weight (AHP) |
Data source |
Indicators |
|
789 |
550 |
753 |
700 |
597 |
0.08 |
ARB |
Distance to the Capital (Cairo) (KM) |
|
9.5 |
6.5 |
9 |
8.5 |
7.5 |
0.14 |
Time (Hour) |
|
|
160 |
125 |
160 |
140 |
125 |
0.23 |
LAU |
Cost (Pound) |
|
432 |
710 |
390 |
318 |
231 |
0.05 |
ARB |
Distance to urban center 500,000 people (KM) |
|
5.00 |
9 |
4.50 |
4 |
3 |
0.07 |
Time (Hour) |
|
|
80 |
145 |
78 |
57 |
42 |
0.15 |
LAU |
Cost (Pound) |
|
200 |
302 |
169 |
99 |
45 |
0.04 |
ARB |
Distance urban center 100,000 people (KM) |
|
2.5 |
5 |
2 |
1.5 |
1 |
0.07 |
Time (Hour) |
|
|
38 |
58 |
36 |
25 |
10 |
0.16 |
LAU |
Cost (Pound) |
|
0.68 |
0.55 |
0.61 |
0.34 |
0.06 |
Remoteness vulnerability CR=4.7% λ=9.55 |
||
|
20 |
20 |
18 |
25 |
30 |
0.22 |
EAA |
Desertification- sand dunes (meters/year) |
|
34 |
40 |
29 |
25 |
20 |
0.22 |
MOA |
Percentage of good land area (Topography) |
|
66 |
43 |
56 |
61 |
73 |
0.22 |
EAA |
water quality (Total suspended solids mg/L) |
|
1 |
2 |
1 |
0 |
1 |
0.06 |
EMA |
Annual amount of rain (mm/year) |
|
2 |
1.5 |
2 |
2.5 |
3 |
0.11 |
intensity of hot months over 40c (No.Months) |
|
|
36 |
35 |
36 |
37 |
37 |
0.11 |
Average annual max. temperature (C) |
|
|
0 |
0 |
0 |
0 |
0 |
0.06 |
Aridity index E.Demartonne |
|
|
0.45 |
0.09 |
0.39 |
0.73 |
0.97 |
Environmental vulnerability CR=0.0% λ=7.00 |
||
|
16 |
28 |
17 |
14 |
9 |
0.08 |
CAPMAS |
Illiteracy rate (%) |
|
21 |
35 |
22 |
19 |
12 |
0.17 |
Illiteracy rate for women (%) |
|
|
26 |
38 |
29 |
21 |
15 |
0.08 |
School dropout rate (%) |
|
|
3 |
1 |
3 |
6 |
8 |
0.08 |
Unemployment rate (%) |
|
|
1.7 |
1.7 |
1 |
0.9 |
2.3 |
0.08 |
Number of hospital beds / 1000 People |
|
|
0.88 |
0.41 |
0.7 |
0.7 |
1 |
0.17 |
number of doctors / 1000 People |
|
|
17 |
70 |
55 |
28 |
24 |
0.17 |
Homes need renovation (%) |
|
|
4 |
7 |
6 |
3 |
2 |
0.09 |
Houses without a private bathroom (%) |
|
|
2.6 |
1 |
3.3 |
0.5 |
1.4 |
0.08 |
NGOs / 1000 People |
|
|
0.28 |
0.86 |
0.54 |
0.45 |
0.16 |
Social vulnerability CR=0.4% λ=9.04 |
||
|
89621 |
35820 |
12233 |
13559 |
90014 |
0.06 |
CAPMAS |
population (Number) |
|
23216 |
6817 |
3457 |
5568 |
71936 |
0.12 |
Population of the city center (Number) |
|
|
74 |
81 |
72 |
59 |
20 |
0.23 |
Rural Population Ratio (%) |
|
|
7.9 |
11.3 |
10.2 |
7 |
7 |
0.23 |
Population aged >60 years (%) |
|
|
22.7 |
27.3 |
22.1 |
22.6 |
22.6 |
0.23 |
Ratio of children (under 5 years) (%) |
|
|
1 |
1 |
1 |
1 |
1 |
0.03 |
Dependency ratio |
|
|
4 |
4.8 |
3.8 |
4.1 |
4 |
0.06 |
Average family size (person / family) |
|
|
1.1 |
1.29 |
1.02 |
1.02 |
1.08 |
0.06 |
crowding rate (person / room) |
|
|
0.48 |
0.72 |
0.59 |
0.46 |
0.15 |
Demographic vulnerability CR=0.2% λ=9.02 |
||
|
114650 |
40940 |
9630 |
8630 |
2110 |
0.05 |
MOA |
Agricultural land flat (acres) |
|
3.95 |
2.26 |
1.02 |
3.02 |
1.64 |
0.10 |
Soil quality rate (Ton/acre) |
|
|
652 |
768 |
156 |
88 |
66 |
0.21 |
aquifer volume (million m3/year) |
|
|
100 |
100 |
100 |
100 |
100 |
0.05 |
CAPMAS |
Houses connected to the water network (%) |
|
100 |
100 |
100 |
100 |
100 |
0.09 |
Houses connected to the electricity network (%) |
|
|
48 |
33 |
37 |
44 |
85 |
0.05 |
Houses connected to the sewage network (%) |
|
|
36205 |
31505 |
4330 |
4859 |
41304 |
0.21 |
LAU |
Generated power capacity (MW/HR) |
|
17 |
7 |
0 |
2 |
17 |
0.11 |
Number of tourist facilities |
|
|
390 |
129 |
0 |
38 |
449 |
0.11 |
Number of hotel rooms |
|
|
0.79 |
0.52 |
0.15 |
0.25 |
0.66 |
Physical vulnerability CR=0.6% λ=9.07 |
||
|
32 |
62 |
10 |
11 |
22 |
0.06 |
MOA |
Agricultural Economic Size (1000 acres) |
|
215 |
469 |
440 |
327 |
1140 |
0.06 |
LAU |
Mining economic volume (million tons) |
|
3.4 |
1.1 |
2.2 |
1.9 |
3.1 |
0.13 |
CAPMAS |
Average commercial registrations (100 people |
|
55 |
35 |
50 |
60 |
75 |
0.25 |
Workers in non-agricultural activities (%) |
|
|
8 |
6 |
5.3 |
6.8 |
13.7 |
0.13 |
people with secondary education (%) |
|
|
26 |
20 |
26 |
30 |
26 |
0.13 |
people with technical education (%) |
|
|
14 |
5 |
12 |
11 |
19.6 |
0.25 |
people with university education (%) |
|
|
0.55 |
0.09 |
0.36 |
0.46 |
0.89 |
Economic vulnerability CR=0.0% λ=7.00 |
||
Data sources: ARB(2020) Authority for Roads & Bridges, Ministry of Transportation; LAU (2019) Local Administration Unit, New Valley Governorate; EAA(2018) Environmental Affairs Agency; MOA (2015) Ministry of Agriculture and Land Reclamation; EMA (2021) Egyptian Meteorological Authority; CAPMAS (2017) Central Agency for Public Mobilization and Statistics Egypt.
3.1 Exposure index
The results demonstrated that the three municipalities (EL-Kharga, EL-Dakhla, and Balat) had a high exposure level of 0.5-0.57. Where EL-Dakhla and Ballet are highly vulnerable to remote locations, EL-Kharga has extreme environmental vulnerability. The remaining municipalities of Paris and EL-Farafra have a medium exposure value of 0.36 to 0.32, respectively. Whereas EL-Farafra is highly vulnerable to the environment, Paris is moderately vulnerable to remoteness.
3.2 Sensitivity index
The results showed that EL-Farafra municipal has a very high sensitivity of 0.79 because it has an extreme vulnerability to social characteristics and very high demographic variables. While the municipalities of Balat and Paris have high sensitivity values of 0.57 and 0.46, respectively, which is related to their high socio-demographic vulnerability. On the other hand, the municipalities of EL-Dakhla and EL-Kharga have a medium sensitivity of 0.38 and a low of 0.16, respectively.
3.3 Adaptive capacity index
It was clear from the analysis of the indicators that the municipalities of EL-Kharga and EL-Dakhla have a very high adaptive capacity, with values of 0.78 and 0.67, respectively, due to their very high physical and economic capabilities. Other municipalities Paris, EL-Farafra and Balat, have medium adaptive capacity with values of 0.36, 0.31, and 0.26, respectively, and this is due to different reasons in each municipality; in EL-Farafra, despite the high physical capabilities, the economic indicators are low; and in Paris and Balat, the spatial potential is medium and the economic indicators are medium and high, respectively.
3.4 Assessing the multidimensional vulnerability index of New Valley Governorate
3.4.1 EL-Kharga municipality
It is clear from the results of the indexes in Table 5 and as shown in Figures 6, 7 that the municipality of EL-Kharga scored -0.11 in the multi-dimensional vulnerability index, which means that it does not have vulnerabilities, and this is related to several reasons. We should first know that the municipality of EL-Kharga is the capital of the New Valley Governorate, and therefore the low vulnerability was recorded in the remoteness, demographic, and social dimensions with values of 0.06, 0.15, and 0.16, respectively, although it was the highest vulnerability in the environment with a value of 0.97. On the other hand, the municipality of EL-Kharga has the highest economic aspects at 0.89, and the second-highest physical potential is 0.66, after EL- Dakhla with 0.79.
3.4.2 Paris municipality
The municipality of Paris is highly vulnerable, according to the MVI of 0.46. This is related to high sensitivity to the demographic and social dimensions, with values of 0.46 and 0.45, respectively, as well as a very heightened vulnerability to the environment of 0.73. On the other hand, it has high economic capabilities of 0.46 and medium spatial potential of 0.25.
3.4.3 Balat municipality
The MVI value of 0.81, which is the same as the municipality of EL-Farafra, translates to extreme vulnerability, according to the MVI evaluation table. By analyzing the indices of Balat municipality, we find that it is the most vulnerable with a spatial potential of 0.15 and the second least economic capacity of 0.36, after EL-Farafra municipality with 0.09. In addition, Balat has a high vulnerability in the remoteness, demography, and social dimensions, with values of 0.61, 0.59, and 0.54, respectively.
Figure 5. Values of components Vulnerability index in different municipalities
3.4.4 EL-Farafra municipality
As mentioned previously, EL-Farafra municipality is extremely vulnerable according to the MVI, with a value of 0.81, although it is the least vulnerable to the environment with a value of 0.09. On the other hand, EL-Farafra municipality is considered the most sensitive to social and demographic dimensions, with values of 0.86 and 0.72, respectively. And the lowest in economic capabilities, with a value of 0.09.
3.4.5 EL-Dakhla municipality
The municipality of EL-Dakhla has a medium vulnerability according to the MVI of 0.28. Although it records a very high remoteness vulnerability with a value of 0.68 and is highly vulnerable to the environmental and demographic dimensions with a value of 0.45 and 0.48, respectively, it has the highest spatial potential with a value of 0.79 and the second-highest economic capability of 0.55, after the municipality of EL-Kharga with a value of 0.89.
Table 5. Values of Multidimensional Vulnerability index (MVI)
|
Municipalities (Marakiz) |
Exposure index |
Sensitivity index |
Adaptive capacity index |
MVI |
|
El_Kharga |
0.52 |
0.16 |
0.78 |
-0.11 |
|
Paris |
0.36 |
0.46 |
0.36 |
0.46 |
|
Balat |
0.50 |
0.57 |
0.26 |
0.81 |
|
El_Farafra |
0.32 |
0.79 |
0.31 |
0.81 |
|
El_Dakhla |
0.57 |
0.38 |
0.67 |
0.28 |
|
New Valley Governorate |
0.38 |
0.39 |
0.39 |
0.37 |
Figure 6. Values of exposure, sensitivity, adaptive capacity in different municipalities
Figure 7. Values of Multidimensional Vulnerability index (MVI)
Our analysis shows that the multiple components of lagging regions' susceptibility are not mutually exclusive, as one factor may influence the vulnerability of other aspects in our study site (Figure 8). There is a common debate about how access to goods and services is related to poverty [44]. Based on variables affecting access to infrastructure and services, composite indicators of isolation were developed in Uganda, revealing that poverty levels are higher for those who reside in remote or isolated areas [45]. In this study, we also looked at the association between the socio-demographic status of the community and remoteness caused by topography, isolation, and difficulty accessing infrastructure. This becomes clear when considering the indicator measuring access to the nearest urban center, which in the municipality of EL-Farafra is an average of 5 hours. High rates of illiteracy (28%), particularly among women (35%), school dropouts (38%), a high percentage of rural residents (81%), people over 60 (11.3%), and children under five (27.3%), as well as higher average family sizes (4.8), overcrowding (1.9), lower sewer connection rates (33%) and deteriorating housing levels (70%), are all indicators of this. Practical studies demonstrate that poor human capital indicator scores may point to areas of focus that, if strengthened, might go a long way towards boosting adaptive capability and, consequently, resilience in eradicating poverty and offering more extensive societal benefits [46].
The adaptive ability used in our analysis is a function of physical and economic capacity, and although there is good physical potential (soil condition, availability of agricultural land, aquifer size, connection to water and energy networks, and the presence of some tourism potential, as in the case of EL-Farafra municipality), the economic potential is weak (low volume of agricultural and mining products and average commercial records) as well as weak human capabilities (low rate of workers in urban activities and low percentages of those with secondary, technical, or university education) as a result of being affected by the terrain, difficulty in accessing services and infrastructure, and isolation [47]. The recent findings of eleven empirical studies have confirmed the critical importance of education in reducing vulnerability to climate change disasters in many settings. Because more educated people are better able to perceive and appreciate the hazards, manage and react effectively, and cope and recover more rapidly, their findings demonstrate that "the protective effects of education" are present before, during, and after a disaster [48].
The results also indicate that adaptation efforts should focus on enhancing livelihood plans by addressing the problems related to the following: the difficulty of accessing health and education services due to the rugged terrain; decreased skilled labor due to immigration; reliance on agricultural activities without industrial and service activities; and low-capacity technology [49]. Two basic strategies can be used to achieve this. The first is the development of market and road infrastructure, which will enable people to obtain food at affordable prices and facilitate connectivity to various services [33]. The second strategy could include infrastructure and technical improvements in agricultural methods to increase land productivity and carry out rural manufacturing activities for agricultural products while taking advantage of the potential of oases and tourist destinations to promote and market local goods and culture [50].
The findings of earlier experiments demonstrate that improving road infrastructure could not only boost access to markets and financial services but also permit better planning. Increased accountability among governments, institutions, and organizations has the potential to be achieved through a better knowledge of the nature of poverty and targeting tactics [51]. The MVI data indicates a potent communication tool that, thanks to its objectivity, clarity, and simplicity, may be understood by various stakeholders. The MVI could improve accountability and transparency for a multi-agency strategy.
Figure 8. The different vulnerability components of the lagging regions and their interrelationships
This study argues that it is not possible to assess the vulnerability of the lagging regions through a single dimension but through a set of different factors (environmental, demographic, social, economic, physical, and remote) vulnerability. Accordingly, the study aims to enhance a multidimensional model for computing and assessing the vulnerability in lagging regions. The total number of criteria for the vulnerability index is 49 variables, distributed as follows: (16) exposure to remoteness and the environment, (17) sensitivity to social-demographic factors, and (16) adaptive capacity in physical and economic dimensions.
The results indicated that the municipalities of EL-Farafra and Balat are the most vulnerable, scoring (0.81) in the multi-dimensional vulnerability index (MVI). That's because of their high exposure to remoteness vulnerability (0.55, 0.61), respectively. EL-Farafra had the lowest environmental vulnerability (0.09) but the highest sensitivity index (0.79) with social and demographic vulnerabilities (0.86 and 0.72). In addition, despite the high spatial potential of EL-Farafra (0.52), it has the least economic capacity (0.09).
On the other hand, although EL-Kharga has the highest environmental vulnerability with a value of (0.97), it was scored (-0.11) in the MVI, which means that it has a high adaptive capacity (0.78) and resilience to the vulnerabilities. The municipality of EL-Kharga has the highest economic aspects at (0.89), and the second-highest physical potential is 0.66, after EL-Dakhla with (0.79). Additionally, EL-Kharga has the lowest vulnerability recorded in the remoteness, demographic, and social dimensions, with values of (0.06, 0.15, and 0.16), respectively. The municipalities of Paris and EL-Dakhla recorded an MVI of high vulnerability (0.46) and medium vulnerability (0.28), respectively.
Despite efforts to combine the study's findings, considerable barriers to data availability on poverty rates and environmental indicators at the municipal level have surfaced. As a result, adding more indicators may enhance the results' accuracy. Additionally, the indicators in the study were normalized using the Min-Max standardization approach. This tactic is focused on opposites (maximum and minimum). The results could be impacted by the extreme nature of these two figures [52]. However, this approach is appropriate and has been used extensively in studies to produce compound indices. The ideal index is the Human Development Index (HDI). In addition, composite indicators are an easy-to-use tool for educating decision-makers on complex issues [53].
The study results can support sustainable development experts in revealing the different dimensions of vulnerability and their ability to adapt in each municipality. Additionally, it can help in management, planning, and decision-making to reduce the risk of vulnerability in the study area. Accordingly, the development of these lagging municipalities and regions can be promoted by preparing appropriate strategies and approaches to development.
[1] Scott, A.J. (2009). World development report 2009: Reshaping economic geography. Journal of Economic Geography, 9(4): 583-586. https://doi.org/10.1093/jeg/lbp019
[2] Pilati, M., Hunter, A. (2020). Research for REGI Committee – EU Lagging Regions: State of play and future challenges. European Parliament, Policy Department for Structural and Cohesion Policies, Brussels. https://bit.ly/34pGFPV.
[3] Thomas, F., Goga, S., Ionescu-Heroiu, M. (2018). Rethinking lagging regions. World Bank, Washington, DC. © World Bank. https://openknowledge.worldbank.org/handle/10986/29823.
[4] Fingleton, B., Garretsen, H., Martin, R. (2015). Shocking aspects of monetary union: the vulnerability of regions in Euroland. Journal of Economic Geography, 15(5): 907-934. https://doi.org/10.1093/jeg/lbu055
[5] Barua, S. (2020). Understanding coronanomics: The economic implications of the coronavirus (COVID-19) pandemic. SSRN Electronic Journal. https://dx.doi.org/10.2139/ssrn.3566477
[6] Jeremiah, C., Petersen, E., Nantanda, R., Mungai, B.N., Migliori, G.B., Amanullah, F., Lungu, P., Ntoumi, F., Kumarasamy, N., Maeurer, M., Zumla, A. (2022). The WHO global tuberculosis 2021 report–not so good news and turning the tide back to End TB. International Journal of Infectious Diseases. https://doi.org/10.1016/j.ijid.2022.03.011
[7] Brooks, N. (2003). Vulnerability, risk and adaptation: A conceptual framework. Vulnerability and Adaptation to Climate Change.
[8] Aven, T. (2011). On some recent definitions and analysis frameworks for risk, vulnerability, and resilience. Risk Analysis: An International Journal, 31(4): 515-522. https://doi.org/10.1111/j.1539-6924.2010.01528.x
[9] Camagni, R.P. (1992). Development scenarios and policy guidelines for the lagging regions in the 1990s. Regional Studies, 26(4): 361-374. https://doi.org/10.1080/00343409212331347051
[10] Assa, J., Meddeb, R. (2021). Towards a multidimensional vulnerability index. February, PNUD. https://www.undp.org/publications/towards-multidimensional-vulnerability-index.
[11] Ward Thompson, C., Aspinall, P.A. (2011). Natural environments and their impact on activity, health, and quality of life. Applied Psychology: Health and Well‐Being, 3(3): 230-260. https://doi.org/10.1111/j.1758-0854.2011.01053.x
[12] Flanagan, B.E., Gregory, E.W., Hallisey, E.J., Heitgerd, J.L., Lewis, B. (2011). A social vulnerability index for disaster management. Journal of Homeland Security and Emergency Management, 8(1). https://doi.org/10.2202/1547-7355.1792
[13] Frihy, O.E., El-Sayed, M.K. (2013). Vulnerability risk assessment and adaptation to climate change induced sea level rise along the Mediterranean coast of Egypt. Mitigation and Adaptation Strategies for Global Change, 18(8): 1215-1237. https://doi.org/10.1007/s11027-012-9418-y
[14] Baumert, N., Kloos, J. (2017). Anticipating emerging risks and vulnerabilities from sea level rise induced preventive resettlement in greater Alexandria, Egypt. In Environmental Change and Human Security in Africa and the Middle East, Springer, Cham., pp. 133-157. https://doi.org/10.1007/978-3-319-45648-5_8
[15] Abutaleb, K.A.A., Mohammed, A.H.E.S., Ahmed, M.H.M. (2018). Climate change impacts, vulnerabilities and adaption measures for Egypt’s Nile Delta. Earth Systems and Environment, 2(2): 183-192. https://doi.org/10.1007/s41748-018-0047-9
[16] de Sherbinin, A. (2014). Spatial Climate Change Vulnerability Assessments: A Review of Data, Methods, and Issues. Center for International Earth Science Information Network.
[17] Malik, O.A., Hsu, A., Johnson, L.A., de Sherbinin, A. (2015). A global indicator of wastewater treatment to inform the Sustainable Development Goals (SDGs). Environmental Science & Policy, 48: 172-185. https://doi.org/10.4236/oalib.1107458
[18] Hahn, M.B., Riederer, A.M., Foster, S.O. (2009). The livelihood vulnerability index: A pragmatic approach to assessing risks from climate variability and change—A case study in Mozambique. Global environmental change, 19(1): 74-88. https://doi.org/10.1016/j.gloenvcha.2008.11.002
[19] Shah, K.U., Dulal, H.B., Johnson, C., Baptiste, A. (2013). Understanding livelihood vulnerability to climate change: Applying the livelihood vulnerability index in Trinidad and Tobago. Geoforum, 47: 125-137. https://doi.org/10.1016/j.geoforum.2013.04.004
[20] Tewari, H.R., Bhowmick, P.K. (2014). Livelihood vulnerability index analysis: An approach to study vulnerability in the context of Bihar. Journal of Disaster Risk Studies, 6(1): a127. https://doi.org/10.4102/jamba.v6i1.127
[21] Suryanto, S., Rahman, A. (2019). Application of livelihood vulnerability index to assess risks for farmers in the Sukoharjo Regency and Klaten Regency, Indonesia. Jàmbá: Journal of Disaster Risk Studies, 11(1): 1-9. https://doi.org/10.4102/jamba.v11i1.739
[22] Gerlitz, J.Y., Macchi, M., Brooks, N., Pandey, R., Banerjee, S., Jha, S.K. (2017). The multidimensional livelihood vulnerability index–an instrument to measure livelihood vulnerability to change in the Hindu Kush Himalayas. Climate and Development, 9(2): 124-140. https://doi.org/10.1080/17565529.2016.1145099
[23] Azam, G., Huda, M.E., Bhuiyan, M.A.H., Mohinuzzaman, M., Bodrud-Doza, M., Islam, S.M. (2021). Climate change and natural hazards vulnerability of Char Land (Bar Land) communities of Bangladesh: application of the livelihood vulnerability index (LVI). Global Social Welfare, 8(1): 93-105. https://doi.org/10.1007/s40609-019-00148-1
[24] Ntali, Y.M., Lyimo, J.G. (2022). Community livelihood vulnerability to drought in semi-arid areas of northern Cameroon. Discover Sustainability, 3(1): 1-14. https://doi.org/10.1007/s43621-022-00089-4
[25] Chambers, R., Conway, C. (1992). Sustainable rural livelihoods: Practical concepts for the 21st century. IDS Discussion Paper 296, Brighton: IDS.
[26] Adu, D.T., Kuwornu, J.K., Anim-Somuah, H., Sasaki, N. (2018). Application of livelihood vulnerability index in assessing smallholder maize farming households' vulnerability to climate change in Brong-Ahafo region of Ghana. Kasetsart Journal of Social Sciences, 39(1): 22-32. https://doi.org/10.1016/j.kjss.2017.06.009
[27] Angeon, V., Bates, S. (2015). Reviewing composite vulnerability and resilience indexes: A sustainable approach and application. World Development, 72: 140-162. https://doi.org/10.1016/j.worlddev.2015.02.011
[28] CAPMAS. (2019). National report for monitoring sustainable development goals in Egypt 2030. Cairo. https://www.capmas.gov.eg/pdf/SDG.pdf?fbclid=IwAR1equ2XA5w0OHxb-zn-6i0gRgfV8zbvpXm-vkGqcibte40YHWlgE3Zyx_U, accessed on Nov. 3, 2020.
[29] El-Shirbeny, M.A., Ali, A.M., Khdery, G.A., Saleh, N.H., Afify, N.M., Badr, M.A., Bauomy, E.M. (2021). Monitoring agricultural water in the desert environment of New Valley Governorate for sustainable agricultural development: A case study of Kharga. Euro-Mediterranean Journal for Environmental Integration, 6(2): 1-15. https://doi.org/10.1007/s41748-022-00320-2
[30] Blaikie, P., Cannon, T., Davis, I., Wisner, B. (1994). At Risk: Natural Hazards, Peoples, Vulnerability and Disasters. London: Routledge. https://doi.org/10.4324/9780203714775
[31] Mahajan, V. (1976). Review of the Delphi method: Techniques and applications. Journal of Marketing Research, 13(3): 317-318. https://doi.org/10.2307/3150755
[32] Anand, S., Sen, A.K. (1994). Human development index: Methodology and measurement. occasional papers. New York: Human Development Report Office, United Nations. http://hdr.undp.org/en/media/HDI_methodology.pdf.
[33] Mainali, J., Pricope, N.G. (2019). Mapping the need for adaptation: Assessing drought vulnerability using the livelihood vulnerability index approach in a mid-hill region of Nepal. Climate and Development, 11(7): 607-622. https://doi.org/10.1080/17565529.2018.1521329
[34] Scott, N., Garforth, C., Jain, R., Mascarenhas, O., McKemey, K. (2005). The economic impact of telecommunications on rural livelihoods and poverty reduction: A study of rural communities in India (Gujarat), Mozambique and Tanzania. Commonwealth Telecommunications Organization for UK Department for International Development.
[35] Liu, X., Wang, Y., Peng, J., Braimoh, A.K., Yin, H. (2013). Assessing vulnerability to drought based on exposure, sensitivity and adaptive capacity: A case study in middle Inner Mongolia of China. Chinese Geographical Science, 23(1): 13-25. https://doi.org/10.1007/s11769-012-0583-4
[36] Gallopín, G.C. (2006). Linkages between vulnerability, resilience, and adaptive capacity. Global Environmental Change, 16(3): 293-303. https://doi.org/10.1016/j.gloenvcha.2006.02.004
[37] Smit, B., Wandel, J. (2006). Adaptation, adaptive capacity and vulnerability. Global Environmental Change, 16(3): 282-292. https://doi.org/10.1016/j.gloenvcha.2006.03.008
[38] IPCC. (2001). Climate change 2001: Impacts, adaptation, and vulnerability. Cambridge: Cambridge University Press. https://doi.org/10.1002/joc.775
[39] Hahn, M.B., Riederer, A.M., Foster, S.O. (2009). The livelihood vulnerability index: Pragmatic approach to assessing risks from climate variability and change—A case study in Mozambique. Global Environmental Change, 19(1): 74-88. https://doi.org/10.1016/j.gloenvcha.2008.11.002
[40] Fekete, A. (2012). Spatial disaster vulnerability and risk assessments: challenges in their quality and acceptance. Nat. Hazards., 61: 1161-1178. https://doi.org/10.1007/s11069-011-9973-7
[41] Saaty, T.L. (2006). The Analytic Network Process. In: Decision Making with the Analytic Network Process. International Series in Operations Research & Management Science, vol 95. Springer, Boston, MA. https://doi.org/10.1007/0-387-33987-6_1
[42] De Brito, M.M., Evers, M., Almoradie, A.D.S. (2018). Participatory flood vulnerability assessment: a multi-criteria approach. Hydrology and Earth System Sciences, 22(1): 373-390. https://doi.org/10.5194/hess-22-373-2018
[43] Saaty, T.L. (1980). The Analytic Hierarchy Process. McGraw-Hill, NewYork.
[44] Alkire, S., Santos, M.E. (2013). A multidimensional approach: Poverty measurement & beyond. Social Indicators Research, 112(2): 239-257. https://doi.org/10.1007/s11205-013-0257-3
[45] Bird, K. (2010). Isolation and poverty: the relationship between spatially differentiated access to goods and services and poverty. https://odi.org/en/publications/isolation-and-poverty-the-relationship-between-spatially-differentiated-access-to-goods-and-services-and-poverty/.
[46] McTavish, S., Moore, S., Harper, S., Lynch, J. (2010). National female literacy, individual socio-economic status, and maternal health care use in Sub-Saharan Africa. Social Science & Medicine, 71(11): 1958-1963. https://doi.org/10.1016/j.socscimed.2010.09.007
[47] Agarwal, G., Lee, J., McLeod, B., Mahmuda, S., Howard, M., Cockrell, K., Angeles, R. (2019). Social factors in frequent callers: a description of isolation, poverty and quality of life in those calling emergency medical services frequently. BMC Public Health, 19(1): 1-8. https://doi.org/10.1186/s12889-019-6964-1
[48] Lutz, W., Muttarak, R., Striessnig, E. (2014). Universal education is key to enhanced climate adaptation. Science, 346: 1061-1062. http://dx.doi.org/10.1126/science.1257975
[49] Rahman, H.M., Hickey, G.M. (2020). An analytical framework for assessing context-specific rural livelihood vulnerability. Sustainability, 12(14): 5654. https://doi.org/10.3390/su12145654
[50] Gentle, P., Maraseni, T.N. (2012). Climate change, poverty and livelihoods: Adaptation practices by rural mountain communities in Nepal. Environmental Science & Policy, 21: 24-34. https://doi.org/10.1016/j.envsci.2012.03.007
[51] Donohue, C., Biggs, E. (2015). Monitoring socio-environmental change for sustainable development: Developing a Multidimensional Livelihoods Index (MLI). Applied Geography, 62: 391-403. https://doi.org/10.1016/j.apgeog.2015.05.006
[52] Talukder, B., Hipel, K.W., VanLoon, G.W. (2017). Developing composite indicators for agricultural sustainability assessment: Effect of normalization and aggregation techniques. Resources, 6(4): 66. https://doi.org/10.3390/resources6040066
[53] Salem, M., Tsurusaki, N., Divigalpitiya, P., Osman, T., Hamdy, O., Kenawy, E. (2020). Assessing progress towards sustainable development in the urban periphery: A case of greater Cairo, Egypt. International Journal of Sustainable Development and Planning, 15(7): 971-982. https://doi.org/10.18280/ijsdp.150701