Ni Putu Wiwin Setyari* | I Wayan Sukadana | Ida Ayu Nyoman SaskaraSuasih | Ni Nyoman Reni
© 2022 IIETA. This article is published by IIETA and is licensed under the CC BY 4.0 license (http://creativecommons.org/licenses/by/4.0/).
OPEN ACCESS
Access to clean water is still a problem in many developing countries, including Indonesia. This study aims to reveal the impact of access and the demand for clean water on children’s performance. The data used in this research is IFLS data, from the first wave (1993) until the fifth wave (2014). This research used micro econometrics of impact evaluation to explain the impact of water access on the children’s performance, and the impact of pollution and deforestation on the water demand. It’s found that significant evidence that a family with piped water access has better children’s performance. Besides that, the demand for pipe water is higher in the area that has more pollution and deforestation. Therefore, Government policies are directed at reducing deforestation in order to increase the availability of clean water.
children performance, clean water access, Indonesian family life survey (IFLS)
The world’s population is growing by about 80 million people a year. This growth requires at least three major commodities that must be fulfilled in life: water, food and energy [1]. Especially for water, to meet the growing population required about 64 billion cubic metres per year. An estimated 90% of the 3 billion people who are expected to be added to the population by 2050 will be in developing countries, mainly in regions that are already experiencing water stress and in areas with limited access to safe drinking water and adequate sanitation facilities. Sanitation and poor hygiene practice and unsafe drinking water contributes to 88% of child deaths due to diarrhea worldwide. For children who survive often suffer from diarrhea contribute to nutritional problems, preventing children to be able to achieve their maximum potential in the future [2].
The need for clean water is a source of life that is excessively necessary for every aspect of human life, despite age. Poor management of water resources will cause disasters for the world, both for health and the surrounding environment. Excess water will cause flooding, inundation, and landslides. However, lack of water will cause a drought disaster. According to Food and Agricultural Organization (FAO) projections, by 2030, our earth will be inhabited by 8.3 billion people and the need for water will increase by 14% [3].
Indonesia is a developing country with a population about 250 million. Meeting the needs of clean water is one of the activities that need government intervention [4]. Water pollution, global climate change and deforestation in rain forest area puts more burden of government in seeking solutions to meet the needs for clean water. Indonesian Institute of Sciences (LIPI) in 2012 noted, Indonesia was ranked the worst in the service availability for clean water in Southeast Asia. Until 2015, the realization of access to drinking water in the community reached 70.97% and achievement of sanitation access reached 62.14% of the target of 100% by 2019 [5].
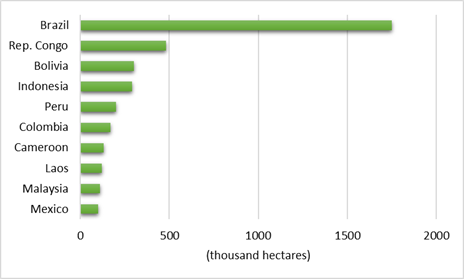
Based on Statistics Indonesia (BPS) data, 80% of the Indonesians at the beginning of the 21st century have not yet accessed clean water. Exploitation of forests and expansion of settlements is the cause of the loss of major water sources such as lakes and springs [6]. According to the FAO, the rate of forest destruction in Indonesia reaches 1,315,000 hectares per year or every year the forest area decreases by one % (1%). Various environmental NGOs reveal that forest damage reaches 1,600,000-2,000,000 hectares per year and even higher data revealed by Greenpeace, that forest damage in Indonesia reaches 3,800,000 hectares per year, most of which is illegal logging or illegal logging. Data from the Ministry of Environment and Forestry (KLHK) of the Republic of Indonesia shows that Indonesia's deforestation area in the 2018-2019 period reached 462.5 thousand hectares. This figure has increased compared to the 2017-2018 periods which were 439.4 thousand hectares; while in 2016-2017, the figure reached 480 thousand hectares. Then, in the 2015-2016 period, it reached the highest deforestation rate in the last six years, amounting to 629.2 thousand hectares. In total, within six years, the deforestation rate reached 2.1 million hectares. Indonesia's deforestation rate was still included in the list of the 10 largest in the world last year. Indonesia occupies the fourth position, flanked by Bolivia and Peru (Figure 1) [7].
A quarter (25.1%) of 64 thousand villages (called kelurahan) which is the river passes through have poor water quality. The highest level of pollution is on the island of Java. In West Java, 980 villages or 13.3% of the total 7,367 villages in Indonesia that rivers pass through have water quality that is heavily polluted due to industrial activities [8].
The rivers in Central Java that flow through 1,334 villages or 13.6% of the rivers have the status of heavily polluted water caused by the presence of household waste. Both in urban and rural areas, the availability of clean water for various purposes are important. Socio-economic conditions and public health will be better if they consume clean water managed hygienically by the Municipal Waterworks (PDAM). In big cities, the majority of population has used clean water from PDAM. Meanwhile, in rural areas, the majority of the population still uses rivers and wells as a source of clean water, while river water and well water are not guaranteed to be clean [8].
The quality of the environment and community behavior will determine the health status of rural and urban communities. Water use in big cities tends to be higher when compared to rural areas because per capita water use in community groups tends to be higher in big cities. This greater use is caused by the better quality of the economy of the urban population [9].
Problems regarding the availability of clean water are not only experienced by urban communities, in rural areas as well. The use of PDAM water and bottled water in rural areas is relatively more expensive than well water and river water. This is the reason why the villagers tend to prefer to use river water and well water for bathing, washing, and latrines because the prices are more affordable. In fact, the availability of clean water is one of the predictors that determine a person's level of health. A person's health will then affect the quality of life and productivity which in turn will have an impact on the welfare of his life [10].
Problems of access to clean water in rural areas is the uneven access so that it becomes a challenge for the government in meeting the target of 17 sustainable development goals (SDGs) in 2030. Whereas, for the problems faced by urban areas is the quality of water and the cost of households to access clean water. Compared to the rich, the urban poor spend more of their income for worse quality. Expansion of services cannot compensate the population growth in urban areas. Other residents depend on a variety of other sources, including shallow wells, water from street vendors and private networks that are connected to the deep well. In terms of quality, this water source is very doubtful in the presence of water and soil pollution in urban areas. The problem becomes more complex because the costs from alternative access sources are larger per unit volume than piped water supply [11].
Human development is the goal of economic development. Human development should start from the early age. One way to support the realization of human development process from an early age is to prevent children from dangerous diseases. Indeed, each year more than 3 million children die from preventable water related diseases [12] and a number of studies have found that access to safe water is associated with better child health (e.g., [13-17]). One way to avoid this is to provide a good clean water access for households [18]. Therefore, this study aimed to evaluate the impact of household water access to the performance of children.
The purpose of this study, in general, is to provide answers that access to clean water is essential for human development. Specifically, this research aims: (1) to reveal that access to clean water from PDAM is able to improve the performance of students in elementary school, junior high school, and senior high school; and (2) to reveal that access to clean water from PDAM is able to improve the performance of children in terms of rural and urban areas.
This study uses data from the Indonesian Family Life Survey (IFLS), and then analyzed by micro econometrics and impact evaluation. The results of this study are expected to be used as a reference in formulating policies and efforts related to access to clean water and children's performance.
Source: Global Forest Watch (2020)
Figure 1. 10 Countries with the most primary forest land loss, year 2020
Markets do various activities, but they do not do everything well. The ten principles of economics government action can sometimes improve upon market outcomes. The researchers examine why markets sometimes fail to allocate resources efficiently, how government policies can potentially improve the market’s allocation, and what kinds of policies are likely to work best [19].
The market failures examined in this part fall under a general category called externalities. An externality arises when a person engages in an activity that influences the wellbeing of a bystander but neither pays nor receives compensation for that effect. If the impact on the bystander is adverse, it is called a negative externality. If it is beneficial, it is called a positive externality. In the presence of externalities, society’s interest in a market outcome extends beyond the wellbeing of buyers and sellers who participate in the market to include the wellbeing of bystanders who are affected indirectly. Because buyers and sellers neglect the external effects of their actions when deciding how much to demand or supply, the market equilibrium is not efficient when there are externalities. Thus, the equilibrium fails to maximize the total benefit to society as a whole [20].
The release of household waste into the river, for instance, is a negative externality. Geere et al. [21] for example, emphasize the large contribution that oil palm plantations and the pulp and paper industry have been making to Indonesia's economic growth in recent years, notwithstanding the environmental consequences of such activities. The most vivid environmental impact is deforestation. As it is known that the deforestation is bound to decrease water quantity and water quality that can be used by the public.
At the 2000 Millennium Summit, member countries of the United Nations unanimously agreed on a set of eight goals to reduce poverty by 2015, among which are reducing child mortality by two-thirds and cutting in half the number of households that do not have access to safe water. These two goals are interrelated in that clean water is critical to containing the spread of infectious and parasitic diseases.
The behavior model of children used in this research is following [22]. They examine the impact on child health of an exogenous increase in access to pipe water, allowing for parental responses in the provision of other inputs to child health. The increase in access could arise from an extension of the piped water network into a community that had relied previously on a well or stream. They show that once one allows for privately provided health inputs, and assuming that parents care about more than just their children's health, even the direction of the effect on children's health is theoretically ambiguous, and becomes an empirical question.
The basic model of the studies of ref. [22] will be further developed in this study, we include the consideration that the tap water will also be able to save a child’s time in accessing the water, so that there is sufficient time for them to study. The effect of better in health and spare time to study, will then have implications for better performance in school. If their performance is better in school, then their performance when entering the labor market certainly also well.
Water is an example of a common resources, like public goods, they are not excludable: They are available free of charge to anyone who wants to use them. Common resources are, however, rival in consumption: One person’s use of the common resource reduces other people’s ability to use it. Thus, common resources give rise to a new problem. Once the good is provided, policymakers need to be concerned about how much it is used. This problem is best understood from the classic parable called the Tragedy of the Commons [23].
As many economists discuss, markets do not adequately protect the environment. Pollution is a negative externality that can be remedied with regulations or with corrective taxes on polluting activities. One can view this market failure as an example of a common-resource problem. Clean water is common resources like open grazing land, and excessive pollution is like excessive grazing. Environmental degradation is a modern Tragedy of the Commons. Therefore, in order to prevent the Tragedy of the Commons, the government should make policies that provide incentives to citizens to protect the environment especially water [24].
One form of the public policy can take by Government of Indonesia is the pricing policy. Block rate pricing of piped water in Indonesian cities has a progressive structure: the marginal price paid increases with the volume of demand. Setiawan et al. [25] estimates household water demand in Salatiga City using the Burtless and Hausman model, and finds that its distribution is not unimodal—that data cluster around kinks. The main estimation results are a price elasticity of approximately–1.2 and an income elasticity of 0.05. These elasticities are mutually dependent. The estimated model is used to investigate the social welfare consequences of a shift to uniform pricing. The principal beneficiaries would be large households, which are not necessarily wealthy. While replacing the complex rate structure by a uniform marginal price would have positive effects on average welfare, the equity consequences would be small. To improve equity, water companies could reduce installation fees, giving low-income households access to water connections, or reinvest profits in network expansion to un-serviced areas.
The data used for impact evaluation is micro data from the Indonesian Family Life Survey (IFLS). IFLS is an on-going longitudinal survey in Indonesia. The sample is representative of about 83% of the Indonesian population and contains over 30,000 individuals living in 13 of the 27 provinces (on base year in 1993/1994) in the country. The first wave of the IFLS (IFLS1) was conducted in 1993/94 by RAND in collaboration with Lembaga Demografi (Demographic Institute), University of Indonesia. IFLS2 and IFLS2+ were conducted in 1997 and 1998, respectively, by RAND in collaboration with UCLA and Lembaga Demografi, University of Indonesia. IFLS2+ covered a 25% sub-sample of the IFLS households. IFLS3, which was fielded in 2000 and covered the full sample, was conducted by RAND in collaboration with the Center for Population and Policy Studies, Universitas Gadjah Mada (CPPS-UGM). The fourth wave of the IFLS (IFLS4), fielded in 2007/2008 covering the full sample, was conducted by RAND, CPPM-UGM, and SurveyMETER (a non-government research institution). The fifth wave of the IFLS (IFLS-5) was fielded 2014-2015.
IFLS data used in this study are from the first wave in 1993 until the fifth wave in 2014. Based on these data, then we compiled two types of data sets, namely cross section data and panel data. The data used for the analysis of the impact of water access on children performance is a cross section data in individual level. While, for the analysis of the impact of water access on the labor market performance, we will use panel data set in individual level, which connects the water access, children acute morbidity and children performance at IFLS1, IFLS2, IFLS3 with the labor market performance in IFLS4 and IFLS5. Furthermore, for the analysis of the impact of deforestation and pollution on HH expenditure will be used panel data in HH level, by combining data from section KA, PL and PR with data from section KS.
This study has differences compared to previous studies, especially in data sources. As previously explained, this research uses IFLS data which is the most comprehensive survey ever conducted in Indonesia. In addition, the data period is relatively long, from IFLS wave 1 (year 1993) to IFLS wave 5 (year 2014-2015). Moreover, the effect of access to clean water on children's performance is not instantaneous, so there needs to be a long data lag time.
There are four econometric strategies used in this study, Propensity Score Matching (PSM), Instrumental Variable (IV), Regression Discontinuity (RD) and Double Difference (DD). Econometrics strategy used in this study has referred to some of the literature on the impact evaluation literature like [26-28].
4.1 Expanding access for clean water in Indonesia
The World Bank site noted that Indonesia has been enjoyed substantial achievements in poverty reduction, human development and improvements in service delivery. However, enormous challenges remain. One of the important challenges came from access to safe water and sanitation, due to the severe consequences of poor sanitation infrastructure on public health, the economy, and the environment. Two of the four most important causes of under-five mortality in Indonesia—diarrhea and typhus—are fecal-transmitted diseases that are directly linked to problems with inadequate water supply, sanitation and hygiene. Difficult access to improved water supply also means that poor households, particularly women and children, spend too much time fetching water [29].
The 1998 financial crisis led too little to no investments in water infrastructure, and the government has struggled to maintain upkeep of existing facilities. The National Rural Water Supply and Sanitation Project (called PAMSIMAS) strives to improve existing facilities and expand sanitation access, through a community-based approach. PAMSIMAS seeks to increase the use of water and sanitation facilities, and improve hygiene behaviors, by expanding and mainstreaming the community-driven approach. The project provides grants directly to communities for local water and sanitation infrastructure and technical assistance to enhance the role of the community with capacity building planning, procurement and management, including community monitoring with a web-based complaint handling mechanism. Advisory services and training are also provided for communities to improve their sanitation and hygiene behavior and practices [30].
As of March 4, 2013, the number of additional people with sustainable access to improved water facilities is 4,826,595 and with access to improved sanitation facilities is 5,516,847. Approximately 49.83 % of beneficiaries are women. The scale of the program is being doubled to include an additional 17 provinces and 100 districts. The project’s achievements since 2006 are: (1) nearly 7,000 (6,833) villages across Indonesia now enjoy access to clean water and improved sanitation; (2) more than 44.91% of target communities have become Open Defecation Free (ODF), in line with the worldwide OD trend rate of 40 to 50%; (3) more than 66.60% of communities have adopted hand-washing programs; (4) the program has freed up the hours women once spent fetching water; (5) the Complaint Handling System is increasing accountability, with an improvement in case resolution from 70% in July 2012 to 90% in December 2012; (6) In terms of capacity building, the program has benefited 3,680 local government personnel, more than 3,827 water boards, and 2,140 facilitators (in total 17,482 people); (7) Performance has improved in terms of community procurement and financial management, influencing the community’s overall fiduciary capacity; (8) Water and sanitation facilities are fully functioning in 72% of locations, partly functioning in 22%, and non-functioning in 6 %, with a changing shift from the use of public facilities to household connections [31, 32].
4.2 Data description
Data for water access is obtained from The CF book from IFLS 1, 2, 3, 4 and 5, description of the data is shown in Figure 2.
Source: IFLS
Figure 2. The water access pathway
In this study, it has been arranged in such a way that there are five types of water access as illustrated in Figure 2. Pipe 1, is a type of water access where households have been able to access water through pipeline since 1993. Pipe 2, is a type of water access where households have been able to access water through pipeline since 1997. Pipe 3, is a type of water access where households have been able to access water through pipeline since 2000. Pipe 4, is a type of water access where households have been able to access water through pipeline since 2007. Pipe 5, is a type of water access where households have been able to access water through pipeline since 2014.
Children performance and income from those who work as outcomes. The data is obtained from IFLS (Book 3A), specifically the DL section for children's achievement data and the TK section for personal income data. Children's performance is actually also presented in Book 5 (DLA Section), but there is a problem with data continuity, so it is used for educational historical data only.
Children's performance is proxied by the normal log of value of a math national final exam (EBTANAS/UN). Meanwhile, income is proxied by the normal log of income received from current work or the last previous work in IFLS 5. The data summarize for the children performance and income is as can be seen on Table 1.
For children performance we use mathematical values because mathematics is a logic subject and has a more definite assessment. Another study that also used the value of mathematics as one measure of outcomes was [33]. The year number used as a marker on each level of education variables, as can be seen in Table 1, is not the only national test score of the year. We adjusted the year markers according to the availability of available water access data at household level data on each IFLS wave. Year 1997 is used for the national exam score from 1993 to 1997. Year 2000 is used for the national exam score from 1998 to 2000. Year 2007 is used for the national exam score from 2001 to 2007. Year 2014 is used for the national exam score from 2008 to 2014.
Econometrics estimation
The researchers use a simple regression to estimate the impact of water access through pipeline to children performance. It uses three different sample types, for model 1 we used the whole sample (rural and urban), whereas for model 2 and 3 used sample rural and urban separately. As can be seen in Table 2, Table 3, and Table 4, mathematics scores for three levels of education (elementary school, junior high school, and senior high school) are only available sufficiently in 2007 and 2014.
An interesting result is seen in the OLS coefficient of model 2 (Table 2), that the mathematical score for children in rural areas whose families have access since 2000 has a higher score compared with newly gained access families in 2014. This is consistent with the results of research about the health of the mother while pregnant will be affected on the quality of the child in the future. If a mother gets a good nutritional intake and lives in an environment with access to clean water and good sanitation then her health will be better and will have an impact on her child's future.
However, different results are shown by the estimation results for urban samples. The results from urban samples indicate that the mathematical score of children from families who have access to water in 2014 has higher math scores than those who have gained access to water since 2000 even with families who have gained access since 1997. We can explain this because the samples for urban areas in 2014 have combined with those who have long used their own bottled water or water sources from well-off families. While those who used water access since 2000 or longer were those from disadvantaged families who used the water source from the government pipeline. This is indicated by a significant coefficient, which indicates there are many other significant variables that determine the mathematical score of a child in which one of them is a family background.
Table 1. Children performance and income summarize
|
Variables |
Obs |
Mean |
Std. Dev. |
Min |
Max |
|
Ln(Math primary school 1997) |
27 |
1.823 |
0.217 |
1.411 |
2.303 |
|
Ln(Math junior high school 1997) |
0 |
|
|
|
|
|
Ln(Math high school 1997) |
0 |
|
|
|
|
|
Ln(Math primary school 2000) |
114 |
1.803 |
0.292 |
0.693 |
2.251 |
|
Ln(Math junior high school 2000) |
22 |
1.736 |
0.193 |
1.416 |
2.079 |
|
Ln(Math high school 2000) |
0 |
|
|
|
|
|
Ln(Math primary school 2007) |
419 |
1.847 |
0.209 |
0.971 |
2.303 |
|
Ln(Math junior high school 2007) |
261 |
1.811 |
0.266 |
0.405 |
2.302 |
|
Ln(Math high school 20007) |
100 |
1.878 |
0.268 |
0.223 |
2.302 |
|
Ln(Math primary school 2014) |
854 |
1.885 |
0.261 |
0.560 |
2.303 |
|
Ln(Math junior high school 2014) |
915 |
1.902 |
0.296 |
0.560 |
2.303 |
|
Ln(Math high school 2014) |
521 |
1.921 |
0.299 |
0.40 5 |
2.303 |
|
Ln(individual income in 2014) |
12568 |
3.455 |
1.484 |
3.21 9 |
15.674 |
Table 2. Regression on math score for elementary school level, year 2014
|
Variables |
(1) b_ols_all |
(2) b_ols_rural |
(3) b_ols_urban |
|
pipe1 |
0.0426 (0.0328) |
0.0910 (0.0702) |
0.0226 (0.0376) |
|
pipe2 |
-0.0611* (0.0345) |
0.0363 (0.0728) |
-0.0942** (0.0397) |
|
pipe3 |
-0.0429 (0.0496) |
0.179** (0.0873) |
-0.143** (0.0605) |
|
pipe4 |
-0.0438 (0.0359) |
-0.0176 (0.0529) |
-0.0630 (0.0485) |
|
Constant |
1.899*** (0.00618) |
1.882*** (0.00924) |
1.911*** (0.00824) |
|
Observations |
2,126 |
854 |
1,272 |
|
R-squared |
0.003 |
0.007 |
0.010 |
Standard errors in parentheses *** p<0.001; ** p<0.05; * p<0.1
Table 3. Regression on math score for junior high school level, year 2014
|
Variables |
(1) b_ols_all |
(2) b_ols_rural |
(3) b_ols_urban |
|
pipe1 |
0.0754** (0.0315) |
0.0234 (0.0862) |
0.0758** (0.0335) |
|
pipe2 |
-0.000973 (0.0333) |
-0.0677 (0.0828) |
0.00530 (0.0361) |
|
pipe3 |
-0.0449 (0.0474) |
0.0457 (0.0799) |
-0.0981* (0.0586) |
|
pipe4 |
-0.00568 (0.0356) |
-0.0675 (0.0560) |
0.0427 (0.0462) |
|
Constant |
1.922*** (0.00611) |
1.904*** (0.0102) |
1.932*** (0.0076) |
|
Observations |
2,517 |
915 |
1,602 |
|
R-squared |
0.003 |
0.003 |
0.006 |
Standard errors in parentheses *** p<0.001; ** p<0.05; * p<0.1
Table 4. Regression on Math Score for Senior High School Level, Year 2014
|
Variables |
(1) b_ols_all |
(2) b_ols_rural |
(3) b_ols_urban |
|
pipe1 |
-0.0108 (0.0371) |
-0.154 (0.114) |
0.00553 (0.0398) |
|
pipe2 |
-0.0118 (0.0490) |
-0.0385 (0.173) |
-0.00848 (0.0518) |
|
pipe3 |
-0.0736 (0.0612) |
0.0474 (0.100) |
-0.138* (0.0768) |
|
pipe4 |
-0.0739 (0.0478) |
-0.107 (0.0717) |
-0.0515 (0.0635) |
|
Constant |
1.923*** (0.00765) |
1.926*** (0.0136) |
1.921*** (0.00925) |
|
Observations |
1,821 |
521 |
1,300 |
|
R-squared |
0.002 |
0.008 |
0.003 |
Standard errors in parentheses *** p<0.001; ** p<0.05; * p<0.1.
4.3 Impact of water access on children performance seen from education level
Data for water access is obtained from The CF book from IFLS1, IFLS2, IFLS3, IFLS4 and IFLS5, description of the data is as follows.
4.3.1 Elementary school
Nutrition is one of the determinants of the quality of human resources. Malnutrition is caused by direct and indirect factors. Indirect causal factors include the unavailability of food in the household, inadequate child care patterns, and clean water sanitation [34].
Water is one of the main factors that also affect the fulfillment of nutrition. Several cases of transmission of diseases such as typhoid, dysentery, diarrhea, cholera, and helminthiasis that occurred in elementary school children are caused by the quality of the clean water they received [35]. Findings by the studies of ref. [36-39] show that the availability of clean water and the incidence of worm infection in elementary school children in elementary school is significantly negatively related where the number of helminth infections caused by the lack of access to clean water.
Gawai et al. [40] show a high number of health problems related to hand washing in elementary school age children, such as intestinal worms which are widespread in rural and urban areas (51.4%). Worm disease is one of the environmental-based diseases. The three environmental factors such as soil, water, and sewage disposal sites are polluted by eggs or larvae of worms and accumulate with unhealthy human behavior, namely personal hygiene, which can cause helminthiasis. The impact of helminthiasis if it occurs in school-age children can result in a decrease in the health, nutrition, intelligence and productivity of the sufferer [41]. Worm infections can be one of the causes of nutritional deficiencies in the food consumed by children. Adult worms in the intestine will absorb nutrients and affect the nutritional status. Based on a 2016 study of primary school children in Kenya, it is revealed that 59% of children are undernourished due to helminth infections [42].
A study from the World Bank found that around 95% of all fecal waste in Indonesia is untreated and returns to the environment due to a lack of safely managed sanitation facilities (poor quality septic tanks and other issues), thereby significantly increasing the risk of disease in children [43]. Increased access to clean water is also reported to be related to improving education indicators in rural areas that have access to clean water. Research conducted by Nauges and Strand [44], which focused on a number of regions in Africa, reported that increased access to water was associated with increased student attendance at school, particularly primary school students. Furthermore, a study from the World Bank in 2001 reported that before the Nigerian government received clean water program assistance from the World Bank, the absentee rate of primary school students in Nigerian villages is 60% or more. It is because most of the children in the village have to help their parents find water to other villages that already have access to clean water. After getting the clean water program, student absenteeism from school can be reduced by 16% [45]. The same phenomenon also applies in a World Bank study for the case in Bangladesh, year 2002.
Personal hygiene is closely related to environmental sanitation, where personal hygiene must be supported by good environmental sanitation, including easy access to clean water. Whether a child suffers from diarrhea is influenced by many factors, at the level of the household as well as at the level of the community in which the household is living. Ideally, an analysis of the determinants of diarrhea should take all relevant factors at both levels into account [46, 47]. Children from a household with good quality water and sanitation are still at risk for diarrhea if they live in a community with open defecation, due to the contamination of soil and water sources [46, 48].
The need for water is excessively complex, such as for drinking, cooking, bathing, washing (various kinds of laundry), etc. In order for the water to remain healthy and free from germs, the water used must be treated first. For this reason, the provision of clean water must meet requirements such as: Physical water quality requirements are colorless, tasteless, odorless and clear. Chemically, good water is not excessively polluted by chemicals or minerals, especially substances that are harmful to health. And the bacteriological requirements of all drinking water should be able to avoid the possibility of being contaminated with bacteria, especially pathogenic bacteria. Bearing in mind that it is impossible for the water to be consumed to be 100% in accordance with the health requirements, however, the available water is managed in such a way as to approach the stated requirements [49].
4.3.2 Junior high school
Adolescence is a defining period for physical and cognitive development. Good nutritional intake during adolescence is important for these two aspects. Water is actually also a nutrient because it fulfills the requirements as a substance needed by the body, especially to regulate metabolism and daily activities. Fulfillment of water needs for the human body generally comes from drinks, partly from food, and from water resulting from the metabolism of carbohydrates, fats, and proteins in the body in small amounts. Inadequate nutritional intake as a teenager can have lifelong effects. Adolescents in Indonesia bear three burdens of malnutrition: malnutrition, overweight, and micronutrient deficiencies. About 12% of young men (16-18 years) are underweight and 29% are short. For adolescent girls, the figures are 4.3% thin and 25% short [50]. The number of adolescents aged 16-18 years with excess body weight has increased significantly in Indonesia, from 1.4% in 2010 to 8.1% in 2018. Data from 2013 shows that 23% of adolescents aged 12-18 years are anemic. Considering that adolescents are still growing, low nutritional quality will hinder this growth and prevent optimal physical and cognitive potential from being achieved. Improving nutrition in particular can have an important impact on adolescent girls—who will become mothers—by preventing malnutrition from being passed on to the next generation.
The results of research by Cediel et al. [51] show that, the level of adequacy of water consumption in adolescents has been shown to be associated with % body fat with a value of r = -0.596, meaning that the higher the water consumption, the lower the % body fat. Access to clean drinking water is a very important resource for public health. At a young age, cleanliness and health are very important to maintain. This is closely related to the puberty period experienced by teenagers, where at puberty the body begins to produce oil and begins to sweat more. If this oil and sweat is not cleaned regularly, it can cause an unpleasant odor and can also cause disease.
Hygiene and personal health of a teenager needs to be considered starting from the hair, skin, body, teeth, genitals, and clothes. Genital hygiene for adolescents should be a concern, because genital hygiene plays an important role in the reproductive process [52]. So, it must be cared for and cleaned properly, because if it is not cleaned it will cause infection.
4.3.3 Senior high school
Water is also a component of the environment because the quality and quantity of water affects every human beings lives. Clean water can be a healthy drink; on the other hand, dirty water can cause disease [53]. Water is the main composition in the body. The amount of water content contained in the body is about 50-80%, depending on age. How to calculate water needs is 30 ml per kilogram of body weight. If the body weight is 90 kg, then they need about 2700 ml of fluid. Lack of fluid intake in the body can result in decreased concentration that can interfere daily activities.
Easy access to clean water will make it easier for individuals to get drinking water. Drinking enough can help protect the health of internal organs, regulate body temperature, and distribute nutrients to various parts of the body. The amount of fluid intake per day is influenced by age, gender, activity, environment, and health conditions. Water needs based on different ages, middle school age children a are categorized in the early adult phase. Adult women need seven glasses/day while adult men need eight glasses/day. Magnesium, calcium, and silica basically help to care for bones, selenium and zinc function to boost adult immune cells, balance fluids in the body while maintaining blood pressure, and sodium, as already mentioned, can help maintain salt levels in the body [54].
Community access to proper sanitation and drinking water is part of the promotive-preventive efforts that must be prioritized. Effective promotive-preventive efforts will reduce the incidence of disease, the number of people who are sick, and those who seek treatment so that it has an impact on the efficiency of health costs which are the burden of the government and society. If a household does not have access to sufficient water then have to carry water into the house from outside, work related to fulfilling water in the house is generally the responsibility of the mother and adolescent in a household. This role of fetching water can be a burden for children, who lose energy and have little time to study [55]. Areas with limited clean water are forced to buy clean water. Unfortunately, the economic conditions of the Indonesian people have not been fully able to accept this. Some parents think that the current cost of sending their children to school is higher than spending it on buying clean water. Thus, they prefer to spend money on other more important things and are forced to consume less decent water. It will then trigger the emergence of various diseases. Unhealthy body conditions will result in senior high school age children having high performance or at worst dropping out of school altogether [56].
The estimation of the impact of water access through pipeline on the mathematics of children shows different results between levels. These results indicate a difference sign in the effect of pipeline between urban and rural samples. Both samples, both rural and urban samples, have a significant impact on the mathematics of children, but the sign of the estimation have opposite directions. In the urban samples the sign of the estimate is negative, while for rural samples the sign of the estimate is positive. These results suggest that access to piped water in urban areas has a lower impact on the mathematics of children compared to other water access. Other water access refers to the use of bottled mineral water, which is increasingly increasing in urban areas [57].
In the urban samples the sign of the estimate is negative while for rural samples, the sign of the estimate is positive. These results suggest that access to piped water in urban areas has a lower impact on the mathematics of children compared to other water access. Other water access refers to the use of bottled mineral water, which is increasing in urban areas [58].
The estimation results on the individual income, as shown in Table 4, show that variable Pipe 3 has a significant positive effect on individual income in 2014, on model 1 and model 3. Although these results are still not promising, it can be concluded that water access through pipeline has a positive impact on one's performance. The results shown in Table 5 also show that access to piped water has a significant impact on those living in urban areas as indicated by the results of model 3.
4.4 Impact of water access on children performance seen from rural and urban areas
As can be seen in Table 5, results of regression analysis on household water expenditure in 2014.
Table 5. Regression on household water expenditure, year 2014
|
Variables |
(1) b_ols_r |
(2) b_ols_ur |
|
Water pollution |
0.277*** (0.0497) |
0.126** (0.0491) |
|
Urban |
|
0.650*** (0.0337) |
|
Number of HH members |
|
0.0373*** (0.0107) |
|
Number of Female in HH |
|
0.0854*** (0.0178) |
|
Region Dummy: |
|
|
|
Sumatra |
|
0.0617 (0.0579) |
|
Jawa Bali |
|
0.0710 (0.0514) |
|
Kalimantan |
|
1.358*** (0.0859) |
|
Constant |
7.420*** (0.0178) |
6.512*** (0.0588) |
|
Observations |
15,141 |
15,141 |
|
R‐squared |
0.002 |
0.054 |
Standard errors in parentheses *** p<0.001; ** p<0.05; * p<0.1
The situation of poverty in Indonesia cannot be separated from the spatial dimension, with significant differences between urban and rural areas. First, poverty rates in rural areas are higher than in urban areas: rural poverty affects 13% of households, compared to 7% in urban areas. Second, the rate of poverty reduction in urban areas is faster than in rural areas. Third, poverty in rural areas is more severe than in urban areas. It means that, compared to urban areas, children living in rural areas are much more at risk of experiencing not only poverty in terms of income, but also various forms of deprivation: lack of sanitation facilities, incomplete immunization, lack of health insurance, inadequate nutrition, lack of opportunity to get basic education, unregistered births, inadequate housing conditions, etc.
Clean water is one of the basic human needs needed in a sustainable manner. The use of clean water is important for household consumption, industrial needs, and public places. Therefore, it is natural that the clean water sector gets the main priority for handling because it involves the lives of many people. However, one thing that currently needs to be considered is the availability of clean water in urban and rural areas. Cities provide easy access to clean water. In public places in terminals, stations, and parks, taps and free drinking water are provided. Channels are hierarchically connected, uninterrupted, well-maintained, trash-free, clean and smooth. Community participation in cleaning water channels in front of the house is also more active. In urban areas, the availability of clean water is utilized as well as possible. Water infiltration wells are reproduced and sites are revitalized to increase water absorption into the soil and reduce water being discharged into rivers (eco drainage). The rest of the water from the environmental canal enters the city canal, drains are made to city parks equipped with infiltration wells or accommodated there, lakes, reservoirs, or polders. This is due to population growth and development, the need for clean water in urban areas is also increasing, competition for clean water for various purposes will also continue to increase.
Regional development in an area will cause the need for clean water to continue to increase along with the rate of population growth. The fulfilment of food needs and the activities of the population is always closely related to the need for clean water. The study in Bengkulu City conducted by Tri Sambodo [59] show that the source of clean water for MCK (a place for bathing and washing as well as serving as a lavatory ─toilet─) is 40.5% of urban residents using PDAM, while 58.1% of rural residents use dug wells. The use of drinking water comes from PDAM in urban areas by 28.4% in rural areas by 10.8%. In urban and rural areas, there are still those who use springs as drinking water, namely 41% and 7.4%, respectively.
There is a significant difference between clean water sources and water sources for MCK in both urban and rural areas. It is because people in urban areas have understood the difference between the use of drinking water and water for MCK. This statement is supported by the findings of Armah et al. [60] that among countries in Sub-Saharan Africa, there are geographically significant differences between the levels of clean water and drinking water. Inequality in sanitation between urban and rural areas generally also occurs in socio-economic disparities between villages. Urban areas generally have structural conditions such as the existence of community empowerment, the availability of sectoral funds, the availability of educational facilities from all levels of education, to the higher education level of regional leaders when compared to rural areas.
It, then, becomes a factor that causes the poor condition of access to sanitation and drinking water in rural areas, including the unsupported rural area by various adequate structural conditions. In addition, the contribution of rural communities to village environmental management activities is also very low. In essence, the contribution of the community influences decision-making and initiatives regarding the provision of clean water services. In rural Zambia, for example, the existence of community led total sanitation (CLTS) has an impact that encourages development, increases community hygiene beliefs and behaviors [61].
The allocation of funds for sanitation and drinking water development in rural areas is still very low; this is exacerbated by the economic conditions of rural communities. Villagers prefer river water or well water as a source of clean water that is used to carry out their daily activities such as bathing, washing, and latrines. This has the potential to cause the proliferation of bacteria in the body.
These results are similar to the study conducted by Yip et al. [62] where generally the allocation and related subsidies for the provision of latrines are prioritized in urban areas first and then expanded to rural areas with lower financial levels. In addition to the allocation of funds, another thing that triggers the lack of clean water availability is the level of education of rural and urban communities. Rural areas lag behind in access to junior secondary to tertiary education facilities and there are significant differences between the two regions. A study by Igudia [63] in Nigeria presented similar results where rural areas suffer from glaring shortages in terms of infrastructure and social services such as schools. Of course, access to closer schools allows the community to be exposed to health knowledge so as to create awareness about the health consequences of poor sanitation that affect the use of latrines.
These results are similar to the research of Schafft [64] which results that the level of education in rural communities tends to lag behind the level of education in urban communities; whereas, the level of education is an important factor in the perception and view of sanitation development. For example, in Ghana, low education contributes to poor waste management [65]. Through increasing education status, awareness regarding the impact of poor sanitation on the incidence of infectious diseases will also increase.
The results of data analysis show that access to clean water has a significant effect on learning achievement which is a proxy for children's achievement. Nutrients are excessively needed in school-age children, including in supporting the growth and development of children, energy needs, concentration, and endurance. The low nutritional status of school children will have a negative impact on the quality of human resources.
At various levels of education, access to clean water is still influential, especially at the elementary school level. Furthermore, the results of the analysis also show that access to clean water for households in urban and rural areas has a significant effect. However, in urban areas the effect tends to be negative, while in rural areas the effect tends to be positive. This means that in rural areas, access to clean water is very influential on children's performance.
As a follow-up to the research results, it is recommended that the government be more massive in preparing clean water infrastructure, so that access to clean water will be easier, especially in rural areas. Furthermore, the government also needs to protect forests and prevent deforestation. This is because the forest is a source of water. The community also needs to continue to receive education about clean water, so that it becomes a community behavior.
This research was supported by grants from the Research and Community Services Institute of Udayana University and the Faculty of Economics and Business, Udayana University. The authors are very grateful for all forms of material support and initial comments that have been given, including from the Udayana University Sustainable Development Policies Studies (SDPS) team.
[1] D'Odorico, P., Davis, K.F., Rosa, L., et al. (2018). The global food-energy-water nexus. Reviews of Geophysics, 56(3): 456-531. https://doi.org/10.1002/2017WR020889
[2] World Health Organization. (2016). Towards a grand convergence for child survival and health: A strategic review of options for the future building on lessons learnt from IMNCI.
[3] Marsily, G., Abarca-del-Rio, R. (2016). Water and food in the twenty-first century. Surveys in Geophysics, 37: 503-527. https://doi.org/10.1007/978-3-319-32449-4
[4] Agustina, R., Dartanto, T., Sitompul, R., et al. (2019). Universal health coverage in Indonesia: Concept, progress, and challenges. The Lancet, 393(10166): 75-102. https://doi.org/10.1016/S0140-6736(18)31647-7
[5] Saputri, A.A.I. (2018). Implementation of financing compass for welfare partner operational system grameen bank in Banyumas regency. Ijtimāiyya: Journal of Muslim Society Research, 3(1): 21-36. https://doi.org/10.24090/IJTIMAIYYA.V3I1.1674
[6] Tiwari, P.C., Tiwari, A., Joshi, B. (2018). Urban growth in Himalaya: understanding the process and options for sustainable development. Journal of Urban and Regional Studies on Contemporary India, 4(2): 15-27.
[7] Quesada Roman, A. (2020). Deciphering natural hazard histories based on tree-ring analyses in contrasting tropical ecosystems of Costa Rica. Doctoral dissertation. Universite de Geneva. https://doi.org/10.13097/archive-ouverte/unige:147478
[8] Statistics Indonesia (Badan Pusat Statistik). (2020). Environment Statistics of Indonesia 2020. Statistics Indonesia, Jakarta.
[9] Henning-Smith, C., Prasad, S., Casey, M., Kozhimannil, K., Moscovice, I. (2019). Rural-urban differences in medicare quality scores persist after adjusting for sociodemographic and environmental characteristics. The Journal of Rural Health, 35(1): 58-67. https://doi.org/10.1111/JRH.12261
[10] Garbarino, S., Lanteri, P., Durando, P., Magnavita, N., Sannita, W.G. (2016). Co-morbidity, mortality, quality of life and the healthcare/welfare/social costs of disordered sleep: A rapid review. International Journal of Environmental Research and Public Health, 13(8): 831. https://doi.org/10.3390/ijerph13080831
[11] Wu, Y., Luo, J., Zhang, X., Skitmore, M. (2016). Urban growth dilemmas and solutions in China: Looking forward to 2030. Habitat International, 56: 42-51. https://doi.org/10.1016/j.habitatint.2016.04.004
[12] Renzaho, A., Chitekwe, S., Chen, W., Rijal, S., Dhakal, T., Chikazaza, I.R., Dahal, P. (2018). Impact of a multidimensional child cash grant programme on water, sanitation and hygiene in Nepal. Journal of Water, Sanitation and Hygiene for Development, 8(3): 520-532. https://doi.org/10.2166/washdev.2018.006
[13] Sonnino, R. (2016). The new geography of food security: exploring the potential of urban food strategies. The Geographical Journal, 182(2): 190-200. https://doi.org/10.1111/GEOJ.12129
[14] Zhu, X., Sun, W., Cai, X. (2021). The third equilibrium: the economic impact of future and the model of multidimensional equilibrium. Theoretical Economics Letters, 11(01): 21. https://doi.org/10.4236/TEL.2021.111002
[15] Siregar, P.G., Supriatna, J., Koestoer, R.H., Harmantyo, D. (2018). System dynamics modeling of land use change in West Kalimantan, Indonesia. BIOTROPIA-The Southeast Asian Journal of Tropical Biology, 25(2): 103-111. https://doi.org/10.11598/BTB.2018.25.2.792
[16] Mari, L., Casagrandi, R., Rinaldo, A., Gatto, M. (2018). Epidemicity thresholds for water-borne and water-related diseases. Journal of Theoretical Biology, 447: 126-138. https://doi.org/10.1016/J.JTBI.2018.03.024
[17] Overbo, A., Williams, A.R., Evans, B., Hunter, P.R., Bartram, J. (2016). On-plot drinking water supplies and health: A systematic review. International Journal of Hygiene and Environmental Health, 219(4-5): 317-330. https://doi.org/10.1016/J.IJHEH.2016.04.008
[18] Kismul, H., Acharya, P., Mapatano, M.A., Hatløy, A. (2018). Determinants of childhood stunting in the Democratic Republic of Congo: Further analysis of Demographic and Health Survey 2013–14. BMC Public Health, 18(1): 1-14. https://doi.org/10.1186/S12889-017-4621-0/TABLES/2
[19] Juma, O.A., Enumah, Z.O., Wheatley, H., et al. (2016). Prevalence and assessment of malnutrition among children attending the Reproductive and Child Health clinic at Bagamoyo District Hospital, Tanzania. BMC Public Health, 16(1): 1-6. https://doi.org/10.1186/S12889-016-3751-0/TABLES/2
[20] Hanna-Attisha, M., LaChance, J., Sadler, R.C., Champney Schnepp, A. (2016). Elevated blood lead levels in children associated with the Flint drinking water crisis: a spatial analysis of risk and public health response. American Journal of Public Health, 106(2): 283-290. https://doi.org/10.2105/AJPH.2015.303003
[21] Geere, J.A.L., Cortobius, M., Geere, J.H., Hammer, C.C., Hunter, P.R. (2018). Is water carriage associated with the water carrier’s health? A systematic review of quantitative and qualitative evidence. BMJ Global Health, 3(3): e000764. https://doi.org/10.1136/BMJGH-2018-000764
[22] Papalia, N.L., Luebbers, S., Ogloff, J.R.P., Cutajar, M., Mullen, P.E. (2017). The long-term co-occurrence of psychiatric illness and behavioral problems following child sexual abuse. Australian & New Zealand Journal of Psychiatry, 51(6): 604-613. https://doi.org/10.1177/0004867416667232
[23] Vince, J., Hardesty, B.D. (2018). Governance solutions to the tragedy of the commons that marine plastics have become. Frontiers in Marine Science, 5: 214. https://doi.org/10.3389/fmars.2018.00214
[24] Jabbar, F.K., Grote, K. (2019). Statistical assessment of nonpoint source pollution in agricultural watersheds in the Lower Grand River watershed, MO, USA. Environmental Science and Pollution Research, 26: 1487-1506. https://doi.org/10.1007/s11356-018-3682-7
[25] Setiawan, R.P., Ghimire, G., Kaneko, S. (2021). The effect of information on preferences for improved household water supply in Indonesia and Nepal. International Journal of Water Resources Development, 1-18. https://doi.org/10.1080/07900627.2021.1991287
[26] Demena, B.A., Afesorgbor, S.K. (2020). The effect of FDI on environmental emissions: Evidence from a meta-analysis. Energy Policy, 138: 111192. https://doi.org/10.1016/J.ENPOL.2019.111192
[27] Saqib, M., Benhmad, F. (2021). Updated meta-analysis of environmental Kuznets curve: Where do we stand? Environmental Impact Assessment Review, 86: 106503. https://doi.org/10.1016/J.EIAR.2020.106503
[28] Cañaveral, M., Emmendorfer, L., Spenassato, D., Azambuja, A. (2021). Spatial econometric models applied to environmental pollution: A literature review of the socioeconomics drivers. Search Life-Sciences Literature. https://doi.org/10.20944/PREPRINTS202104.0661.V1
[29] Geere, J.A., Cortobius, M. (2017). Who carries the weight of water? Fetching water in rural and urban areas and the implications for water security. Water Alternatives, 10(2): 513-540.
[30] Campbell, S.J., Biritwum, N.K., Woods, G., Velleman, Y., Fleming, F., Stothard, J.R. (2018). Tailoring water, sanitation, and hygiene (WASH) targets for soil-transmitted helminthiasis and schistosomiasis control. Trends in Parasitology, 34(1): 53-63. https://doi.org/10.1016/J.PT.2017.09.004
[31] Brehmer, C., Norris, C., Barkjohn, K.K., et al. (2019). The impact of household air cleaners on the chemical composition and children's exposure to PM2. 5 metal sources in suburban Shanghai. Environmental Pollution, 253: 190-198. https://doi.org/10.1016/J.ENVPOL.2019.07.003
[32] Thapa, D., Farid, M.N., Prevost, C. (2021). Governance drivers of rural water sustainability. Policy Research Working Paper. https://doi.org/10.1596/1813-9450-9798
[33] Awofala, A.O.A. (2017). Assessing senior secondary school students’ mathematical proficiency as related to gender and performance in mathematics in Nigeria. Int. J. Res. Educ. Sci., 3(2): 488–502. https://doi.org/10.21890/ijres.327908
[34] Drammeh, W., Hamid, N.A., Rohana, A.J. (2019). Determinants of household food insecurity and its association with child malnutrition in Sub-Saharan Africa: A review of the literature. Current Research in Nutrition and Food Science Journal, 7(3): 610-623. https://doi.org/10.12944/CRNFSJ.7.3.02
[35] Haetami, K., Junianto, J., Iskandar, I., Rostika, R., Abun, A. (2017). Durability and water stability of pellet fish supplementation results pairing coconut oils and hazlenut oil. International Journal of Environment, Agriculture and Biotechnology, 2(3): 238800. https://doi.org/10.0/CSS/ALL.CSS
[36] Tefera, E., Belay, T., Mekonnen, S.K., Zeynudin, A., Belachew, T. (2017). Prevalence and intensity of soil transmitted helminths among school children of Mendera Elementary School, Jimma, Southwest Ethiopia. The Pan African Medical Journal, 27(88). https://doi.org/10.11604/PAMJ.2017.27.88.8817
[37] Hailegebriel, T. (2017). Prevalence of intestinal parasitic infections and associated risk factors among students at Dona Berber primary school, Bahir Dar, Ethiopia. BMC Infectious Diseases, 17(1): 1-8. https://doi.org/10.1186/S12879-017-2466-X/TABLES/4
[38] Liao, C.W., Chiu, K.C., Chiang, I.C., et al. (2017). Prevalence and risk factors for intestinal parasitic infection in schoolchildren in Battambang, Cambodia. The American Journal of Tropical Medicine and Hygiene, 96(3): 583. https://doi.org/10.4269/AJTMH.16-0681
[39] Ganguly, S., Barkataki, S., Karmakar, S., et al. (2017). High prevalence of soil-transmitted helminth infections among primary school children, Uttar Pradesh, India, 2015. Infectious Diseases of Poverty, 6(1): 1-9. https://doi.org/10.1186/S40249-017-0354-7/TABLES/5
[40] Gawai, P.P., Taware, S.A., Chatterjee, A.S., Thakur, H.P. (2016). A cross sectional descriptive study of hand washing knowledge and practices among primary school children in Mumbai, Maharashtra, India. Int. J. Community Med. Public Health, 3(10): 2958-2966. https://doi.org/10.18203/2394-6040.ijcmph20163391
[41] Indonesia, K.R. (2017). Profil Kesehatan Indonesia Tahun 2017 (Health Profile of Indonesia 2017). https://pusdatin.kemkes.go.id/resources/download/pusdatin/profil-kesehatan-indonesia/Profil-Kesehatan-Indonesia-tahun-2017.pdf.
[42] Kepha, S., Nikolay, B., Nuwaha, F., et al. (2016). Plasmodium falciparum parasitaemia and clinical malaria among school children living in a high transmission setting in western Kenya. Malaria Journal, 15(1): 1-13. https://doi.org/10.1186/S12936-016-1176-Y/TABLES/4
[43] Fernald, L.C., Prado, E., Kariger, P., Raikes, A. (2017). A toolkit for measuring early childhood development in low and middle-income countries. Minist. Educ.
[44] Nauges, C., Strand, J. (2017). Water hauling and girls’ school attendance: some new evidence from Ghana. Environmental and Resource Economics, 66(1): 65-88. https://doi.org/10.1007/S10640-015-9938-5/TABLES/18
[45] Komarulzaman, A., de Jong, E., Smits, J. (2019). Effects of water and health on primary school enrolment and absenteeism in Indonesia. Journal of Water and Health, 17(4): 633-646. https://doi.org/10.2166/WH.2019.044
[46] Komarulzaman, A., Smits, J., de Jong, E. (2017). Clean water, sanitation and diarrhoea in Indonesia: Effects of household and community factors. Global Public Health, 12(9): 1141-1155. https://doi.org/10.1080/17441692.2015.1127985
[47] Yaya, S., Hudani, A., Udenigwe, O., Shah, V., Ekholuenetale, M., Bishwajit, G. (2018). Improving water, sanitation and hygiene practices, and housing quality to prevent diarrhea among under-five children in Nigeria. Tropical medicine and infectious disease, 3(2): 41. https://doi.org/10.3390/TROPICALMED3020041
[48] Hutton, G., Chase, C. (2016). The knowledge base for achieving the sustainable development goal targets on water supply, sanitation and hygiene. International Journal of Environmental Research and Public Health, 13(6): 536. https://doi.org/10.3390/IJERPH13060536
[49] Khan, S., Naushad, M., Al-Gheethi, A., Iqbal, J. (2021). Engineered nanoparticles for removal of pollutants from wastewater: Current status and future prospects of nanotechnology for remediation strategies. Journal of Environmental Chemical Engineering, 9(5): 106160. doi: https://doi.org/10.1016/J.JECE.2021.106160
[50] UNICEF. (2020). Designing Parenting Programmes for Violence Prevention: A Guidance Note. https://www.unicef.org/media/77866/file/Parenting-Guidance-Note.pdf.
[51] Cediel, G., Corvalán, C., Aguirre, C., de Romaña, D.L., Uauy, R. (2016). Serum 25-Hydroxyvitamin D associated with indicators of body fat and insulin resistance in prepubertal Chilean children. International Journal of Obesity, 40(1): 147-152. https://doi.org/10.1038/ijo.2015.148
[52] Maqbool, M., Khan, M., Mohammad, M., Adesina, M. A., Fekadu, G. (2019). Awareness about reproductive health in adolescents and youth: A review. Journal of Applied Pharmaceutical Sciences and Research, 1-5. https://doi.org/10.31069/JAPSR.V2I3.1
[53] Yan, Y., Chen, H., Chen, L., et al. (2020). Consensus of Chinese experts on protection of skin and mucous membrane barrier for health‐care workers fighting against coronavirus disease 2019. Dermatologic Therapy, 33(4): e13310. https://doi.org/10.1111/DTH.13310
[54] Cooper, A.Y., Altman, E., Hecht, C.E., Bruce, J., Patel, A.I. (2020). Stories of success: a qualitative examination of contributors to excellence in school drinking water access. Public Health Nutrition, 23(10): 1800-1809. https://doi.org/10.1017/S1368980019003975
[55] McMichael, C. (2019). Water, sanitation and hygiene (WASH) in schools in low-income countries: A review of evidence of impact. International Journal of Environmental Research and Public Health, 16(3): 359. https://doi.org/10.3390/IJERPH16030359
[56] Neves-Silva, P., Martins, G.I., Heller, L. (2018). “We only have access as a favor, don’t we?” The perception of homeless population on the human rights to water and sanitation. Cadernos de Saude Publica, 34. https://doi.org/10.1590/0102-311X00024017
[57] Pacheco-Vega, R. (2019). Human right to water and bottled water consumption: Governing at the intersection of water justice, rights and ethics. Water Polit. Governance, Justice Right to Water, pp. 113-128. https://doi.org/10.4324/9780429453571-9/human-right-water-bottled-water-consumption-ra.
[58] Zuccarello, P., Manganelli, M., Conti, G.O., et al. (2021). Water quality and human health: A simple monitoring model of toxic cyanobacteria growth in highly variable Mediterranean hot dry environments. Environmental Research, 192: 110291. https://doi.org/10.1016/J.ENVRES.2020.110291
[59] Tri Sambodo, M. (2018). The Rural Electricity Programme in Indonesia. From Darkn. to Light, 136-175. https://doi.org/10.1355/9789814695480-011/HTML
[60] Armah, F.A., Ekumah, B., Yawson, D.O., Odoi, J.O, Afitiri, A.R., Nyieku, F.E. (2018). Access to improved water and sanitation in sub-Saharan Africa in a quarter century. Heliyon, 4(11): e00931. https://doi.org/10.1016/J.HELIYON.2018.E00931
[61] Jones, A.D., Acharya, Y., Galway, L.P. (2016). Urbanicity gradients are associated with the household-and individual-level double burden of malnutrition in Sub-Saharan Africa. The Journal of Nutrition, 146(6): 1257-1267. https://doi.org/10.3945/JN.115.226654
[62] Yip, W.C.M., Hsiao, W.C., Chen, W., Hu, S., Ma, J., Maynard, A. (2020). Early appraisal of China’s huge and complex health care reforms. Health Care Policy in East Asia: A World Scientific Reference: Volume 1: Health Care System Reform and Policy Research in China, 51-83. https://doi.org/10.1142/9789813236134_0004
[63] Igudia, I.H. (2018). Analysis of school and non-school factors affecting children’s access to basic education in rural areas of south-western Nigeria. https://uilspace.unilorin.edu.ng/handle/20.500.12484/1709?show=full.
[64] Schafft, K.A. (2016). Rural education as rural development: Understanding the rural school–community well-being linkage in a 21st-century policy context. Peabody Journal of Education, 91(2): 137-154. http://dx.doi.org/10.1080/0161956X.2016.1151734
[65] Mamady, K. (2016). Factors influencing attitude, safety behavior, and knowledge regarding household waste management in Guinea: A cross-sectional study. Journal of Environmental and Public Health, 2016: 9305768. http://dx.doi.org/10.1155/2016/9305768AAA