Kifah Alhazzaa
© 2022 IIETA. This article is published by IIETA and is licensed under the CC BY 4.0 license (http://creativecommons.org/licenses/by/4.0/).
OPEN ACCESS
The primary objective of the study is to determine if plants and water can lower particulate matter (PM) and carbon dioxide (CO2) levels in microclimates while simultaneously enhancing user thermal comfort. There are several implications of urban air pollution on human health, ranging from eye discomfort to fatality. The previous studies investigated the human thermal comfort in term of temperature and humidity. The purpose of this study is to evaluate thermal comfort and air pollution in two microclimates of a Tucson, Arizona college building. The trees and water features have increased the relative humidity by 110 percent over baseline levels. Consequently, the temperature fell by 19%. This significant microclimate improvement will put the majority of outdoor areas inside the thermal comfort zone for humans. The trees and water had a considerable influence on PM levels, decreasing PM2.5 by 50 percent and PM10 by 55 percent. In this research, however, the C3 type Calvin cycle caused a 4.8% increase in CO2. The trees may lower CO2 in other senior with a higher CO2 content, hence decreasing the possibility that the C3 cycle will be initiated. The ability to minimize air pollutants while simultaneously enhancing temperature conditions would result in a microclimate that is conducive to a variety of activities.
microclimate, health in built environment, outdoor thermal comfort, particulate matter, carbon dioxide, healthy environment
Any sort of setting requires comfortable and healthy microclimate conditions. In the urban environment, people are exposed to a variety of stressors. The design and properties of the built environment in terms of percentage of the built-up area, geometry of the structures, vegetation, and water features are some of the causes [1, 2]. These characteristics have an impact on urban climatic phenomena such as the urban heat island (UHI) and radiation flux fluctuation. Recent research has found that outdoor thermal environment parameters such as air temperature, wind speed, relative humidity, and solar radiation influence thermal comfort evaluation, such as thermal perception and satisfaction [3]. Human thermal comfort in outdoor area is essential factor determining the user usage of the space [4, 5].
The outdoor thermal environment is influenced by the built environment. There is evidence, for example, that ground surface coverage [6], vegetation evapotranspiration [7], and shade by objects and trees [3] all have a substantial impact on the thermal environment. By lowering air temperature and increasing the quantity of moisture in the air, green spaces in cities and buildings improve the urban landscape and regulate the urban climate [7]. Gardenes have been shown in previous research to have a cooling effect due to the combined effects of shade and evapotranspiration [8]. Several research looked at the impact of trees and water in urban environments in temperate microclimates [7, 9], as well as hot dry regions [10, 11].
In the earlier investigations, the human thermal comfort was exclusively examined in terms of temperature and humidity. The goal of this study is to evaluate microclimatic, human comfort, and air pollutants in two areas of a college building in Tucson, Arizona. The two locations are adjacent, the first is a well-defined garden, and the second is a parking lot. The ambient temperature, relative humidity, particulate matter (PM), and carbon dioxide (CO2) levels will be assessed in this investigation. The research's primary topic is whether plant and water feature lower PM and CO2 levels and enhance the user's thermal comfort by reducing the temperature and raising the humidity in microclimates.
Lin used field measurements and a subjective thermal sensation vote (TSV) questionnaire survey to investigate heat perception in a public area in a hot and humid environment [12]. The findings revealed that psychological and behavioral elements, in addition to the human energy balance model, have a substantial impact in outdoor thermal comfort. The importance of Sky View Factor (SVF) in urban climate was reported by Kruger et al. [13]. The SVF is a measurement of how much sky is seen at a specific location. SVF has a value ranging from 0 (zero) to 1, with 1 denoting a region with no obstruction between the specified place and the sky. Lin et al. used the Physiologically Equivalent Temperature (PET) thermal index to evaluate the influence of shade on long-term thermal comfort in outdoor spaces of a university campus in a hot and humid climate [3]. The SVF formed by buildings and plants has a considerable influence on users' perceptions of thermal comfort, according to the researchers.
According to previous studies, urban trees that are incorporated into the fabric operate as cooling factors [14]. Matsuoka and Kaplan looked at people's needs in the urban environment. They discovered that when it comes to green spaces, individuals want to be connected to nature, have an aesthetic experience, and have entertainment [15]. The local climate is influenced by the vegetation. It is regarded as an important design feature for improving urban microclimate and outdoor thermal comfort in urban areas [16]. The use of green as a method to reduce the urban heat island (UHI) and enhance microclimate has received a lot of attention [17, 18]. The use of green as a method to reduce the urban heat island (UHI) and enhance microclimate has received a lot of attention [17, 18]. The optimal usage of vegetation in hot and arid areas should take use of its shading aspect to minimize strong solar radiation in the summer, as overheating is mostly due to heat storage by exposed surfaces. Due to a shortage of water in the soil, evapotranspiration is generally low unless regular irrigation is provided. In hot and dry areas, sparser vegetation that is properly blended within the urban structure to generate appropriate shadow is recommended [19].
The Ancient architecture employed water elements to produce a comfortable thermal environment [20]. Fountains, cascades, water channels, and ponds are just some of the options. One of the most important parts of urban ecology is urban water bodies, which may be found in parks and residential zones. In hot climates, water is essential for evaporative cooling [21, 22]. The cooling effect of shade and evapotranspiration reduces ambient temperature by 1e4.7 K, according to experimental evidence [7]. Nishimura et al. conducted a follow-up analysis and found novel water features, such as waterfalls and spray fountains, to help maintain a pleasant urban environment [23]. The air temperature readings revealed a 3 K drop in temperature during the water evaporation phase. Falling water, according to Ghiabaklou, increases the evaporative cooling effect and lowers air temperature [24].
Toxic components, the burning of fossil fuels, different human activities, and many chemical compounds used in production and everyday living all contribute to urban air pollution [25]. These sources emit particulate matter (PM), volatile organic compounds (VOCs), carbon dioxide, and other gases that are easily inhaled and can have negative health consequences. Urban air pollution impacts a variety of implications on human health, ranging from eye irritation to mortality, according to studies conducted in North America and Western Europe [26]. Air pollution has both acute and chronic health impacts. It causes chronic respiratory and cardiac illness, as well as mild upper respiratory irritations. Lung cancer, acute respiratory infections in children, and chronic bronchitis in adults are all caused by air pollution, which can worsen pre-existing diseases including heart and lung disease, as well as asthma episodes. Pollution has also been connected to early death and a shorter life expectancy [27].
Some health impacts develop after repeated exposure to pollutants, whereas others appear quickly after air pollution exposure. These side effects are often obvious, such as nose, eye, and throat congestion, lightheadedness, and drowsiness. If the reason is discovered, these symptoms can be effectively addressed. However, if the origin of these side effects is not recognized and the patient is exposed to them again, they might intensify and develop into chronic conditions like asthma. Some characteristics, such as age, gender, and general health, can increase the health impacts of air pollution, with many contaminants impacting the elderly but not the younger. Some persons may be impacted even if there are no significant levels of air poll
The research was conducted at the University of Arizona - College of Architecture, Planning, and Landscape Architecture building in Tucson, Arizona (CAPLA). Tucson has been selected for this study since Tucson's summer season is hot and dry, with significant temperature variance (avg. 26°F) due to clear sky conditions. As a result, summer evenings spent outside are enjoyable, but it is not in the daytime. A brief description of Tucson climate; winters are mild (58.1°F on average), although huge diurnal temperature variations may result in a few cold winter evenings [15]. Throughout the year, temperatures normally vary from 42°F to 102°F, with temperatures seldom dropping below 33°F or going over 107°F. Throughout the year, the length of the day in Tucson varies drastically. December 21, with 10 hours and 2 minutes of daylight, will be the shortest day of the year, while June 20, with 14 hours and 16 minutes of sunshine, will be the longest. The dew point determines whether moisture evaporates from the skin and cools the body, and so determines the amount of humidity comfort. It feels dryer when the dew point is lower, and more humid when the dew point is higher. Because dew point changes more slowly than temperature, a humid day is frequently followed by a moist night, even if the temperature drops at night [31].
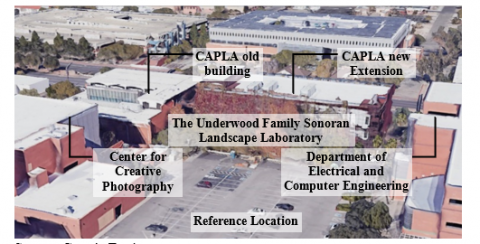
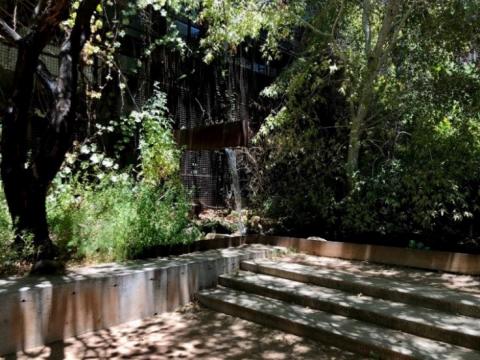
The study location is the Underwood Family Sonoran Landscape Laboratory (Figures 1 & 2). It is located on the south side of the architecture building, directly across from the parking lot. The lab serves as both an outdoor classroom and an entry plaza, demonstrating landscape as a high-performance integration of the structure and location. The project makes use of traditional low-cost arid land planning ideas such as water collection, water reuse, and desert microclimate mitigation. To serve as a benchmark for the two examined areas, a site weather reference location has been assigned (Figure 1), the adjacent parking lot to the Underwood Family Sonoran Landscape Laboratory.
Source: Google Earth
Figure 1. Aerial picture of the study location
Figure 2. The underwood family Sonoran landscape laboratory
The goal of this study is to use air properties to see how trees and water features impact human health and thermal comfort in microclimates. This study also aimed to investigate the uncontrollable factors that have a detrimental influence on human health and thermal comfort in the two microclimates that will be evaluated. CO2 and PM will be used to assess the air quality. As mentioned in the previous portion of this paper, a rise in these two components is harmful to human health. The ambient temperature and relative humidity will indicate human thermal comfort. Determining the appropriate level and the amount of either of the observed components is outside the scope of this study.
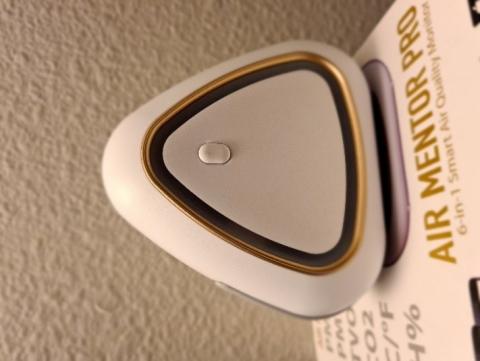
The Air Mentor Pro instrument (Figure 3) was used to measure four primary air components in the study. It comes with five sensors: 1- Particulate Matter (PM) sensor with detectable particle sizes greater than 1.0 m, a range of 0 to 300 g/m3, and a resolution of 1.0 g/m3. 2- Total Volatile Organic Compounds (TVOC)/Gas Pollution sensor with a range of 125 to 3500 PPB and a resolution of 1.0 PPB. 3- Non-dispersive Infrared Sensor (NDIR) with a range of 400 to 2000 PPM and a resolution of 1.0 PPM for carbon dioxide (CO2). 4- Ambient temperature sensor with a temperature range of -20℃ to 80℃ and a resolution of 0.1℃. 5- Humidity sensor with a range of 0 to 100 percent and a resolution of 1.0 percent. [Website of the Air Mentor]. The device was chosen for this research because it is compact, portable, has an internal battery, and can save data to the cloud.
Figure 3. The Air Mentor Pro instrument
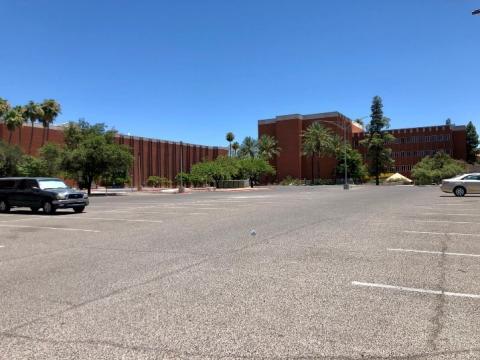
Figure 4. The monitor placement in the parking lot
Figure 5. The readings form the reference location
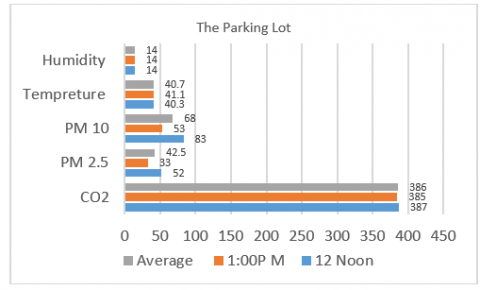
By dedicating field measurements in the noon and first hour of the afternoon, the research seeks to capture the peak summer conditions in this climate zone. On June 20th, 2020, at 12 p.m. and 1:00 p.m., field measurements were made. The monitor should be placed in the shadow to avoid the effects of direct sun radiation, which might raise the reading temperature and impair the analysis of the microclimate influence of trees and water features. The device uses a shield to protect the sensor from exposure to direct solar radiation. Placing the instrument in the shade is a precaution to ensure the validity of the results. For measurements reference, the monitor has placed in the middle of the parking lot (Figure 4). Figure 5 shows the weather data and air contaminants reading of parking lot at 12 noon, 1:00 PM, and the average.
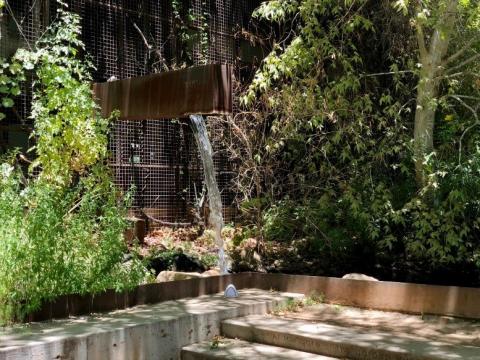
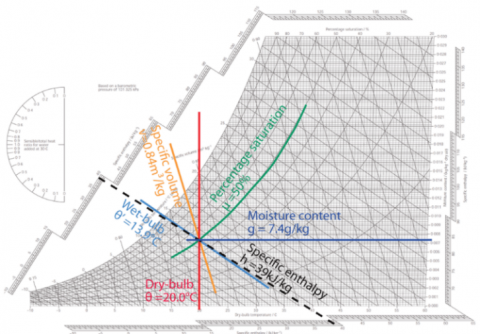
The equipment was set up at the research area on a sitting step near the waterfall, surrounded by trees (Figure 6). When compared to the average reading at the reference site, the measurement shows (Figure 7) a substantial reduction in temperature of 7.85℃, or roughly 19%, and a large rise in relative humidity of 15.5 percent. The decrease in temperature is attributed to a 110 percent increase in moisture content in the air compared to the reference measurement. As the psychrometric chart (Figure 8) reveals higher humidity in the air, the climatic plot will travel to the left of the graph along the blue line, eventually reaching a lower temperature than the starting position. The primary causes of the humidity increase in this senior are water evaporation and tree evapotranspiration.
Figure 6. Instrument’s location in the first location
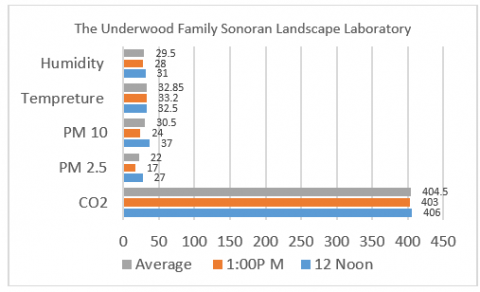
Figure 7. Measurement from the underwood family Sonoran landscape laboratory
In comparison to the parking lot, the air pollution parameters readings (Figure 7) demonstrate an uneven pattern. Photorespiration resulted in a 4.8% increase in CO2 above the baseline. The Calvin cycle, also known as the light-independent reactions, is CO2 atoms fixing mechanism in plants that integrates CO2 atoms into organic molecules and utilizes them to generate three-carbon sugars. Because they are not directly controlled by light, these reactions are sometimes known as light-independent reactions. CO2 enters the leaf through stomata and diffuses into the stroma of the chloroplast, where the Calvin cycle processes take place and sugar is generated. Rubisco, the Calvin cycle's carbon-fixing enzyme, starts this inefficient metabolic route by grabbing O2 instead of CO2. This route and plant type is referred to as C3. It consumes fixed carbon, emits CO2, and occurs when plants restrict their stomata (leaf pores) to conserve water. The combination of high temperatures and an excess of oxygen aggravates the situation.
C3 plants account for over 85% of all plant species on the globe. In addition to the field research done during the summer session, there were not many automobiles in the parking lot, as indicated in Figure 5, which had a significant effect in the CO2 level in the microclimate. In addition, as illustrated in Figure 5, a field investigation was performed during the summer session. The parking lot had a small number of automobiles, which had a substantial impact on the CO2 level in the microclimate. If the CO2 level in the parking lot was high, the CO2 level in the field study site may be lower since the C3 cycle would not be activated [32-34]. PM 2.5 and 10 levels were much lower in the study location because trees absorb PM [35]. When compared to the reference values, the average PM 2.5 has fallen by 50% and the average PM 10 has decreased by 55%.
Source: Carmel Software Corporation © 2022
Figure 8. Psychrometric chart illustration
The impacts of trees and water features on the microclimate in terms of human thermal comfort and the healthy environment were explored in this study. The effects of urban air pollution on human health are numerous, ranging from eye irritation to fatality. The microclimate was significantly influenced by the trees and water elements. The trees use the evapotranspiration phenomenon, whereas the water features use the evaporation phenomenon to impact the moisture content in the air. They have increased the relative humidity by 110% above the reference area. As a result, the temperature dropped by 19%. This tremendous microclimate improvement will shift most outdoor spaces into the human thermal comfort zone. The trees and water elements had a considerable influence on PM, with PM2.5 dropping by 50% and PM 10 declining by 55%. The C3 type Calvin cycle, on the other hand, resulted in a CO2 increase of 4.8 percent in this research. The trees have the opportunity to decrease CO2 in other seniors that have a greater CO2 concentration in the atmosphere, which decrease the chance of the C3 cycle activation. The power to reduce air pollutants while improving thermal conditions will result in a healthy and comfortable microclimate suitable for a variety of activities.
In future research, it would be beneficial to reproduce the study in a more polluted area to see how efficient the trees and water features are in such situations. It will also be significant to look at the impact on a bigger scale. It would be more enlightening if the climate station kept track of the condition for several days.
[1] Shashua-Bar, L., Hoffman, M.E. (2003). Geometry and orientation aspects in passive cooling of canyon streets with trees. Energy and Buildings, 35(1): 61-68. https://doi.org/10.1016/S0378-7788(02)00080-4
[2] Johansson, E. (2006). Influence of urban geometry on outdoor thermal comfort in a hot dry climate: A study in Fez, Morocco. Building and environment, 41(10): 1326-1338. https://doi.org/10.1016/j.buildenv.2005.05.022
[3] Lin, T.P., Matzarakis, A., Hwang, R.L. (2010). Shading effect on long-term outdoor thermal comfort. Building and Environment, 45(1): 213-221. https://doi.org/10.1016/j.buildenv.2009.06.002
[4] Thorsson, S., Lindqvist, M., Lindqvist, S. (2004). Thermal bioclimatic conditions and patterns of behaviour in an urban park in Göteborg, Sweden. International Journal of Biometeorology, 48(3): 149-156. https://doi.org/10.1007/s00484-003-0189-8
[5] Knez, I., Thorsson, S. (2008). Thermal, emotional and perceptual evaluations of a park: Cross-cultural and environmental attitude comparisons. Building and Environment, 43(9): 1483-1490. https://doi.org/10.1016/j.buildenv.2007.08.002
[6] Lin, T.P., Ho, Y.F., Huang, Y.S. (2007). Seasonal effect of pavement on outdoor thermal environments in subtropical Taiwan. Building and Environment, 4(12): 4124-4131. https://doi.org/10.1016/j.buildenv.2006.11.031
[7] Robitu, M., Musy, M., Inard, C., Groleau, D. (2006). Modeling the influence of vegetation and water pond on urban microclimate. Solar Energy, 80(4): 435-447. https://doi.org/10.1016/j.solener.2005.06.015
[8] Shashua-Bar, L., Hoffman, M.E. (2000). Vegetation as a climatic component in the design of an urban street: An empirical model for predicting the cooling effect of urban green areas with trees. Energy and Buildings, 31(3): 221-235. https://doi.org/10.1016/S0378-7788(99)00018-3
[9] Donovan, G.H., Butry, D.T. (2009). The value of shade: Estimating the effect of urban trees on summertime electricity use. Energy and Buildings, 41(6): 662-668. https://doi.org/10.1016/j.enbuild.2009.01.002
[10] Shashua-Bar, L., Hoffman, M.E., Tzamir, Y. (2006). Integrated thermal effects of generic built forms and vegetation on the UCL microclimate. Building and Environment, 41(3): 343-354. https://doi.org/10.1016/j.buildenv.2005.01.032
[11] Bourbia, F., Boucheriba, F. (2010). Impact of street design on urban microclimate for semi arid climate (Constantine). Renewable Energy, 35(2): 343-347. https://doi.org/10.1016/j.renene.2009.07.017
[12] Lin, T.P. (2009). Thermal perception, adaptation and attendance in a public square in hot and humid regions. Building and Environment, 44(10): 2017-2026. https://doi.org/10.1016/j.buildenv.2009.02.004
[13] Krüger, E.L., Minella, F.O., Rasia, F. (2011). Impact of urban geometry on outdoor thermal comfort and air quality from field measurements in Curitiba, Brazil. Building and Environment, 46(3): 621-634. https://doi.org/10.1016/j.buildenv.2010.09.006
[14] Chudnovsky, A., Ben-Dor, E., Saaroni, H. (2004). Diurnal thermal behavior of selected urban objects using remote sensing measurements. Energy and Buildings, 36(11): 1063-1074. https://doi.org/10.1016/j.enbuild.2004.01.052
[15] Matsuoka, R.H., Kaplan, R. (2008). People needs in the urban landscape: analysis of landscape and urban planning contributions. Landscape and Urban Planning, 84(1): 7-19. https://doi.org/10.1016/j.landurbplan.2007.09.009
[16] Picot, X. (2004). Thermal comfort in urban spaces: impact of vegetation growth: Case study: Piazza della Scienza, Milan, Italy. Energy and buildings, 36(4): 329-334. https://doi.org/10.1016/j.enbuild.2004.01.044
[17] Ng, E. (2009). Policies and technical guidelines for urban planning of high-density cities-air ventilation assessment (AVA) of Hong Kong. Building and Environment, 44(7): 1478-1488. https://doi.org/10.1016/j.buildenv.2008.06.013
[18] Taha, H., Douglas, S., Haney, J. (1997). Mesoscale meteorological and air quality impacts of increased urban albedo and vegetation. Energy and Buildings, 25(2): 169-177. https://doi.org/10.1016/S0378-7788(96)01006-7
[19] Fahmy, M., Sharples, S., Yahiya, M. (2010). LAI based trees selection for mid latitude urban developments: A microclimatic study in Cairo, Egypt. Building and Environment, 45(2): 345-357. https://doi.org/10.1016/j.buildenv.2009.06.014
[20] Nahar, N.M., Sharma, P., Purohit, M.M. (2003). Performance of different passive techniques for cooling of buildings in arid regions. Building and Environment, 38(1): 109-116. https://doi.org/10.1016/S0360-1323(02)00029-X
[21] Akbari, H., Pomerantz, M., Taha, H. (2001). Cool surfaces and shade trees to reduce energy use and improve air quality in urban areas. Solar energy, 70(3): 295-310. https://doi.org/10.1016/S0038-092X(00)00089-X
[22] Givoni, B. (1991). Impact of planted areas on urban environmental quality: A review. Atmospheric Environment. Part B. Urban Atmosphere, 25(3): 289-299. https://doi.org/10.1016/0957-1272(91)90001-U
[23] Nishimura, N., Nomura, T., Iyota, H., Kimoto, S. (1998). Novel water facilities for creation of comfortable urban micrometeorology. Solar Energy, 64(4-6): 197-207. https://doi.org/10.1016/S0038-092X(98)00116-9
[24] Ghiabaklou, Z. (2003). Thermal comfort prediction for a new passive cooling system. Building and Environment, 38(7): 883-891. https://doi.org/10.1016/S0360-1323(03)00028-3
[25] Brombreg, P.A. (1999). Air Pollution and Health. Academic Press, USA.
[26] Ezzati, M., Lopez, A.D., Rodgers, A.A., Murray, C.J. (2004). Comparative quantification of health risks: global and regional burden of disease attributable to selected major risk factors. World Health Organization.
[27] Kampa, M., Castanas, E. (2008). Human health effects of air pollution. Environmental Pollution, 151(2): 362-367. https://doi.org/10.1016/j.envpol.2007.06.012
[28] O. US EPA. Basic Information about Carbon Monoxide (CO) Outdoor Air Pollution. Jul. 13, 2016. https://www.epa.gov/co-pollution/basic-information-about-carbon-monoxide-co-outdoor-air-pollution, accessed on Jan. 11, 2022.
[29] O. US EPA. Particulate Matter (PM) Basics. Apr. 19, 2016. https://www.epa.gov/pm-pollution/particulate-matter-pm-basics, accessed on Jan. 11, 2022.
[30] Fenger, J. (1999). Urban air quality. Atmospheric Environment, 33(29): 4877-4900. https://doi.org/10.1016/S1352-2310(99)00290-3
[31] Arizona, United States. Tucson climate, weather by month, average temperature - weather spark. https://weatherspark.com/y/2857/Average-Weather-in-Tucson-Arizona-United-States-Year-Round, accessed on Jan. 11, 2022.
[32] Ehlers, I., Augusti, A., Betson, T.R., Nilsson, M.B., Marshall, J.D., Schleucher, J. (2015). Detecting long-term metabolic shifts using isotopomers: CO2-driven suppression of photorespiration in C3 plants over the 20th century. Proceedings of the National Academy of Sciences, 112(51): 15585-15590. https://doi.org/10.1073/pnas.1504493112
[33] Huma, B., Kundu, S., Poolman, M.G., Kruger, N.J., Fell, D.A. (2018). Stoichiometric analysis of the energetics and metabolic impact of photorespiration in C3 plants. The Plant Journal, 96(6): 1228-1241. https://doi.org/10.1111/tpj.14105
[34] Kennedy, R.A. (1976). Photorespiration in C3 and C4 plant tissue cultures: significance of Kranz anatomy to low photorespiration in C4 plants. Plant Physiology, 58(4): 573-575. https://doi.org/10.1104/pp.58.4.573
[35] Letter, C., Jäger, G. (2020). Simulating the potential of trees to reduce particulate matter pollution in urban areas throughout the year. Environment, Development and Sustainability, 22(5): 4311-4321. https://doi.org/10.1007/s10668-019-00385-6