Dahlan Tampubolon* | Muhammad Irsan | Harlen | Mardiana | Tito Handoko
© 2022 IIETA. This article is published by IIETA and is licensed under the CC BY 4.0 license (http://creativecommons.org/licenses/by/4.0/).
OPEN ACCESS
The desire to get a natural life, away from pollution, and comfortable with guaranteed utilities and facilities is why people choose housing in the city's hinterland. This study aims to analyze the determinants of spatial mobility preferences and to live in the city's hinterland. The research method used was a survey with 400 respondents from Rimbo Panjang and Karya Indah village in Kampar City. They have carried out spatial mobility and resided for the last five years. Data was collected through questionnaires and direct interviews, which were analyzed using a Likert scale questionnaire. Furthermore, SEM analysis was carried out using AMOS and SPSS software. The study results showed that three dependent and one intervening variable significantly influence the preferences of spatial mobility and living variables with a probability value below 5%. Only the residential environment variable (x1) with a score of 0.050 means it is not significant with a probability value (5%). Adjusted R Square value of 0.625 shows that the variation of the independent variables affects variations in spatial mobility preferences and resides by 62.5%. The frequency distribution of respondents' answers shows that all independent and dependent variables are in a good category. The research findings will be more diverse with the use of other methods and samples that represent the social mobility preferences of people in Indonesia. This study begins with a wide range of topics from the city center to the suburbs. The limitation of this study is that it does not distinguish whether they are from Pekanbaru City or other areas. Future research that could utilize longitudinal data could pursue a more significant measure of the relationship between regions in the study of mobility and settlement preferences.
spatial, mobility, living, hinterland, accessibility
Limited land and the increasingly dense center of Pekanbaru City make the hinterland area an alternative solution to settlement problems. According to Daldjoeni, urban physical changes outward grow new areas or what is often referred to as hinterland areas [1]. In addition, the hinterland area of the city has its charm, which is that it offers more comprehensive housing. Burgess explains that housing development starts from the spatial mobility of residents to the city center and then naturally spreads to the city's hinterland [2]. Spatial mobility is the movement of people to different locations, related to physical movement from one space to another [3].
One factor that encourages population movement for spatial mobility and settling in the city's hinterland is the desire to get a natural life, far from pollution, and comfortable with guaranteed utilities and facilities [4]. Everyone tends to choose housing in the hinterland of the city. The tendency to choose to stay or not is often referred to as preference. Drabkin explains that accessibility factors can influence living preferences in residential housing [5]. Accessibility factors include the ease of reaching locations using transportation, environmental conditions related to the state of the physical and social environment, ease of reaching the workplace, and the level of service that the community can reach in terms of facilities and infrastructure. The factors are ease of reaching locations using transportation means, environmental conditions related to physical and social environmental conditions, ease of reaching the workplace, and the level of service that the community can reach in terms of facilities and infrastructure [6].
As the Capital City of Riau Province, Pekanbaru City is experiencing urban growth and urbanization. Before 1960, the area of Pekanbaru city was only 16 km2, and then since the relocation of the capital city, it has increased to 62.96 km2 with two sub-districts. Furthermore, in 1965 it increased to 6 sub-districts, and in 1987 it became eight sub-districts with an area of 446.50 km2. In 2003 the number increased to 12 sub-districts with an area of 632.26 km2. From the latest data in 2020, the total sub-districts in Pekanbaru are 15 sub-districts. Urban development cannot keep pace with the number of people moving to the area. In urban centers, adequate housing is not affordable. As a result, certain population groups settle in suburban areas, where more homes are available at lower prices. This choice of location has direct consequences on mobility behavior [7].
The development was influenced by the migrants who moved to the center of Pekanbaru City during the 1960-2000 decade. It causes the Pekanbaru people's residence to switch to the hinterland naturally. Since 2014, the population of Pekanbaru City has reached more than one million people, making the city a metropolitan city. The population density can reduce comfort resulting in a preference for the direction of spatial mobility and living from the city center to the hinterland of Pekanbaru City.
Meanwhile, the number of building permits (IMB) for Simple Healthy Homes (RSH) or Simple Homes (RS) issued by the Kampar regional government in 2017-2019 dominates in the sub-districts that are directly adjacent to Pekanbaru City. The total IMB issued by the Department of Housing and Settlements in the Kampar Regency was 30,063. Of the number of housing permits with IMB, 27,297 units (93.92%) are located in three sub-districts, namely Tambang, Tapung, and Siak Hulu, which are directly adjacent to Pekanbaru City. The growth of housing and settlements in the hinterland will undoubtedly affect the community's attractiveness to choosing residential housing in the hinterland of Pekanbaru City.
The shift in the tendency of spatial mobility and living from downtown Pekanbaru to the city outskirts cannot be separated from the influence of development on the city's outskirts. The city's increasingly expensive land price is one reason people are starting to look for affordable housing in the hinterland areas. Centers for providing employment opportunities such as industry and warehousing have also developed in the hinterland of Pekanbaru city. It is all supported by the availability of infrastructure for transportation, communication, and city facilities that have reached all locations. If the above factors have been assessed, then the relatively lower land price, the ease of housing credit facilities, and expectations and speculations on the development of urban areas in the hinterland will also influence the preferences of spatial mobility and people's settlements.
Data on the flow of lifetime spatial mobility in 2015 shows the population of Pekanbaru City is 1,035,834 people. The population born in Pekanbaru City was 527,634 people (50.96%), while the immigrant population born outside Pekanbaru City was 508,200 (49.06%). Besides a large number of incoming spatial mobility, it turns out that the spatial mobility out of Pekanbaru City is also quite large, namely 192,498 people. This lift affected the Net spatial mobility of 315,702 people in 2015 [8]. The high outward spatial mobility impacts increasing the population in Kampar Regency. Recent spatial mobility data in Kampar Regency shows that the number of incoming migrants is 40,885. Most of these migrants came from Pekanbaru City, among cities in Riau Province, 7,130 people (17.44%).
The explanation above shows that the urbanization pattern in Pekanbaru City leads to two general trends: Pekanbaru City is still a destination for spatial mobility with population growth from 2010-to 2018 of 2.70%. On a regional scale, there is an inverse trend, namely the mobility tendency. Spatial layers of society who have worked permanently choose spatial mobility and live in the city's hinterland, including outside the administrative boundaries of Pekanbaru City. When this phenomenon continues, some people look at the development of the concentration of economic activity in the future, which will shift to the city's hinterland. It causes the city of Pekanbaru to grow while the sub-urbanization process continues with a distribution pattern that is increasingly dispersed spatially.
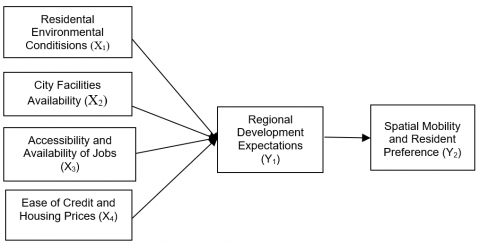
From these conditions, there is an assumption that the preference for spatial mobility and living in the community in choosing urban hinterland housing is influenced by several factors. These factors include residential environmental conditions, availability of city facilities, accessibility, and availability of employment opportunities, ease of credit and housing prices, and expectations of regional development. Thus, this study will analyze the spatial mobility preferences of the population and choose to live in housing in the hinterland of the city. Also, to examine the conditions of settlement, availability of city facilities, accessibility, and availability of employment opportunities, ease of credit, and housing prices as determinants of spatial mobility preferences and living in the urban hinterland with regional development expectations as an intervening variable".
Preference refers to the relative attractiveness of an object, whereas preference refers to actual behavior. Preference, as an expression of attractiveness, can guide a choice, but the evaluation involved in preference can occur whether a choice should be made or not [9].
Preference in living is a person's tendency to live or not in a place [10, 11]. Preferences for living will continually develop according to behavior dynamics, changes in the area, and a person's social and economic conditions. These conditions can impact changes in the elements of the environment where they live, such as facilities, services, accessibility, spatial housing patterns, to expectations for the development of the area around their settlements. Preference is one behavioral study that has benefits in explaining and predicting human behavior in everyday life [12, 13]. The researcher defines residence preference as the attractiveness of residing in one area or not because of the settled social, economic, and environmental conditions.
Mantra et al. revealed that a person performs spatial mobility due to needing and pressure (need and stress) [14]. Every individual has needs that need to be met [15]. These needs can be in the form of economic, social, political, and psychological needs. Population spatial mobility is the movement of residents from one area to another within a certain period. Regional boundaries generally used in Indonesia are administrative boundaries such as provinces, districts/cities, sub-districts, and villages. Several other theories explain the concepts and factors that cause people to carry out spatial mobility, including the following.
Todaro's Theory of Spatial Mobility. Todaro explains that a person will decide whether to have spatial mobility or not, depending on the present value of the income derived from spatial mobility [13]. Fassmann and Meusburger (1997), describe a spatial model, in which high gross domestic product and high average wages are the main characteristics of people doing regional mobility [14]. The regional economic qualification structure, shows an increase in the concentration of local human resources which generally leads to an increase in regional employment options [16].
Hansen's model is based on the assumption that the accessibility of job opportunities is the main factor that determines the population growth of a location. Hansen states that the relationship between the location population and employment opportunities can be expressed in an accessibility index, which defines each zone as having accessibility to employment opportunities [17].
Lee explained that the spatial mobility level of the population in an area develops according to the diversity level in areas within the region [18, 19]. Spatial mobility of the population, in general, can occur if there are differences in the value of benefits between the two regions [20]. The volume of spatial mobility of a region develops according to regional diversity. In the origin and destination areas, there are positive (+) and negative (-) factors, and there are also neutral factors (0) (Figure 1).
Figure 1. Framework for spatial mobility preferences and living in hinterland cities
Yunus argues that from time to time, in line with the increase in the number of urban residents and the demands of life, the activities of the urban population will also increase, which increases the need for large urban spaces [21]. It is contrary to the availability of space in the city which is fixed and limited. There is a natural choice of alternatives in meeting the need for space for residence, and the position of functions will take up space in the hinterland areas of the city.
Porteus explains that residence preference means a person's tendency to decide to live or not, and usually, preferences between individuals vary depending on the factors causing it [22]. Some experts argue that people consider when choosing a place to live are housing prices, facilities, accessibility [6, 22-24], ease of transportation, proximity to the city center [25], service, and convenience [26, 27].
Of the many factors that influence spatial mobility and living preferences, the factors used as research variables are divided into three types: dependent, intervening, and independent. Variable measurement is obtained through the calculation of scores in each indicator of each variable. The following is a model of the framework of thought in this research.
This study uses a quantitative approach that explains and describes the conditions of each variable in detail and looks at the relationship or relationship between variables [28, 29]. In the context of the research, it is known that the independent variables are housing conditions (x1), city and transportation facilities (x2), accessibility to the workplace (x3), price, and ease of housing credit (x4). Regional development expectations (y1) are intervening variables, while the dependent variable is spatial mobility and living preferences (y2).
Definition of each variable, the target variable, and the assessment indicators are made in tabular form to direct the ease of making measuring the score of each variable (Table 1).
Table 1. Operational variables
|
Variable |
Indicator |
|
Residential Environmental Conditions (X1) |
Residential Environmental Conditions are residential environmental conditions that are taken into consideration for a person to carry out migration and settle activities, in terms of socio-economic conditions such as:
|
|
Availability of City Facilities (X2)
|
Availability of City Facilities is a means of public service facilities available to support the welfare of a person's life, in terms of socio-economic, which is associated with residential areas such as Availability of Facilities:
|
|
Accessibility and Availability of Job Opportunities (X3) |
Accessibility and availability of jobs are distance, travel time, daily expenses for routines to the main workplace, and the quality of current work and available job vacancies in the vicinity of the currently occupied housing. |
|
Ease of Credit and Housing Prices (X4) |
The ease of credit and housing prices are the population's perception of the ease of credit, relief on down payments, relief of credit requirements, and affordability of housing prices in terms of the social and economic status of the population. |
|
Expectations and regional development (Intervening) (Y1) |
Expectations and regional developments are perceptions and hopes for the future regarding:
|
|
Spatial mobility preference and resident (Y2) |
Preference for spatial mobility and residing in is the level of preference of a person to mobility and decide to live or not in the area, such as an assessment of settlement conditions, including:
|
Participants in the study amounted to 400 residents of Rimbo Panjang village, Tambang district and Karya Indah village, Tapung district, Kampar district. Those involved have carried out spatial mobility and resided in the sample area for the last five years. This research was conducted for five months, from August to December 2020.
Sources of data in this study came from primary and secondary data. Primary data in the form of questionnaire items to determine public perceptions about housing selection in the hinterland. Meanwhile, secondary data is taken from government agencies that issue the required data and information, such as the Central Statistics Agency (BPS), the Public Works Agency, and other agencies directly or through web pages (websites). Before the actual data collection activities, a pilot test of the questionnaire on subjects with the same characteristics as the research sample. Instrument testing to determine the level of validity and reliability of these instruments to retrieve the required data. Testing the instruments in this study was done by testing the instruments' validity and reliability. Testing of instruments to obtain instruments that have validity and reliability following the provisions so that they can be used to collect data needed to answer the problems that have been formulated.
Data analysis was carried out through several stages, one of which was the hypothesis testing stage. Hypothesis testing is processed using SEM (Structural Equation Modeling) with the AMOS 24 program. SEM is a statistical technique that can analyze relationships between latent constructs and their indicators, latent constructs with each other, and direct measurement errors. SEM allows analysis between several dependent and independent variables directly [30]. The next stage is the Coefficient of Determination Test (R2). The coefficient of determination is data to find out how significant the percentage of the direct influence of the independent variable, which is getting closer to the dependent variable, or it can be said that the use of the model can be justified. A value can be obtained from this coefficient of determination (R2) to measure the magnitude of the relationship between variables X to Y. The criteria for analyzing the coefficient of determination (Kd) are (a) If Kd is close to zero (0), it means that the influence between the independent variables on the dependent variable is weak. (b) if Kd is close to one (1), the influence between the independent variables on the dependent variable is strong.
The model developed in this research is based on a literature review from various sources of previous research. This model generally consists of 4 independent variables (exogenous), 1 (one) intervening variable, and 1 (one) dependent variable (endogenous). The four independent variables are settlement environmental conditions (X1), city facilities availability (X2), accessibility and availability of jobs (X3), ease of credit and housing prices (X4), intervening variables are regional development expectations (Y1), and the dependent variable is the preference of spatial mobility and reside (Y2). The six construct variables are formed from 36 manifest variables or more commonly referred to as indicators. The built research model using an analytical technique, namely Structural Equation Modeling (SEM) analysis, starting from the input data from the research questionnaire recapitulation and then processed. As in the dependency model for multivariate data analysis in general, several assumptions must be met in the Structural Equation Modeling (SEM) analysis, including validity and reliability.
4.1 Validity and reliability test results
The validity test measures whether the research instrument could measure the constructs used emphasizing strengthening the contents of the questionnaire to obtain the validity of the questionnaire [31]. The validity shows how the differences obtained by measuring instruments reflect fundamental differences in the respondents studied [32]. The validity test results show a good level of acceptance, where the factor loading value of each indicator is above 0.05. Therefore, these indicators are the underlying dimension for each construct (valid). In contrast, the reliability test results show a good level of acceptance, where each variable gets a reliability value above 0.7 and a variance extract above 0.05. The reliability test is intended to determine the level of consistency of the instruments that measure the concept. Reliability is a requirement for achieving the validity of a questionnaire with a specific purpose. It shows that each construct has a good confidence level in the measurement (reliable). The following Table 2 are the results of the research instrument reliability test.
Table 2. Reliability test results
|
Variable |
Construct Reliability (CR) |
Variance Extract (VE) |
|
X1 |
0.910 |
0.630 |
|
X2 |
0.937 |
0.683 |
|
X3 |
0.925 |
0.674 |
|
X4 |
0.908 |
0.622 |
|
Y1 |
0.888 |
0.569 |
|
Y2 |
0.861 |
0.558 |
Source: AMOS processed results
4.2 Interpretation of research results and hypothesis testing
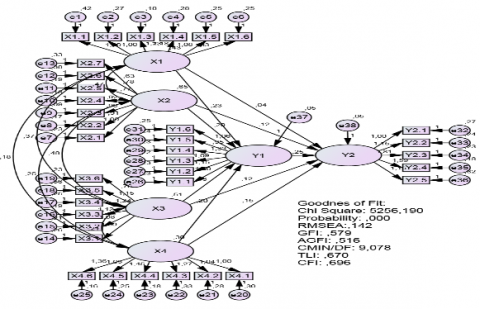
The interpretation of the research model is a statistical discussion of the results obtained from the software used. The aim is to answer the research problem posed. The interpretation of the results in this study is based on the output of the Amos program. The final result of SEM Full Model Estimation to see the model's suitability and the causality relationship built in the model can be seen in the following Figure 2.
Note: X1=Residential Environmental Conditions; X2=City Facilities Availability; X3=Accessibility and Availability of Jobs; X4=Ease of Credit and Housing Prices; Y1=Regional Development Expectations; Y2=Spatial Mobility and Resident Preference.
Figure 2. Analysis SEM full model
Hypothesis testing can be done based on the SEM analysis and the estimated value in the picture above. The value of the direct influence between variables can also be seen in the following Table 3.
The total effect of independent variables on spatial mobility preferences and living through the expectation of regional development in the hinterland of Pekanbaru City is the sum of the direct plus indirect effects. The results of the From the table above, it can be estimated that the effect of residential environmental conditions (X1), availability of city facilities (X2), accessibility and availability of employment (X3), and ease of credit and housing prices (X4) on regional development expectations (Y1). Multiple linear regression SEM approaches with the estimated regression model as below:
Y1=0.234 X1+0.201 X2+0.128 X3+0.195 X4
To analyze the effect of residential environmental conditions (X1), availability of city facilities (X2), accessibility and availability of employment (X3), and ease of credit and housing prices (X4), on the preference of spatial mobility preferences and residing (Y2) with the expectation of regional development. (Y1) as the intervening variable and used multiple linear regression model SEM approach with the estimated regression model as below:
Y2=0.040 X1+0.115 X2+0.122 X3+0.151 X4+0.245 Y1
The factors that influence the preference for spatial mobility and living in Pekanbaru City's suburbs are essential, so each variable has a different effect. The model interpretation discusses the total effect of each independent variable in this study on preferences for spatial and resident mobility with the hope of regional development as an intervening variable. The total effect of independent variables on migration and settlement preferences through the expectation of regional development as an intervening variable in the suburbs of Pekanbaru City is the sum of the direct and indirect effects.
The total effect of independent variables on spatial mobility preferences and reside through the expectation of regional development in the suburbs of Pekanbaru City is the sum of the direct plus indirect effects. The results of the calculation of the indirect plus indirect effect are the total effect between variables shown in the following Table 4.
Based on the table above, the interpretation of the total influence between variables can be seen in the following Table 5.
Table 3. Partial hypothesis testing results
|
Hypothesis |
Estimate |
S.E. |
C.R. |
P |
Decision |
||
|
Y1 |
<--- |
X1 |
.234 |
.062 |
3.750 |
*** |
Significant |
|
Y1 |
<--- |
X2 |
.201 |
.055 |
3.618 |
*** |
Significant |
|
Y1 |
<--- |
X3 |
.128 |
.046 |
2.805 |
.005 |
Significant |
|
Y1 |
<--- |
X4 |
.195 |
.038 |
5.161 |
*** |
Significant |
|
Y2 |
<--- |
X1 |
.040 |
.061 |
.665 |
.506 |
Not Significant |
|
Y2 |
<--- |
X2 |
.115 |
.054 |
2.117 |
.034 |
Significant |
|
Y2 |
<--- |
X3 |
.122 |
.045 |
2.725 |
.006 |
Significant |
|
Y2 |
<--- |
X4 |
.151 |
.039 |
3.849 |
*** |
Significant |
|
Y2 |
<--- |
Y1 |
.245 |
.084 |
2.919 |
.004 |
Significant |
Table 4. The conclusion of hypothesis testing
|
Relationship between variables |
The Effect |
|||
|
Direct |
Intervening |
Indirect |
Total |
|
|
1 |
2 |
3 |
4=(2x3) |
5=(2+4) |
|
Y2 <---- X1 |
0.040 |
0.245 |
0.010 |
0.050 |
|
Y2 <---- X2 |
0.201 |
0.245 |
0.049 |
0.250 |
|
Y2 <---- X3 |
0.122 |
0.245 |
0.030 |
0.152 |
|
Y2 <---- X4 |
0.151 |
0.245 |
0.037 |
0.188 |
|
Y2 <---- Y1 |
0.245 |
- |
- |
0.245 |
Table 5. The conclusion of research hypothesis and total effect value of variables
|
Variable |
Hypothesis |
Effect Value |
|
X1 |
Residential environmental conditions positively affect preferences for spatial mobility and living, with the expectation of regional development as an intervening variable. |
0.050 |
|
X2 |
The availability of city facilities positively affects preferences for spatial mobility and living, with the expectation of regional development as an intervening variable. |
0.250 |
|
X3 |
Accessibility and availability of employment positively affect preferences for spatial mobility and living, with the expectation of regional development as an intervening variable. |
0.152 |
|
X4 |
Ease of credit and housing prices positively affect spatial mobility and living preferences, with expectations of regional development as an intervening variable. |
0.188 |
|
Y1 |
Regional development expectations have a positive effect on spatial mobility and living preferences. |
0.254 |
Table 6. Testing R2 results
|
Model |
R |
R Square |
Adjusted R Square |
Std Error of the Estimate |
|
1 |
.794a |
.630 |
.625 |
1.88870 |
Source: SPSS 23.0 processed results
Based on Table 6 above, the Adjusted R Square value is 0.625. In Table 5, that is, variations in residential environmental conditions (X1), availability of city facilities (X2), accessibility and employment opportunities (X3), ease of credit and housing prices (X4), as well as expectations and regional development (Y1), affect variations in spatial mobility preferences and live (Y2), amounting to 62.5%. From these results, other independent variables are not included in the model and influence preferences for spatial mobility and living (Y2) of 37.5%. The significant score can be seen in Table 7.
Table 7. The Significant Score
|
Model |
Sum of Squares |
Df |
Mean Square |
F |
Sig |
|
Regression Residual Total |
2394.772 1405.468 3800.240 |
5 304 399 |
478.954 3.567 |
134.267 |
.000 |
Source: SPSS 23.0 processed results
The significance level is 5% shows that there is an influence between variations in residential environmental conditions (X1), availability of city facilities (X2), accessibility and employment opportunities (X3), ease of credit and housing prices (X4), expectations and regional development (Y1), jointly influencing variations in spatial mobility preferences and living (Y2) in the hinterland of Pekanbaru City. Meanwhile, the magnitude of the total influence of the independent variables on the spatial mobility preference variable and living with the expectation of regional development is explained in the following paragraph.
Hypothesis 1 is that the condition of the residential environment has a positive effect on preferences for spatial mobility and living, with the expectation of regional development as an intervening variable. Data processing results obtained a CR value of 0.665 with a probability of 0.506. Both values are not eligible for hypothesis acceptance because the CR value (0.665) is smaller than 1.96 and the probability (0.506) is more significant than 0.05. Thus, it can be concluded that housing conditions do not significantly affect spatial mobility and living preferences. It can be seen that most people, even though they already have a house with good residential environmental conditions, have low satisfaction with living due to being far from their place of work. The coefficient value shows the number 0.050, which means that each increase in perception of residential environmental conditions by 1 unit with regional development expectations will increase perceptions of spatial mobility preferences and living in the hinterland of Pekanbaru City (by 0.050). Vice versa assuming other variables are constant. On the other hand, even though the environmental conditions of their settlements are not good, most people are highly satisfied with living because they have been renting a house for a long time and want their own house.
Hypothesis 2, the availability of city facilities positively affects preferences for spatial mobility and living, with the expectation of regional development as an intervening variable. This second hypothesis is acceptable and significant because it follows various existing theories. The coefficient value of 0.250 means that each increase in perception of the availability of city facilities by 1 unit will increase the perception of spatial mobility and living preferences by 0.250 and vice versa, assuming other variables are constant.
The availability of city facilities is a variable that is considered the most influential when compared to other variables. Conditions in Rimbo Panjang and Karya Indah villages show the community's preference for living in these areas with the availability of major infrastructures such as educational facilities, shopping, health, and others. Of course, this is a means of settlement with a significant need to support daily activities. Because of the close distance to Pekanbaru city, residents in the hinterland of this city also take advantage of the city facilities provided in the Pekanbaru area. Research by Hermawan shows that the construction of economic facilities and infrastructure has a strong influence because the average community has a high interest in a residential area that has developed economic activities to support the sustainability of life and the area itself in the future [33].
Hypothesis 3, accessibility and availability of employment positively affect preferences for spatial mobility and living, with the expectation of regional development as an intervening variable. This third hypothesis is acceptable and significant because it follows various existing theories. The coefficient of the effect of total accessibility and employment availability is 0.152, which means that each increase in perceptions of accessibility and availability of employment is 1 unit. It will increase perceptions of spatial mobility preferences and reside by 0.152 and vice versa; other variables are constant. Accessibility, strategic location, and the growing development of offices in the hinterland of Pekanbaru City have also increased expectations of regional development and preferences for spatial mobility and living in the sample area. It can be seen in the growth of settlements and shophouses along the protocol road in the Rimbo Panjang and Karya Indah sample villages. The relocation of the Sultan Syarif Kasim State Islamic University (UIN Suska) Riau campus, which is on the Pekanbaru–Kampar boundary, dramatically affects the city's growth and settlements in the village of Rimbo Panjang. Many employees and lecturers of UIN Suska Riau choose spatial mobility and live in Rimbo Panjang village because it is very close to their place of work. A close distance will save transportation costs and travel time from home to work. It is in line with the opinion of Todaro that economic factors are the motives that are most often used as the main reason for spatial mobility [34]. People will choose to live and live in locations around their place of work.
Hypothesis 4, the ease of credit and housing prices positively affect preferences for spatial mobility and living, with the expectation of regional development as an intervening variable. This fourth hypothesis is acceptable and significant because it follows various existing theories. The coefficient of total effect in credit ease and housing prices is 0.188. Each increase in perceptions of credit convenience and housing prices by 1 unit will increase perceptions of spatial mobility and living preferences by 0.188 with the expectation of regional development and vice versa, assuming other variables are constant. The affordability of housing prices and the ease of credit application requirements are components of housing units. They are one of the reasons why people choose housing as their preference for living. Most of the respondents stated that the affordability of housing prices and the ease of terms in the credit process were important reasons for deciding to live in Rimbo Panjang and Karya Indah villages. In making decisions related to settlements, people will always compare prices or costs needed in the process of living. The house price is the essential choice considering the ability of the community to own a house (purchasing power) in determining their living preferences. Following research, Syafrina et al. explained that the cost factor, namely house prices (purchasing power) related to affordable housing installments for people of middle and lower economic levels, influenced the selection and preference for living [11]. From this, economic factors can be a determining factor in deciding the choice of housing. The house price is the most important consideration. The price of land and houses in the hinterland area of the city is relatively low compared to the center of Pekanbaru City.
Hypothesis 5, Expectations and Regional Development positively affect spatial mobility and living preferences, with regional expectations as an intervening variable. This fourth hypothesis is acceptable and significant because it follows various existing theories. Expectations and regional development significantly affect preferences for spatial mobility and living. The coefficient value of 0.245 means that each increase in perception of expectations and regional development by 1 unit will increase the perception of spatial mobility and living preferences by 0.245 and vice versa, assuming other variables are constant. Regional development expectations significantly influence spatial mobility preferences and living in the sample area compared to other variables. The rapid growth of cities in these two villages has further increased expectations for regional development in the city's hinterland, especially after the relocation of the Suska Riau UIN campus, Riau Police SPN, and several companies. Residents also believe several companies/warehousing will continue to be relocated from the city center to the city's hinterland like other metropolitan cities developed first. Residents also believe this area will continue to grow and develop quickly into an urban area, along with city facilities, education, shopping, health, and others. Respondents also have high expectations for regional development in the city's hinterland and the opening of toll gate access around Rimbo Panjang village. Many residents in these two villages expect their territory to be included in expanding the administrative area of Pekanbaru City.
In general, the preference for spatial mobility and living in the sample housing villages in the hinterland of Pekanbaru city feels at home and does not want to move. In general, respondents are pleased to live in this area, there are no plans to move, and if they move, they will choose the atmosphere and conditions like in this area, still around the village area, will recommend friends, officemates, and relatives who want to move to this area. Occupants tend to express high satisfaction with their homes because most houses have been renovated to be comfortable for families. People in general also tend to express relatively high satisfaction with the quality of the environment in which they live. The close relationship between neighbors also increases their satisfaction in living. In addition, the existence of various facilities such as mosques, markets, schools, and hospitals close to their homes makes them more comfortable living in the area. People who are satisfied with their homes and environment make their intention to move and plans to move low.
People prefer not to move because their financial condition is minimal, so it is impossible to buy a new house inflated and unaffordable. Thus, the lower-middle-class people prefer to survive makeshift housing conditions and gradually renovate if the household economy develops. Only households with high incomes have the intention and plan to move. On average, they want to move house closer to where they work, more complete city facilities, a more comprehensive house, and a more exclusive environment in Pekanbaru City.
In addition to the various variables above, this study also found other variables, namely personal factors, social status, education level, and income, which greatly influenced spatial mobility preferences and living in the hinterland of Pekanbaru City. The coefficient of determination is data to find out how significant the percentage of direct influence of the independent variable with the dependent variable, or it can be said that the use of the model can be justified. The magnitude of this coefficient of determination is 0 to 1.
Based on the study results, all independent variables such as residential environmental conditions, availability of city facilities, accessibility and employment opportunities, ease of credit and housing prices, and expectations of regional development in the hinterland area significantly affect variations in spatial mobility preferences and live in housing in the hinterland of Pekanbaru City. Meanwhile, the significant factors influencing spatial mobility preferences and living in housing in the hinterland sample villages of Pekanbaru City with the expectation of regional development as an intervening variable, respectively, are the availability of city facilities, expectations and regional development, ease of credit and housing prices, then accessibility and field availability work. The availability of city facilities is the most significant factor in influencing spatial mobility preferences and community housing. The proximity to Pekanbaru City allows residents living in hinterland villages near the Kampar Regency to take advantage of the more complete city facilities available in Pekanbaru City.
Studies have rarely discussed the shift in settlements from the urban center to the suburban. This phenomenon will become a trend in the study of regional planning and population mobility. Some limitations of this study should be acknowledged. First, the analysis of residents in suburban communities does not distinguish whether they are from Pekanbaru City or other areas. Future studies may include elements of the origin of the settlers. Second, the study collects data on personal preferences regarding the choice of housing location. The analysis and discussion focus only on spatial mobility. Problems with internal mobility preferences need to be observed in future research. Third, the findings in this study reveal the relationship between regional development expectations and preferences. This study did not examine causal mechanisms for this relationship. Future research with longitudinal data could pursue greater complexity in the relationship between the region and spatial mobility and settlement preferences.
We are grateful to Riau University, which has given us the grant to do this research. We are also thankful to all parties who have shared their experiences with us.
[1] Daldjoeni, N. (1998). City and Village Geography. Bandung: ITB Publisher Alumni. https://lib.ui.ac.id/detail?id=25895.
[2] Burgess, E.W. (1928). Residential segregation in American cities. The ANNALS of the American Academy of Political and Social Science, 140(1): 105. https://doi.org/10.1177/000271622814000115
[3] Kulu, H., Lundholm, E., Malmberg, G. (2018). Is spatial mobility on the rise or in decline? An order-specific analysis of the migration of young adults in Sweden. Population Studies, 72(3): 323-337. https://doi.org/10.1080/00324728.2018.1451554
[4] Ahmadi, A. (2005). The factors that influence the physical development of suburban areas are based on aspects of the perception of living in Sengkang City, South Sulawesi Province. Doctoral dissertation, Program Pasca Sarjana Universitas Diponegoro. http://eprints.undip.ac.id/11747/.
[5] Darin-Drabkin, H. (1977). Land Policy and Urban Growth (pp. 256-61). Oxford: Pergamon Press.
[6] Kharisma, E.C.P., Yudana, G., Astuti, W. (2017). The influence of the preference factors for living in the community in choosing residential housing on the physical condition of the environment in the southern suburbs of the city of Surakarta. Architecture, 15(1): 156-164. https://doi.org/10.20961/arst.v15i1.11646
[7] Kinigadner, J., Wenner, F., Bentlage, M., Klug, S., Wulfhorst, G., Thierstein, A. (2016). Future perspectives for the Munich Metropolitan Region–an integrated mobility approach. Transportation Research Procedia, 19: 94-108. https://doi.org/10.1016/j.trpro.2016.12.071
[8] BPS. (2016). Riau migration statistics: Results of the 2015 intercensus population survey. Pekanbaru. https://www.bps.go.id/publication/2016/01/04/dd939b44ca4b5f353bcb54ba/statistik-migrasi-riau-hasil-survei-penduduk-antar-sensus-2015.html.
[9] Arens, A.K., Jansen, M., Preckel, F., Schmidt, I., Brunner, M. (2021). The structure of academic self-concept: A methodological review and empirical illustration of central models. Review of Educational Research, 91(1): 34-72. https://doi.org/10.3102/0034654320972186
[10] Reski, I., Tampubolon, A.C. (2019). Determinants of residential type preferences among students. RUAS (Review of Urbanism and Architectural Studies), 17(1): 17-31. http://dx.doi.org/10.21776/ub.ruas.2019.017.01.2
[11] Syafrina, A., Tampubolon, A.C., Suhendri, S., Hasriyanti, N., Kusuma, H.E. (2018). People's preferences about the neighborhood they want to live in. RUAS (Review of Urbanism and Architectural Studies), 16(1): 32-45. http://dx.doi.org/10.21776/ub.ruas.2018.016.01.3
[12] Khozaei, F., Hassan, A.S., Razak, N.A. (2011). Development and validation of the student accommodation preferences instrument (SAPI). Journal of Building Appraisal, 6(3): 299-313. http://dx.doi.org/10.1057/jba.2011.7
[13] Khozaei, F., Ramayah, T., Hassan, A.S., Surienty, L. (2012). Sense of attachment to place and fulfilled preferences, the mediating role of housing satisfaction. Property Management, 30(3): 292-310. https://doi.org/10.1108/02637471211233945
[14] Mantra, I.B. (1999). Analysis of Labor Mobility. Jakarta.
[15] Marsden, K.E., Ma, W.J., Deci, E.L., Ryan, R.M., Chiu, P.H. (2015). Diminished neural responses predict enhanced intrinsic motivation and sensitivity to external incentive. Cognitive, Affective, & Behavioral Neuroscience, 15(2): 276-286. https://doi.org/10.3758/s13415-014-0324-5
[16] Suhardi, B. (2007). Hansen's gravitational potential model for determining regional population growth. Performa: Media Ilmiah Teknik Industri, 3(1): 28-32.
[17] Lee, E.S. (1980). Migration of the aged. Research on Aging, 2(2): 131-135. https://doi.org/10.1177/016402758022001
[18] Adioetomo, S.M. (2010). Demographic Basics. Jakarta: Salemba Medika. https://onesearch.id/Author/Home?author=Adioetomo%2C+Sri+Moertiningsih.
[19] Bayu, F.S. (2018). Analysis of the factors that encourage the community of Pondok Desa Babadan Subdistrict, Ponorogo Regency to become TKW. Universitas Muhammadiyah Ponorogo. http://eprints.umpo.ac.id/4033/.
[20] Yunus, H.S. (2004). City Spatial Structure. Yogyakarta: Pustaka Pelajar. https://pustakapelajar.co.id/buku/struktur-tata-ruang-kota/.
[21] Porteus, E.L. (1977). On optimal dividend, reinvestment, and liquidation policies for the firm. Operations Research, 25(5): 818-834. https://doi.org/10.1287/opre.25.5.818
[22] Wardana, W. (2007). Developer behavior in site selection and land acquisition for simple housing development. Yogyakarta: Andi Offset.
[23] Yusuf, C. (2006). Hinterland City Housing and Its Dynamics. Bandung: Remaja Rosdakarya.
[24] Koestoer, R.H. (1997). Rural-City Environmental Perspective. Jakarta: UI Press.
[25] Tarigan, R. (2005). Regional Development Planning. Jakarta: Bumi Aksara.
[26] Turner, J.C., Hogg, M.A., Oakes, P.J., Reicher, S.D., Wetherell, M.S. (1987). Rediscovering the social group: A self-categorization theory. basil Blackwell.
[27] Creswell, J.W. (2002). Educational Research: Planning, Conducting, and Evaluating Quantitative (Vol. 7). Prentice Hall Upper Saddle River, NJ.
[28] Creswell, J.W., Creswell, J.D. (2017). Research Design: Qualitative, Quantitative, and Mixed Methods Approaches. Sage Publications.
[29] Hair, J.F., Black, W.C., Babin, B.J., Anderson, R.E. (2010). Multivariate Data Analysis. Vectors. https://doi.org/10.1016/j.ijpharm.2011.02.019
[30] Muslihin, H.Y., Suryana, D., Suherman, U., Dahlan, T.H. (2022). Analysis of the reliability and validity of the self-determination questionnaire using Rasch model. International Journal of Instruction, 15(2): 207–222. https://doi.org/10.29333/iji.2022.15212a
[31] Nur, L., Yulianto, A., Suryana, D., Malik, A.A., Ardha, A., Arif, M., Hong, F. (2022). An analysis of the distribution map of physical education learning motivation through Rasch modeling in elementary school. International Journal of Instruction, 15(2): 815-830. https://doi.org/10.29333/iji.2022.15244a
[32] Hermawan, A. (2010). Stagnation of settlement development (a case study of a ready-to-build area in Maja sub-district, Lebak Banten district). Universitas Diponegoro.
[33] Todaro, M.P. (1998). Economic Development in the Third World, Sixth Edition. https://books.google.co.id/books?id=M9ofKAAACAAJ.
[34] Rustiadi, E., Panuju, D. (1999). Jakarta City Suburbanization. IPB, Bogor. https://repository.ipb.ac.id/jspui/bitstream/123456789/25064/1/Ernan_Rustiadi_Suburbanisasi%20Kota%20Jakarta.PDF.